Races in Edinburg, Texas (TX) Detailed Stats
Data:
Races - White alone (%)
Races - White alone (% change since 2000)
Races - Black alone (%)
Races - Black alone (% change since 2000)
Races - American Indian alone (%)
Races - American Indian alone (% change since 2000)
Races - Asian alone (%)
Races - Asian alone (% change since 2000)
Races - Hispanic (%)
Races - Hispanic (% change since 2000)
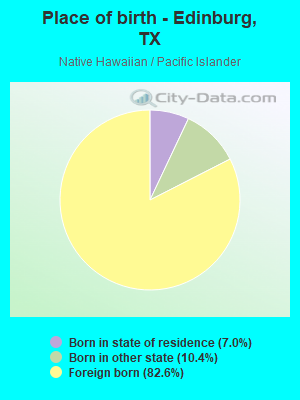
Races - Native Hawaiian and Other Pacific Islander alone (%)
Races - Native Hawaiian and Other Pacific Islander alone (% change since 2000)
Races - Two or more races(%)
Races - Two or more races(% change since 2000)
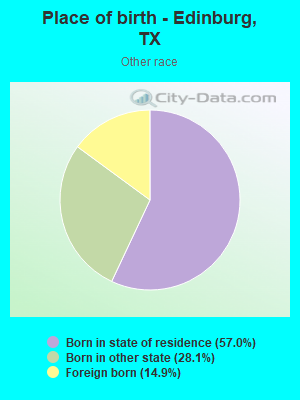
Races - Other race alone (%)
Races - Other race alone (% change since 2000)
Racial diversity
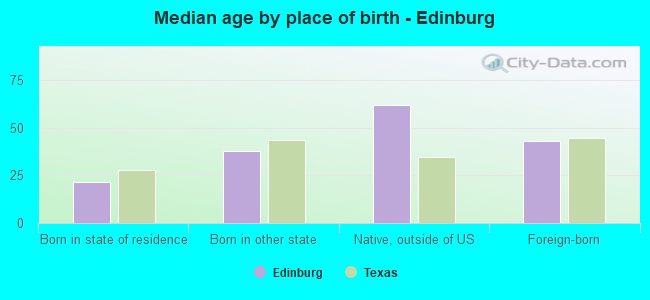
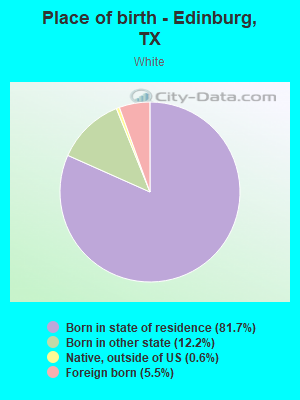
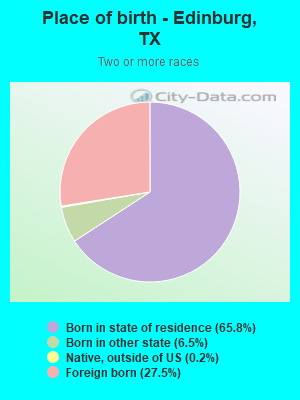
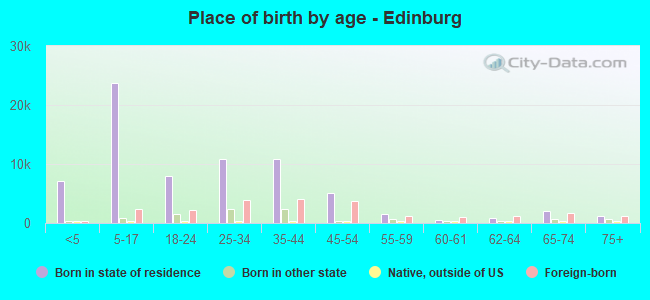
Place of birth - Born in state of residence (%)
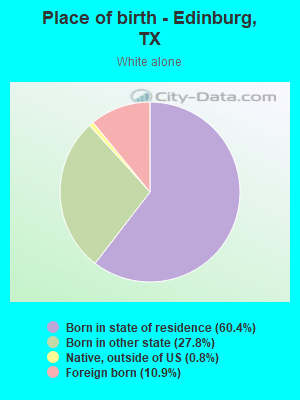
Place of birth - Born in state of residence (%) - White
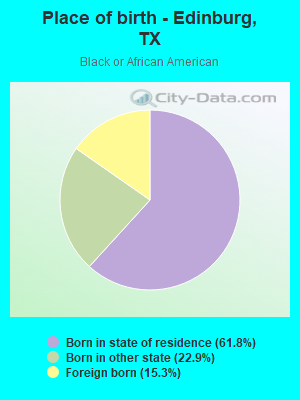
Place of birth - Born in state of residence (%) - Black or African American
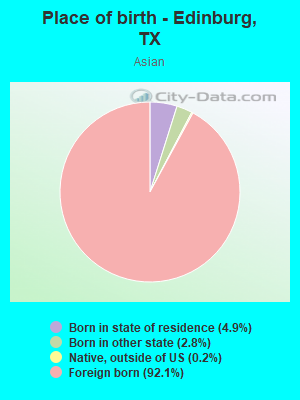
Place of birth - Born in state of residence (%) - Asian
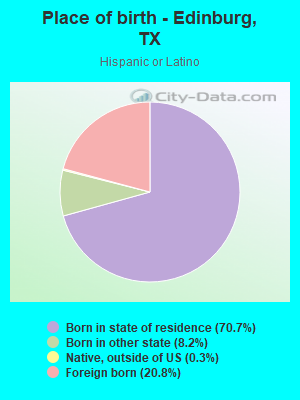
Place of birth - Born in state of residence (%) - Hispanic or Latino
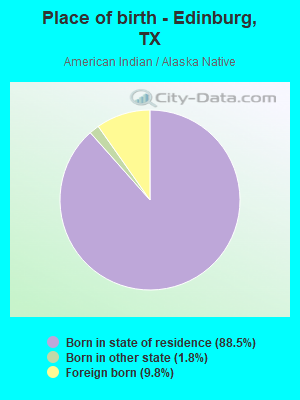
Place of birth - Born in state of residence (%) - American Indian and Alaska Native
Place of birth - Born in state of residence (%) - Multirace
Place of birth - Born in state of residence (%) - Other Race
Place of birth - Born in other state (%)
Place of birth - Born in other state (%) - White
Place of birth - Born in other state (%) - Black or African American
Place of birth - Born in other state (%) - Asian
Place of birth - Born in other state (%) - Hispanic or Latino
Place of birth - Born in other state (%) - American Indian and Alaska Native
Place of birth - Born in other state (%) - Multirace
Place of birth - Born in other state (%) - Other Race
Place of birth - Native, outside of US (%)
Place of birth - Native, outside of US (%) - White
Place of birth - Native, outside of US (%) - Black or African American
Place of birth - Native, outside of US (%) - Asian
Place of birth - Native, outside of US (%) - Hispanic or Latino
Place of birth - Native, outside of US (%) - American Indian and Alaska Native
Place of birth - Native, outside of US (%) - Multirace
Place of birth - Native, outside of US (%) - Other Race
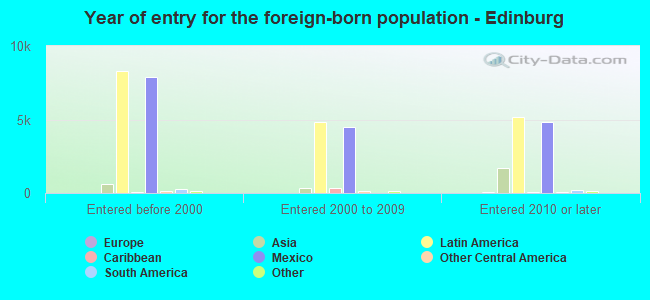
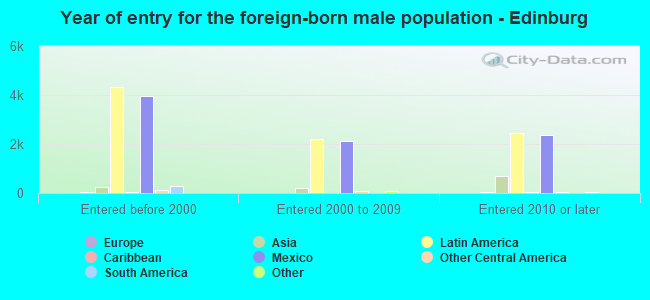
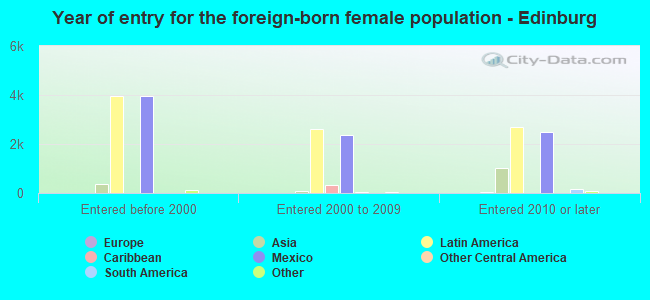
Place of birth - Foreign born (%)
Place of birth - Foreign born (%) - White
Place of birth - Foreign born (%) - Black or African American
Place of birth - Foreign born (%) - Asian
Place of birth - Foreign born (%) - Hispanic or Latino
Place of birth - Foreign born (%) - American Indian and Alaska Native
Place of birth - Foreign born (%) - Multirace
Place of birth - Foreign born (%) - Other Race
Residents speaking English at home (%)
Residents speaking English at home - Born in the United States (%)
Residents speaking English at home - Native, born elsewhere (%)
Residents speaking English at home - Foreign born (%)
Residents speaking Spanish at home (%)
Residents speaking Spanish at home - Born in the United States (%)
Residents speaking Spanish at home - Native, born elsewhere (%)
Residents speaking Spanish at home - Foreign born (%)
Residents speaking other language at home (%)
Residents speaking other language at home - Born in the United States (%)
Residents speaking other language at home - Native, born elsewhere (%)
Residents speaking other language at home - Foreign born (%)
Marital status - Never married (%)
Marital status - Now married (%)
Marital status - Separated (%)
Marital status - Widowed (%)
Marital status - Divorced (%)
Ancestries Reported - Arab (%)
Ancestries Reported - Czech (%)
Ancestries Reported - Danish (%)
Ancestries Reported - Dutch (%)
Ancestries Reported - English (%)
Ancestries Reported - French (%)
Ancestries Reported - French Canadian (%)
Ancestries Reported - German (%)
Ancestries Reported - Greek (%)
Ancestries Reported - Hungarian (%)
Ancestries Reported - Irish (%)
Ancestries Reported - Italian (%)
Ancestries Reported - Lithuanian (%)
Ancestries Reported - Norwegian (%)
Ancestries Reported - Polish (%)
Ancestries Reported - Portuguese (%)
Ancestries Reported - Russian (%)
Ancestries Reported - Scotch-Irish (%)
Ancestries Reported - Scottish (%)
Ancestries Reported - Slovak (%)
Ancestries Reported - Subsaharan African (%)
Ancestries Reported - Swedish (%)
Ancestries Reported - Swiss (%)
Ancestries Reported - Ukrainian (%)
Ancestries Reported - United States (%)
Ancestries Reported - Welsh (%)
Ancestries Reported - West Indian (%)
Ancestries Reported - Other (%)
Geographical mobility - Same house 1 year ago (%)
Geographical mobility - Same house 1 year ago (%) - White
Geographical mobility - Same house 1 year ago (%) - Black or African American
Geographical mobility - Same house 1 year ago (%) - Asian
Geographical mobility - Same house 1 year ago (%) - Hispanic or Latino
Geographical mobility - Same house 1 year ago (%) - American Indian and Alaska Native
Geographical mobility - Same house 1 year ago (%) - Multirace
Geographical mobility - Same house 1 year ago (%) - Other Race
Geographical mobility - Moved within same county (%)
Geographical mobility - Moved within same county (%) - White
Geographical mobility - Moved within same county (%) - Black or African American
Geographical mobility - Moved within same county (%) - Asian
Geographical mobility - Moved within same county (%) - Hispanic or Latino
Geographical mobility - Moved within same county (%) - American Indian and Alaska Native
Geographical mobility - Moved within same county (%) - Multirace
Geographical mobility - Moved within same county (%) - Other Race
Geographical mobility - Moved from different county within same state (%)
Geographical mobility - Moved from different county within same state (%) - White
Geographical mobility - Moved from different county within same state (%) - Black or African American
Geographical mobility - Moved from different county within same state (%) - Asian
Geographical mobility - Moved from different county within same state (%) - Hispanic or Latino
Geographical mobility - Moved from different county within same state (%) - American Indian and Alaska Native
Geographical mobility - Moved from different county within same state (%) - Multirace
Geographical mobility - Moved from different county within same state (%) - Other Race
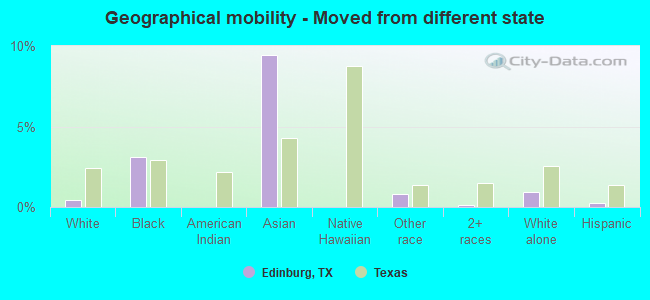
Geographical mobility - Moved from different state (%)
Geographical mobility - Moved from different state (%) - White
Geographical mobility - Moved from different state (%) - Black or African American
Geographical mobility - Moved from different state (%) - Asian
Geographical mobility - Moved from different state (%) - Hispanic or Latino
Geographical mobility - Moved from different state (%) - American Indian and Alaska Native
Geographical mobility - Moved from different state (%) - Multirace
Geographical mobility - Moved from different state (%) - Other Race
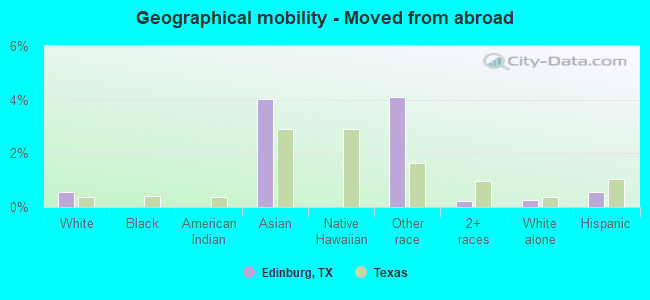
Geographical mobility - Moved from abroad (%)
Geographical mobility - Moved from abroad (%) - White
Geographical mobility - Moved from abroad (%) - Black or African American
Geographical mobility - Moved from abroad (%) - Asian
Geographical mobility - Moved from abroad (%) - Hispanic or Latino
Geographical mobility - Moved from abroad (%) - American Indian and Alaska Native
Geographical mobility - Moved from abroad (%) - Multirace
Geographical mobility - Moved from abroad (%) - Other Race
Place of birth for the foreign-born population - Ireland (%)
Place of birth for the foreign-born population - Denmark (%)
Place of birth for the foreign-born population - Norway (%)
Place of birth for the foreign-born population - Sweden (%)
Place of birth for the foreign-born population - United Kingdom (%)
Place of birth for the foreign-born population - England (%)
Place of birth for the foreign-born population - Scotland (%)
Place of birth for the foreign-born population - Other Northern Europe (%)
Place of birth for the foreign-born population - Austria (%)
Place of birth for the foreign-born population - Belgium (%)
Place of birth for the foreign-born population - France (%)
Place of birth for the foreign-born population - Germany (%)
Place of birth for the foreign-born population - Netherlands (%)
Place of birth for the foreign-born population - Switzerland (%)
Place of birth for the foreign-born population - Other Western Europe (%)
Place of birth for the foreign-born population - Greece (%)
Place of birth for the foreign-born population - Italy (%)
Place of birth for the foreign-born population - Portugal (%)
Place of birth for the foreign-born population - Spain (%)
Place of birth for the foreign-born population - Other Southern Europe (%)
Place of birth for the foreign-born population - Albania (%)
Place of birth for the foreign-born population - Belarus (%)
Place of birth for the foreign-born population - Bosnia and Herzegovina (%)
Place of birth for the foreign-born population - Bulgaria (%)
Place of birth for the foreign-born population - Croatia (%)
Place of birth for the foreign-born population - Czechoslovakia (%)
Place of birth for the foreign-born population - Hungary (%)
Place of birth for the foreign-born population - Latvia (%)
Place of birth for the foreign-born population - Lithuania (%)
Place of birth for the foreign-born population - North Macedonia (Macedonia) (%)
Place of birth for the foreign-born population - Moldova (%)
Place of birth for the foreign-born population - Poland (%)
Place of birth for the foreign-born population - Romania (%)
Place of birth for the foreign-born population - Russia (%)
Place of birth for the foreign-born population - Serbia (%)
Place of birth for the foreign-born population - Ukraine (%)
Place of birth for the foreign-born population - Other Eastern Europe (%)
Place of birth for the foreign-born population - China (%)
Place of birth for the foreign-born population - Hong Kong (%)
Place of birth for the foreign-born population - Taiwan (%)
Place of birth for the foreign-born population - Japan (%)
Place of birth for the foreign-born population - Korea (%)
Place of birth for the foreign-born population - Other Eastern Asia (%)
Place of birth for the foreign-born population - Afghanistan (%)
Place of birth for the foreign-born population - Bangladesh (%)
Place of birth for the foreign-born population - India (%)
Place of birth for the foreign-born population - Iran (%)
Place of birth for the foreign-born population - Kazakhstan (%)
Place of birth for the foreign-born population - Nepal (%)
Place of birth for the foreign-born population - Pakistan (%)
Place of birth for the foreign-born population - Sri Lanka (%)
Place of birth for the foreign-born population - Uzbekistan (%)
Place of birth for the foreign-born population - Other South Central Asia (%)
Place of birth for the foreign-born population - Burma (%)
Place of birth for the foreign-born population - Cambodia (%)
Place of birth for the foreign-born population - Indonesia (%)
Place of birth for the foreign-born population - Laos (%)
Place of birth for the foreign-born population - Malaysia (%)
Place of birth for the foreign-born population - Philippines (%)
Place of birth for the foreign-born population - Singapore (%)
Place of birth for the foreign-born population - Thailand (%)
Place of birth for the foreign-born population - Vietnam (%)
Place of birth for the foreign-born population - Other South Eastern Asia (%)
Place of birth for the foreign-born population - Armenia (%)
Place of birth for the foreign-born population - Iraq (%)
Place of birth for the foreign-born population - Israel (%)
Place of birth for the foreign-born population - Jordan (%)
Place of birth for the foreign-born population - Kuwait (%)
Place of birth for the foreign-born population - Lebanon (%)
Place of birth for the foreign-born population - Saudi Arabia (%)
Place of birth for the foreign-born population - Syria (%)
Place of birth for the foreign-born population - Turkey (%)
Place of birth for the foreign-born population - Yemen (%)
Place of birth for the foreign-born population - Other Western Asia (%)
Place of birth for the foreign-born population - Eritrea (%)
Place of birth for the foreign-born population - Ethiopia (%)
Place of birth for the foreign-born population - Kenya (%)
Place of birth for the foreign-born population - Somalia (%)
Place of birth for the foreign-born population - Uganda (%)
Place of birth for the foreign-born population - Zimbabwe (%)
Place of birth for the foreign-born population - Other Eastern Africa (%)
Place of birth for the foreign-born population - Cameroon (%)
Place of birth for the foreign-born population - Congo (%)
Place of birth for the foreign-born population - Democratic Republic of Congo (Zaire) (%)
Place of birth for the foreign-born population - Other Middle Africa (%)
Place of birth for the foreign-born population - Egypt (%)
Place of birth for the foreign-born population - Morocco (%)
Place of birth for the foreign-born population - Sudan (%)
Place of birth for the foreign-born population - Other Northern Africa (%)
Place of birth for the foreign-born population - South Africa (%)
Place of birth for the foreign-born population - Other Southern Africa (%)
Place of birth for the foreign-born population - Cabo Verde (%)
Place of birth for the foreign-born population - Ghana (%)
Place of birth for the foreign-born population - Liberia (%)
Place of birth for the foreign-born population - Nigeria (%)
Place of birth for the foreign-born population - Senegal (%)
Place of birth for the foreign-born population - Sierra Leone (%)
Place of birth for the foreign-born population - Other Western Africa (%)
Place of birth for the foreign-born population - Australia (%)
Place of birth for the foreign-born population - New Zealand (%)
Place of birth for the foreign-born population - Fiji (%)
Place of birth for the foreign-born population - Micronesia (%)
Place of birth for the foreign-born population - Bahamas (%)
Place of birth for the foreign-born population - Barbados (%)
Place of birth for the foreign-born population - Cuba (%)
Place of birth for the foreign-born population - Dominica (%)
Place of birth for the foreign-born population - Dominican Republic (%)
Place of birth for the foreign-born population - Grenada (%)
Place of birth for the foreign-born population - Haiti (%)
Place of birth for the foreign-born population - Jamaica (%)
Place of birth for the foreign-born population - St. Vincent and the Grenadines (%)
Place of birth for the foreign-born population - Trinidad and Tobago (%)
Place of birth for the foreign-born population - West Indies (%)
Place of birth for the foreign-born population - Other Caribbean (%)
Place of birth for the foreign-born population - Belize (%)
Place of birth for the foreign-born population - Costa Rica (%)
Place of birth for the foreign-born population - El Salvador (%)
Place of birth for the foreign-born population - Guatemala (%)
Place of birth for the foreign-born population - Honduras (%)
Place of birth for the foreign-born population - Mexico (%)
Place of birth for the foreign-born population - Nicaragua (%)
Place of birth for the foreign-born population - Panama (%)
Place of birth for the foreign-born population - Other Central America (%)
Place of birth for the foreign-born population - Argentina (%)
Place of birth for the foreign-born population - Bolivia (%)
Place of birth for the foreign-born population - Brazil (%)
Place of birth for the foreign-born population - Chile (%)
Place of birth for the foreign-born population - Colombia (%)
Place of birth for the foreign-born population - Ecuador (%)
Place of birth for the foreign-born population - Guyana (%)
Place of birth for the foreign-born population - Peru (%)
Place of birth for the foreign-born population - Uruguay (%)
Place of birth for the foreign-born population - Venezuela (%)
Place of birth for the foreign-born population - Other South America (%)
Place of birth for the foreign-born population - Canada (%)
Place of birth for the foreign-born population - Other Northern America (%)
Place of birth for the foreign-born population - Other (%)
Latest news about races in Edinburg, TX collected exclusively by city-data.com from local newspapers, TV, and radio stations
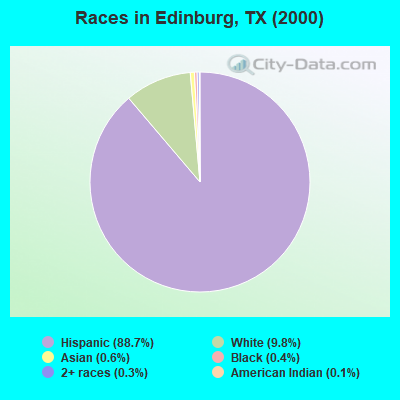
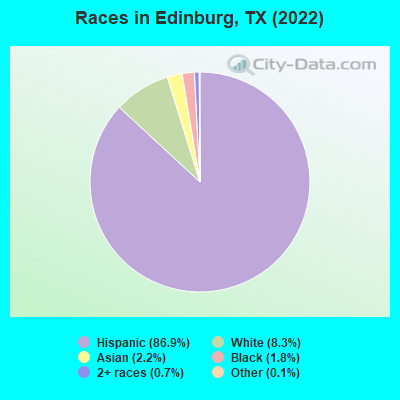
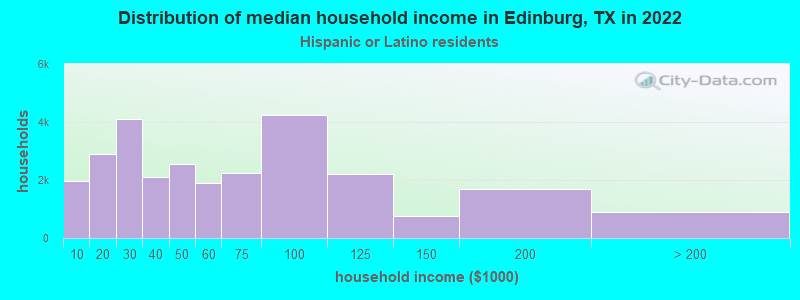
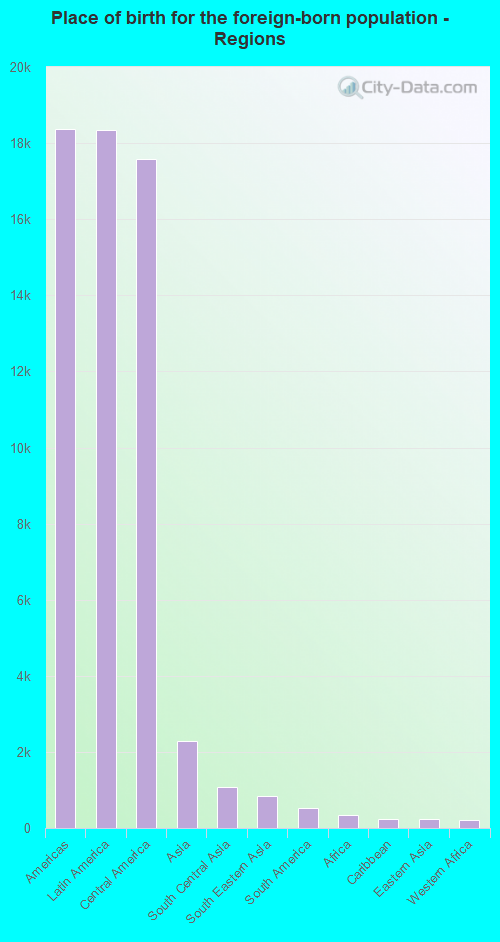
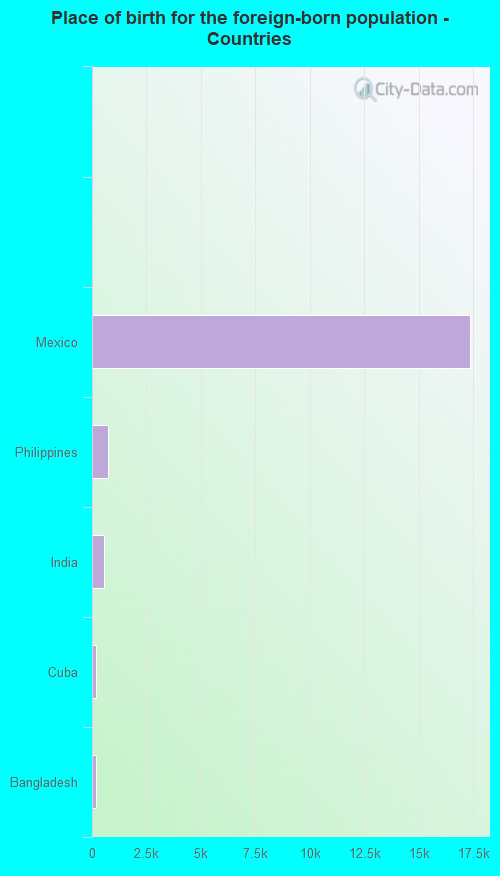
According to 2022 data, the most numerous races in Edinburg, TX are Hispanic (89,287 residents), White alone (8,514 residents), and Black alone (1,877 residents). 31.2% of Edinburg residents speak English at home. 20.6% of Edinburg, TX residents are foreign-born (17.5% born in Latin America, 2.2% born in Asia), which is 17.3% greater than the foreign-born rate of 17.0% across the entire state of Texas.
Race distribution in Edinburg
2000 2022
10,933,313 52.4% White alone 6,669,666 32.0% Hispanic 2,364,255 11.3% Black alone 554,445 2.7% Asian alone 230,567 1.1% Two or more races 68,859 0.3% American Indian alone 19,958 0.10% Other race alone 10,757 0.05% Native Hawaiian and Other
12,070,642 40.2% Hispanic 11,683,430 38.9% White alone 3,508,706 11.7% Black alone 1,608,173 5.4% Asian alone 956,560 3.2% Two or more races 125,763 0.4% Other race alone 47,023 0.2% American Indian alone 29,275 0.10% Native Hawaiian and Other
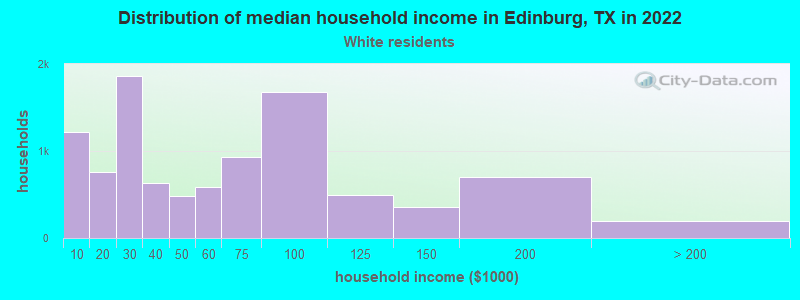
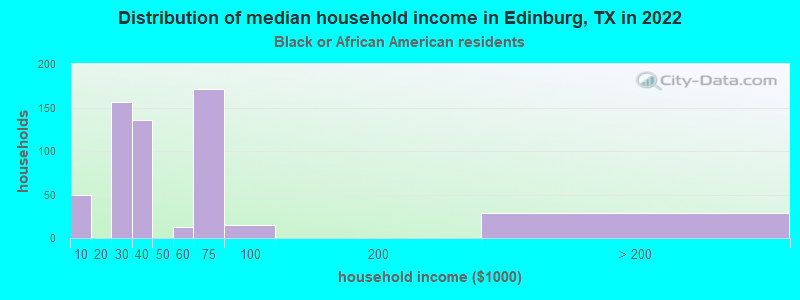
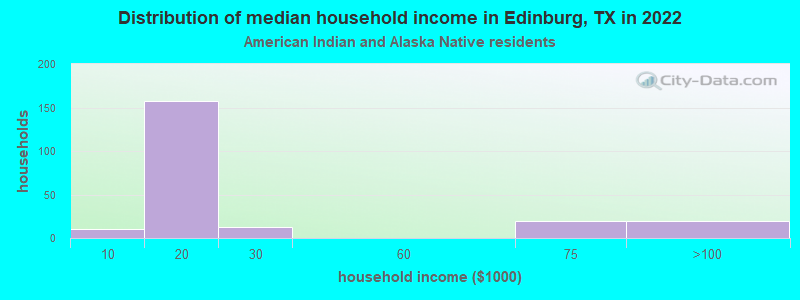
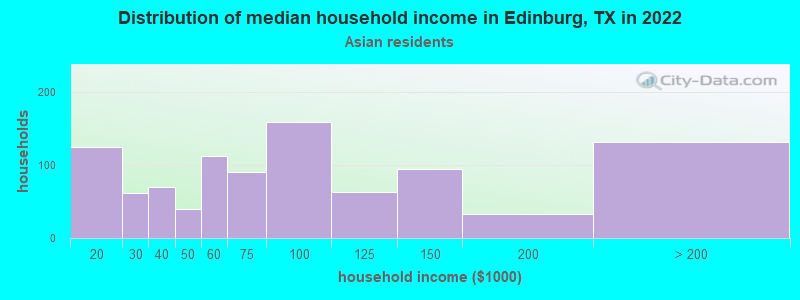
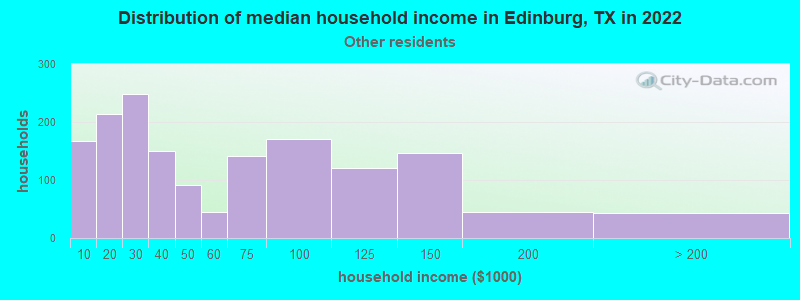
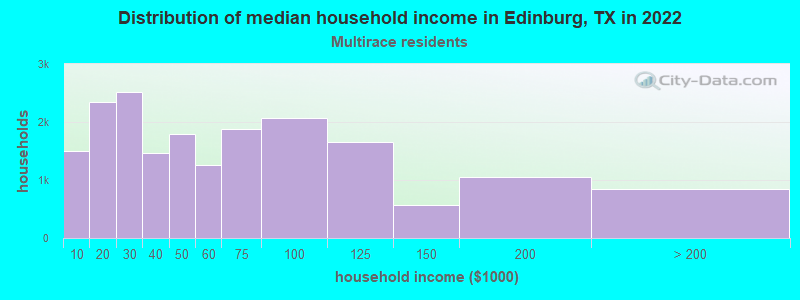
Income and house value in Edinburg Median household income in 2022 $64,604 White non-Hispanic householders$67,807 Black householders$98,220 Asian householders$38,753 Some other race householders$47,455 Two or more races householders$50,707 Hispanic or Latino race householdersMedian 2022 house value $251,730 White Non-Hispanic householders$103,726 Black or African American householders$313,967 American Indian or Alaska Native householders $282,694 Asian householders$173,703 Some other race householders$187,327 Two or more races householders$182,992 Hispanic or Latino householders
Median age by race in Edinburg
28.2 Median age for White residents28.9 27.2 14.1 Median age for Black or African American residents12.9 14.2 40.0 Median age for American Indian / Alaska Native residents-666,666,666.0 -666,666,666.0 27.8 Median age for Asian residents34.0 27.3 -666,666,666.0 Median age for Native Hawaiian / Pacific Islander residents-666,666,666.0 -666,666,666.0 27.3 Median age for Other race residents29.5 22.6 30.1 Median age for Two or more races residents30.1 30.1 31.5 Median age for White alone residents29.7 32.3 28.9 Median age for Hispanic or Latino residents29.2 28.2
Owner/renter occupied households by race in Edinburg
House owners and renters - White residents 5,753 58.1% Owner occupied4,149 41.9% Renter occupiedHouse owners and renters - Black or African American residents 74 16.0% Owner occupied387 84.0% Renter occupiedHouse owners and renters - American Indian / Alaska Native residents 51 20.6% Owner occupied198 79.4% Renter occupiedHouse owners and renters - Asian residents 267 29.8% Owner occupied628 70.2% Renter occupiedHouse owners and renters - Native Hawaiian / Pacific Islander residents 6 62.2% Owner occupied4 37.8% Renter occupiedHouse owners and renters - Other race residents 1,556 71.5% Owner occupied619 28.5% Renter occupiedHouse owners and renters - Two or more races residents 10,272 54.3% Owner occupied8,657 45.7% Renter occupiedHouse owners and renters - White alone residents 1,451 42.7% Owner occupied1,947 57.3% Renter occupiedHouse owners and renters - Hispanic or Latino residents 16,108 58.4% Owner occupied11,473 41.6% Renter occupied
Language usage in Edinburg
English speakers - Total 31.2% of residents of Edinburg speak English at home.
65.7% of residents speak Spanish at home 43,317 68.0% Speak English very well20,389 32.0% Speak English less than very well3.1% of residents speak other language at home 1,427 47.3% Speak English very well1,592 52.7% Speak English less than very well
English speakers - Born in the United States 45.1% of residents of Edinburg speak English at home.
54.9% of residents speak Spanish at home 4,684 85.2% Speak English very well815 14.8% Speak English less than very well
English speakers - Native, born elsewhere 27.2% of residents of Edinburg speak English at home.
61.5% of residents speak Spanish at home 100 48.5% Speak English very well106 51.5% Speak English less than very well11.3% of residents speak other language at home 38 100.0% Speak English very well
English speakers - Foreign-born 6.6% of residents of Edinburg speak English at home.
80.3% of residents speak Spanish at home 5,940 33.1% Speak English very well12,000 66.9% Speak English less than very well13.1% of residents speak other language at home 1,343 45.8% Speak English very well1,592 54.2% Speak English less than very well
White (Caucasian) - Speak only English Native:
51.3% (13,561)Foreign-born:
9.6% (147)
White (Caucasian) - Speak another language Native:
48.7% (12,850)Foreign-born:
90.4% (1,390)
Black or African American - Speak only English Native:
95.3% (1,536)Foreign-born:
47.3% (153)
Black or African American - Speak another language Native:
4.7% (75)Foreign-born:
50.3% (162)
American Indian / Alaska Native - Speak another language Native:
80.3% (196)Foreign-born:
98.9% (38)
Asian - Speak only English Native:
51.4% (70)Foreign-born:
6.6% (149)
Asian - Speak another language Native:
37.5% (51)Foreign-born:
93.6% (2,106)
Other race - Speak another language Native:
55.4% (3,445)Foreign-born:
100.0% (1,156)
Two or more races - Speak only English Native:
25.2% (9,936)Foreign-born:
5.2% (877)
Two or more races - Speak another language Native:
74.8% (29,480)Foreign-born:
94.8% (16,119)
White alone - Speak only English Native:
73.5% (5,667)Foreign-born:
12.8% (51)
White alone - Speak another language Native:
26.3% (2,031)Foreign-born:
100.0% (403)
Hispanic or Latino - Speak only English Native:
32.8% (21,317)Foreign-born:
5.1% (961)
Hispanic or Latino - Speak another language Native:
67.2% (43,644)Foreign-born:
94.9% (17,873)
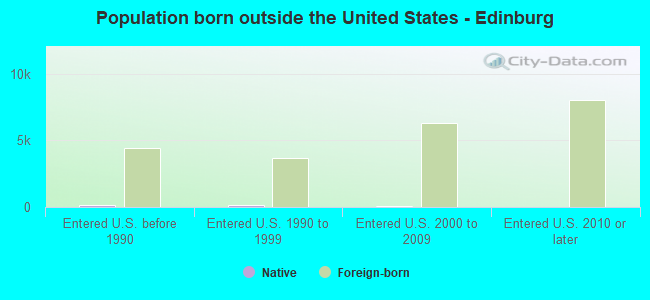
Foreign-born residents in Edinburg 21,118 residents are foreign born (17.5% Latin America , 2.2% Asia ).
This city:
20.6%Texas:
17.1%
Marital status for residents in Edinburg Marital status - White (Caucasian) population 15 years and over
Males 40.1% Never married53.0% Now married0.6% Separated2.0% Widowed4.2% DivorcedFemales 39.3% Never married41.0% Now married2.9% Separated3.6% Widowed13.1% DivorcedWomen who gave birth in the past 12 months Now married:
56.3% (125)Unmarried:
43.7% (97)
Women who did not give birth in the past 12 months Now married:
37.4% (2,122)Unmarried:
62.6% (3,547)
Marital status - Black or African American population 15 years and over
Males 63.4% Never married27.2% Now married3.3% Separated0.7% Widowed5.3% DivorcedFemales 71.1% Never married8.4% Now married19.4% Separated0.0% Widowed1.1% DivorcedWomen who gave birth in the past 12 months Now married:
26.7% (40)Unmarried:
73.3% (111)
Women who did not give birth in the past 12 months Now married:
20.7% (58)Unmarried:
79.3% (220)
Marital status - American Indian / Alaska Native population 15 years and over
Males 37.8% Never married13.3% Now married0.0% Separated0.0% Widowed48.9% DivorcedFemales 56.4% Never married8.2% Now married0.0% Separated13.6% Widowed21.8% DivorcedWomen who did not give birth in the past 12 months Now married:
0.0% (0)Unmarried:
100.0% (110)
Marital status - Asian population 15 years and over
Males 20.6% Never married66.7% Now married0.0% Separated2.0% Widowed10.7% DivorcedFemales 25.4% Never married62.1% Now married1.3% Separated1.1% Widowed10.1% DivorcedWomen who gave birth in the past 12 months Now married:
100.0% (27)Unmarried:
0.0% (0)
Women who did not give birth in the past 12 months Now married:
53.7% (318)Unmarried:
46.3% (275)
Marital status - Native Hawaiian / Pacific Islander population 15 years and over
Males 0.0% Never married57.1% Now married0.0% Separated0.0% Widowed42.9% DivorcedFemales 0.0% Never married0.0% Now married0.0% Separated100.0% Widowed0.0% DivorcedMarital status - Other race population 15 years and over
Males 52.3% Never married34.5% Now married4.3% Separated0.2% Widowed8.8% DivorcedFemales 53.7% Never married34.7% Now married1.9% Separated3.3% Widowed6.4% DivorcedWomen who gave birth in the past 12 months Now married:
44.1% (13)Unmarried:
55.9% (17)
Women who did not give birth in the past 12 months Now married:
28.2% (415)Unmarried:
71.8% (1,056)
Marital status - Two or more races population 15 years and over
Males 48.4% Never married41.2% Now married3.1% Separated0.2% Widowed7.1% DivorcedFemales 40.5% Never married38.6% Now married4.5% Separated3.0% Widowed13.4% DivorcedWomen who gave birth in the past 12 months Now married:
9.2% (67)Unmarried:
90.8% (658)
Women who did not give birth in the past 12 months Now married:
35.2% (5,645)Unmarried:
64.8% (10,372)
Marital status - White alone, not Hispanic / Latino population 15 years and over
Males 45.1% Never married40.7% Now married0.0% Separated5.6% Widowed8.6% DivorcedFemales 48.1% Never married33.8% Now married2.5% Separated1.0% Widowed14.5% DivorcedWomen who gave birth in the past 12 months Now married:
69.7% (49)Unmarried:
30.3% (21)
Women who did not give birth in the past 12 months Now married:
44.0% (772)Unmarried:
56.0% (981)
Marital status - Hispanic or Latino population 15 years and over
Males 45.3% Never married46.3% Now married2.5% Separated0.1% Widowed5.9% DivorcedFemales 40.9% Never married39.7% Now married4.1% Separated3.2% Widowed12.1% DivorcedWomen who gave birth in the past 12 months Now married:
7.5% (67)Unmarried:
92.5% (827)
Women who did not give birth in the past 12 months Now married:
38.2% (9,116)Unmarried:
61.8% (14,731)
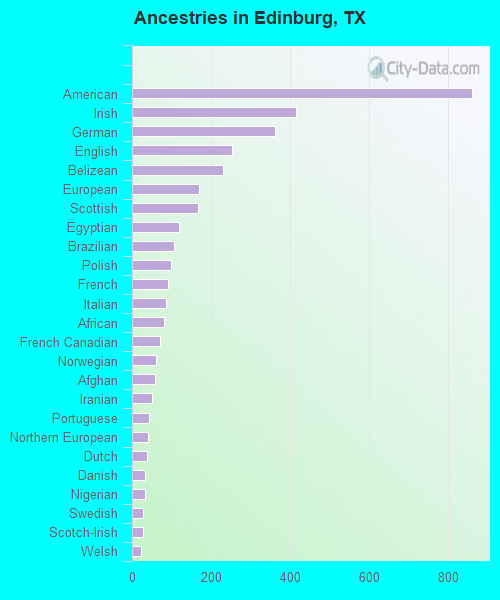
Ancestries in Edinburg
861 1.1% American416 0.5% Irish361 0.4% German253 0.3% English231 0.3% Belizean170 0.2% European168 0.2% Scottish119 0.1% Egyptian106 0.1% Brazilian99 0.1% Polish91 0.1% French86 0.1% Italian80 0.10% African72 0.09% French Canadian60 0.07% Norwegian58 0.07% Afghan50 0.06% Iranian42 0.05% Portuguese41 0.05% Northern European37 0.05% Dutch34 0.04% Danish32 0.04% Nigerian28 0.03% Swedish27 0.03% Scotch-Irish22 0.03% Welsh15 0.02% Canadian12 0.01% Czech
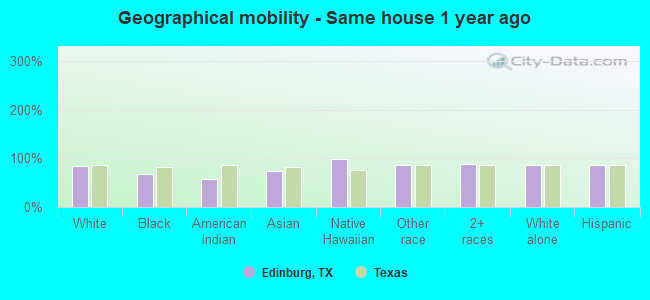
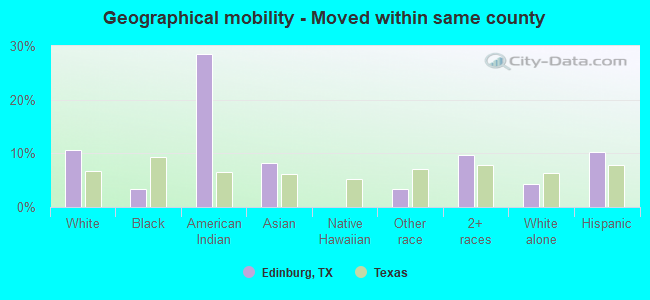
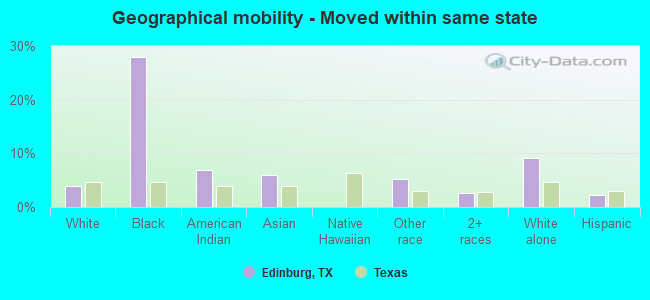
Geographical mobility in Edinburg Same house 1 year ago 20,421 85.1% White (Caucasian)1,384 66.9% Black or African American171 58.5% American Indian / Alaska Native1,747 73.3% Asian63 98.2% Native Hawaiian / Pacific Islander6,623 86.5% Other race53,282 87.4% Two or more races7,318 86.3% White alone, not Hispanic / Latino77,571 86.8% Hispanic or LatinoMoved within same county 2,572 10.7% White / Caucasian69 3.3% Black or African American83 28.5% American Indian / Alaska Native195 8.2% Asian259 3.4% Other race5,885 9.7% Two or more races368 4.3% White alone, not Hispanic / Latino9,140 10.2% Hispanic or LatinoMoved within same state 953 4.0% White / Caucasian578 27.9% Black or African American20 7.0% American Indian / Alaska Native144 6.0% Asian401 5.2% Other race1,559 2.6% Two or more races768 9.1% White alone, not Hispanic / Latino1,978 2.2% Hispanic or LatinoMoved from different state 99 0.4% White / Caucasian64 3.1% Black or African American225 9.5% Asian62 0.8% Other race70 0.1% Two or more races80 0.9% White alone, not Hispanic / Latino218 0.2% Hispanic or LatinoMoved from abroad 136 0.6% White96 4.0% Asian314 4.1% Other race136 0.2% Two or more races23 0.3% White alone, not Hispanic / Latino504 0.6% Hispanic or Latino
Children Nativity (place of birth) in Edinburg
Children under 6 years - Living with two parents Both parents native 2,843 100.0% NativeBoth parents foreign-born 330 100.0% NativeOne native, one foreign-born parent 312 100.0% NativeChildren under 6 years - Living with one parent Native parent 3,806 100.0% NativeForeign-born parent 1,104 93.0% Native83 7.0% Foreign-bornChildren 6 to 17 years - Living with two parents Both parents native 10,220 100.0% NativeBoth parents foreign-born 1,913 50.0% Native1,911 50.0% Foreign-bornOne native, one foreign-born parent 1,023 100.0% NativeChildren 6 to 17 years - Living with one parent Native parent 4,962 100.0% NativeForeign-born parent 4,098 52.7% Native3,674 47.3% Foreign-born
Grandparents responsible for own grandchildren in Edinburg
Grandparents (30 to 59 years) White / Caucasian 63 14.6% Responsible for grandchildren371 85.4% Not responsible for grandchildrenAsian 13 100.0% Not responsible for grandchildrenOther race 6 100.0% Not responsible for grandchildrenTwo or more races 538 46.5% Responsible for grandchildren620 53.5% Not responsible for grandchildrenWhite alone, not Hispanic / Latino 6 10.5% Responsible for grandchildren49 89.5% Not responsible for grandchildrenHispanic or Latino 538 44.1% Responsible for grandchildren681 55.9% Not responsible for grandchildrenGrandparents (60 years and over) White / Caucasian 82 15.6% Responsible for grandchildren444 84.4% Not responsible for grandchildrenAsian 15 100.0% Not responsible for grandchildrenOther race 20 100.0% Not responsible for grandchildrenTwo or more races 422 33.0% Responsible for grandchildren856 67.0% Not responsible for grandchildrenWhite alone, not Hispanic / Latino 9 8.8% Responsible for grandchildren95 91.2% Not responsible for grandchildrenHispanic or Latino 422 22.3% Responsible for grandchildren1,467 77.7% Not responsible for grandchildren