Races in Egypt Lake-Leto, Florida (FL) Detailed Stats
Data:
Races - White alone (%)
Races - White alone (% change since 2000)
Races - Black alone (%)
Races - Black alone (% change since 2000)
Races - American Indian alone (%)
Races - American Indian alone (% change since 2000)
Races - Asian alone (%)
Races - Asian alone (% change since 2000)
Races - Hispanic (%)
Races - Hispanic (% change since 2000)
Races - Native Hawaiian and Other Pacific Islander alone (%)
Races - Native Hawaiian and Other Pacific Islander alone (% change since 2000)
Races - Two or more races(%)
Races - Two or more races(% change since 2000)
Races - Other race alone (%)
Races - Other race alone (% change since 2000)
Racial diversity
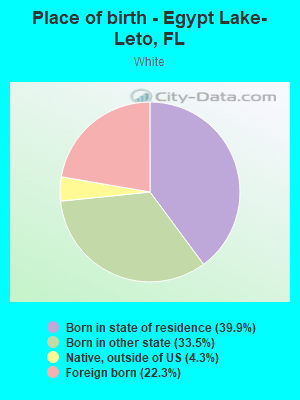
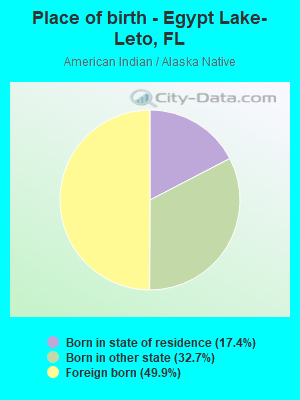
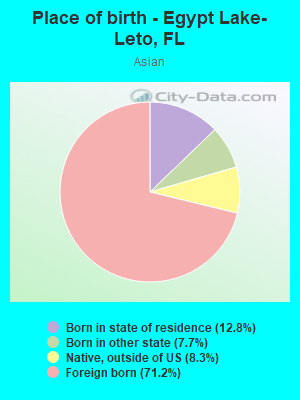
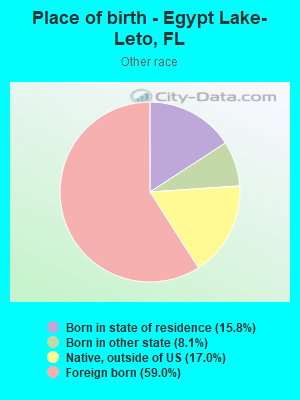
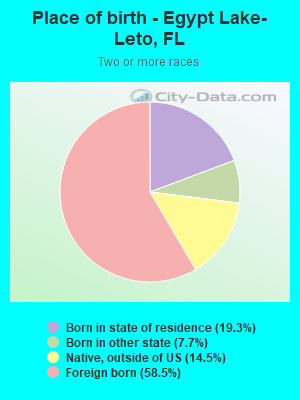
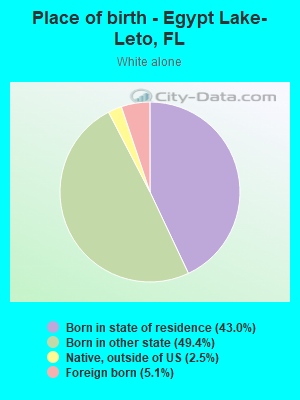
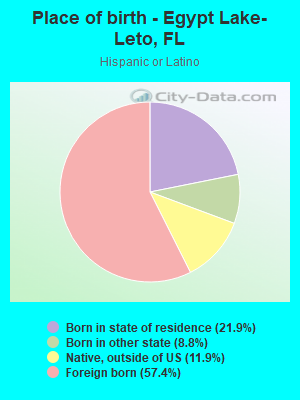
Place of birth - Born in state of residence (%)
Place of birth - Born in state of residence (%) - White
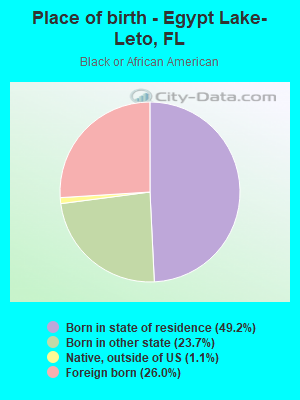
Place of birth - Born in state of residence (%) - Black or African American
Place of birth - Born in state of residence (%) - Asian
Place of birth - Born in state of residence (%) - Hispanic or Latino
Place of birth - Born in state of residence (%) - American Indian and Alaska Native
Place of birth - Born in state of residence (%) - Multirace
Place of birth - Born in state of residence (%) - Other Race
Place of birth - Born in other state (%)
Place of birth - Born in other state (%) - White
Place of birth - Born in other state (%) - Black or African American
Place of birth - Born in other state (%) - Asian
Place of birth - Born in other state (%) - Hispanic or Latino
Place of birth - Born in other state (%) - American Indian and Alaska Native
Place of birth - Born in other state (%) - Multirace
Place of birth - Born in other state (%) - Other Race
Place of birth - Native, outside of US (%)
Place of birth - Native, outside of US (%) - White
Place of birth - Native, outside of US (%) - Black or African American
Place of birth - Native, outside of US (%) - Asian
Place of birth - Native, outside of US (%) - Hispanic or Latino
Place of birth - Native, outside of US (%) - American Indian and Alaska Native
Place of birth - Native, outside of US (%) - Multirace
Place of birth - Native, outside of US (%) - Other Race
Place of birth - Foreign born (%)
Place of birth - Foreign born (%) - White
Place of birth - Foreign born (%) - Black or African American
Place of birth - Foreign born (%) - Asian
Place of birth - Foreign born (%) - Hispanic or Latino
Place of birth - Foreign born (%) - American Indian and Alaska Native
Place of birth - Foreign born (%) - Multirace
Place of birth - Foreign born (%) - Other Race
Residents speaking English at home (%)
Residents speaking English at home - Born in the United States (%)
Residents speaking English at home - Native, born elsewhere (%)
Residents speaking English at home - Foreign born (%)
Residents speaking Spanish at home (%)
Residents speaking Spanish at home - Born in the United States (%)
Residents speaking Spanish at home - Native, born elsewhere (%)
Residents speaking Spanish at home - Foreign born (%)
Residents speaking other language at home (%)
Residents speaking other language at home - Born in the United States (%)
Residents speaking other language at home - Native, born elsewhere (%)
Residents speaking other language at home - Foreign born (%)
Marital status - Never married (%)
Marital status - Now married (%)
Marital status - Separated (%)
Marital status - Widowed (%)
Marital status - Divorced (%)
Ancestries Reported - Arab (%)
Ancestries Reported - Czech (%)
Ancestries Reported - Danish (%)
Ancestries Reported - Dutch (%)
Ancestries Reported - English (%)
Ancestries Reported - French (%)
Ancestries Reported - French Canadian (%)
Ancestries Reported - German (%)
Ancestries Reported - Greek (%)
Ancestries Reported - Hungarian (%)
Ancestries Reported - Irish (%)
Ancestries Reported - Italian (%)
Ancestries Reported - Lithuanian (%)
Ancestries Reported - Norwegian (%)
Ancestries Reported - Polish (%)
Ancestries Reported - Portuguese (%)
Ancestries Reported - Russian (%)
Ancestries Reported - Scotch-Irish (%)
Ancestries Reported - Scottish (%)
Ancestries Reported - Slovak (%)
Ancestries Reported - Subsaharan African (%)
Ancestries Reported - Swedish (%)
Ancestries Reported - Swiss (%)
Ancestries Reported - Ukrainian (%)
Ancestries Reported - United States (%)
Ancestries Reported - Welsh (%)
Ancestries Reported - West Indian (%)
Ancestries Reported - Other (%)
Geographical mobility - Same house 1 year ago (%)
Geographical mobility - Same house 1 year ago (%) - White
Geographical mobility - Same house 1 year ago (%) - Black or African American
Geographical mobility - Same house 1 year ago (%) - Asian
Geographical mobility - Same house 1 year ago (%) - Hispanic or Latino
Geographical mobility - Same house 1 year ago (%) - American Indian and Alaska Native
Geographical mobility - Same house 1 year ago (%) - Multirace
Geographical mobility - Same house 1 year ago (%) - Other Race
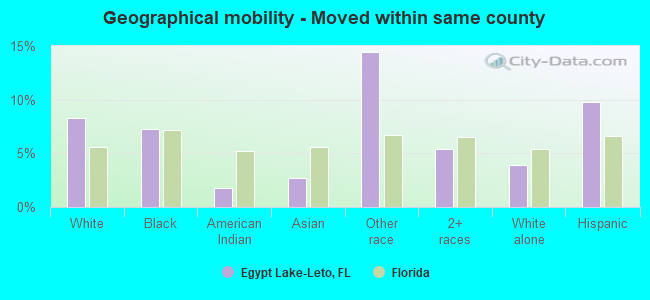
Geographical mobility - Moved within same county (%)
Geographical mobility - Moved within same county (%) - White
Geographical mobility - Moved within same county (%) - Black or African American
Geographical mobility - Moved within same county (%) - Asian
Geographical mobility - Moved within same county (%) - Hispanic or Latino
Geographical mobility - Moved within same county (%) - American Indian and Alaska Native
Geographical mobility - Moved within same county (%) - Multirace
Geographical mobility - Moved within same county (%) - Other Race
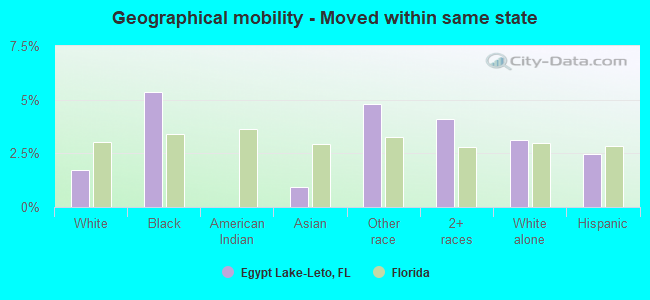
Geographical mobility - Moved from different county within same state (%)
Geographical mobility - Moved from different county within same state (%) - White
Geographical mobility - Moved from different county within same state (%) - Black or African American
Geographical mobility - Moved from different county within same state (%) - Asian
Geographical mobility - Moved from different county within same state (%) - Hispanic or Latino
Geographical mobility - Moved from different county within same state (%) - American Indian and Alaska Native
Geographical mobility - Moved from different county within same state (%) - Multirace
Geographical mobility - Moved from different county within same state (%) - Other Race
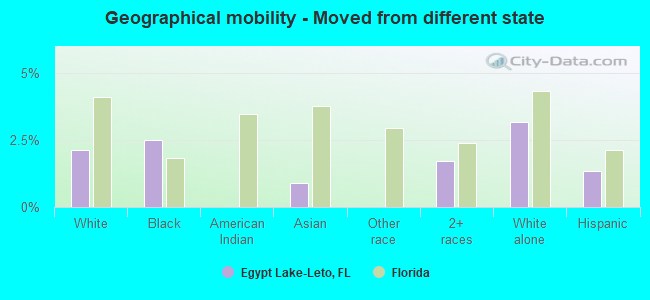
Geographical mobility - Moved from different state (%)
Geographical mobility - Moved from different state (%) - White
Geographical mobility - Moved from different state (%) - Black or African American
Geographical mobility - Moved from different state (%) - Asian
Geographical mobility - Moved from different state (%) - Hispanic or Latino
Geographical mobility - Moved from different state (%) - American Indian and Alaska Native
Geographical mobility - Moved from different state (%) - Multirace
Geographical mobility - Moved from different state (%) - Other Race
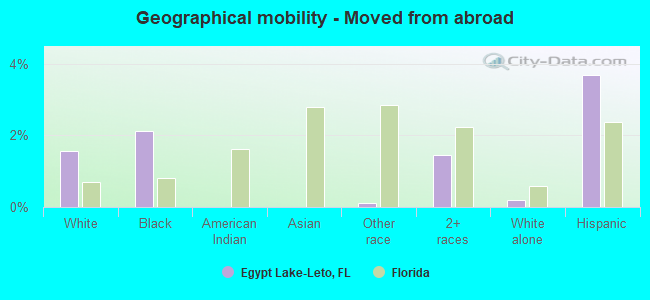
Geographical mobility - Moved from abroad (%)
Geographical mobility - Moved from abroad (%) - White
Geographical mobility - Moved from abroad (%) - Black or African American
Geographical mobility - Moved from abroad (%) - Asian
Geographical mobility - Moved from abroad (%) - Hispanic or Latino
Geographical mobility - Moved from abroad (%) - American Indian and Alaska Native
Geographical mobility - Moved from abroad (%) - Multirace
Geographical mobility - Moved from abroad (%) - Other Race
Place of birth for the foreign-born population - Ireland (%)
Place of birth for the foreign-born population - Denmark (%)
Place of birth for the foreign-born population - Norway (%)
Place of birth for the foreign-born population - Sweden (%)
Place of birth for the foreign-born population - United Kingdom (%)
Place of birth for the foreign-born population - England (%)
Place of birth for the foreign-born population - Scotland (%)
Place of birth for the foreign-born population - Other Northern Europe (%)
Place of birth for the foreign-born population - Austria (%)
Place of birth for the foreign-born population - Belgium (%)
Place of birth for the foreign-born population - France (%)
Place of birth for the foreign-born population - Germany (%)
Place of birth for the foreign-born population - Netherlands (%)
Place of birth for the foreign-born population - Switzerland (%)
Place of birth for the foreign-born population - Other Western Europe (%)
Place of birth for the foreign-born population - Greece (%)
Place of birth for the foreign-born population - Italy (%)
Place of birth for the foreign-born population - Portugal (%)
Place of birth for the foreign-born population - Spain (%)
Place of birth for the foreign-born population - Other Southern Europe (%)
Place of birth for the foreign-born population - Albania (%)
Place of birth for the foreign-born population - Belarus (%)
Place of birth for the foreign-born population - Bosnia and Herzegovina (%)
Place of birth for the foreign-born population - Bulgaria (%)
Place of birth for the foreign-born population - Croatia (%)
Place of birth for the foreign-born population - Czechoslovakia (%)
Place of birth for the foreign-born population - Hungary (%)
Place of birth for the foreign-born population - Latvia (%)
Place of birth for the foreign-born population - Lithuania (%)
Place of birth for the foreign-born population - North Macedonia (Macedonia) (%)
Place of birth for the foreign-born population - Moldova (%)
Place of birth for the foreign-born population - Poland (%)
Place of birth for the foreign-born population - Romania (%)
Place of birth for the foreign-born population - Russia (%)
Place of birth for the foreign-born population - Serbia (%)
Place of birth for the foreign-born population - Ukraine (%)
Place of birth for the foreign-born population - Other Eastern Europe (%)
Place of birth for the foreign-born population - China (%)
Place of birth for the foreign-born population - Hong Kong (%)
Place of birth for the foreign-born population - Taiwan (%)
Place of birth for the foreign-born population - Japan (%)
Place of birth for the foreign-born population - Korea (%)
Place of birth for the foreign-born population - Other Eastern Asia (%)
Place of birth for the foreign-born population - Afghanistan (%)
Place of birth for the foreign-born population - Bangladesh (%)
Place of birth for the foreign-born population - India (%)
Place of birth for the foreign-born population - Iran (%)
Place of birth for the foreign-born population - Kazakhstan (%)
Place of birth for the foreign-born population - Nepal (%)
Place of birth for the foreign-born population - Pakistan (%)
Place of birth for the foreign-born population - Sri Lanka (%)
Place of birth for the foreign-born population - Uzbekistan (%)
Place of birth for the foreign-born population - Other South Central Asia (%)
Place of birth for the foreign-born population - Burma (%)
Place of birth for the foreign-born population - Cambodia (%)
Place of birth for the foreign-born population - Indonesia (%)
Place of birth for the foreign-born population - Laos (%)
Place of birth for the foreign-born population - Malaysia (%)
Place of birth for the foreign-born population - Philippines (%)
Place of birth for the foreign-born population - Singapore (%)
Place of birth for the foreign-born population - Thailand (%)
Place of birth for the foreign-born population - Vietnam (%)
Place of birth for the foreign-born population - Other South Eastern Asia (%)
Place of birth for the foreign-born population - Armenia (%)
Place of birth for the foreign-born population - Iraq (%)
Place of birth for the foreign-born population - Israel (%)
Place of birth for the foreign-born population - Jordan (%)
Place of birth for the foreign-born population - Kuwait (%)
Place of birth for the foreign-born population - Lebanon (%)
Place of birth for the foreign-born population - Saudi Arabia (%)
Place of birth for the foreign-born population - Syria (%)
Place of birth for the foreign-born population - Turkey (%)
Place of birth for the foreign-born population - Yemen (%)
Place of birth for the foreign-born population - Other Western Asia (%)
Place of birth for the foreign-born population - Eritrea (%)
Place of birth for the foreign-born population - Ethiopia (%)
Place of birth for the foreign-born population - Kenya (%)
Place of birth for the foreign-born population - Somalia (%)
Place of birth for the foreign-born population - Uganda (%)
Place of birth for the foreign-born population - Zimbabwe (%)
Place of birth for the foreign-born population - Other Eastern Africa (%)
Place of birth for the foreign-born population - Cameroon (%)
Place of birth for the foreign-born population - Congo (%)
Place of birth for the foreign-born population - Democratic Republic of Congo (Zaire) (%)
Place of birth for the foreign-born population - Other Middle Africa (%)
Place of birth for the foreign-born population - Egypt (%)
Place of birth for the foreign-born population - Morocco (%)
Place of birth for the foreign-born population - Sudan (%)
Place of birth for the foreign-born population - Other Northern Africa (%)
Place of birth for the foreign-born population - South Africa (%)
Place of birth for the foreign-born population - Other Southern Africa (%)
Place of birth for the foreign-born population - Cabo Verde (%)
Place of birth for the foreign-born population - Ghana (%)
Place of birth for the foreign-born population - Liberia (%)
Place of birth for the foreign-born population - Nigeria (%)
Place of birth for the foreign-born population - Senegal (%)
Place of birth for the foreign-born population - Sierra Leone (%)
Place of birth for the foreign-born population - Other Western Africa (%)
Place of birth for the foreign-born population - Australia (%)
Place of birth for the foreign-born population - New Zealand (%)
Place of birth for the foreign-born population - Fiji (%)
Place of birth for the foreign-born population - Micronesia (%)
Place of birth for the foreign-born population - Bahamas (%)
Place of birth for the foreign-born population - Barbados (%)
Place of birth for the foreign-born population - Cuba (%)
Place of birth for the foreign-born population - Dominica (%)
Place of birth for the foreign-born population - Dominican Republic (%)
Place of birth for the foreign-born population - Grenada (%)
Place of birth for the foreign-born population - Haiti (%)
Place of birth for the foreign-born population - Jamaica (%)
Place of birth for the foreign-born population - St. Vincent and the Grenadines (%)
Place of birth for the foreign-born population - Trinidad and Tobago (%)
Place of birth for the foreign-born population - West Indies (%)
Place of birth for the foreign-born population - Other Caribbean (%)
Place of birth for the foreign-born population - Belize (%)
Place of birth for the foreign-born population - Costa Rica (%)
Place of birth for the foreign-born population - El Salvador (%)
Place of birth for the foreign-born population - Guatemala (%)
Place of birth for the foreign-born population - Honduras (%)
Place of birth for the foreign-born population - Mexico (%)
Place of birth for the foreign-born population - Nicaragua (%)
Place of birth for the foreign-born population - Panama (%)
Place of birth for the foreign-born population - Other Central America (%)
Place of birth for the foreign-born population - Argentina (%)
Place of birth for the foreign-born population - Bolivia (%)
Place of birth for the foreign-born population - Brazil (%)
Place of birth for the foreign-born population - Chile (%)
Place of birth for the foreign-born population - Colombia (%)
Place of birth for the foreign-born population - Ecuador (%)
Place of birth for the foreign-born population - Guyana (%)
Place of birth for the foreign-born population - Peru (%)
Place of birth for the foreign-born population - Uruguay (%)
Place of birth for the foreign-born population - Venezuela (%)
Place of birth for the foreign-born population - Other South America (%)
Place of birth for the foreign-born population - Canada (%)
Place of birth for the foreign-born population - Other Northern America (%)
Place of birth for the foreign-born population - Other (%)
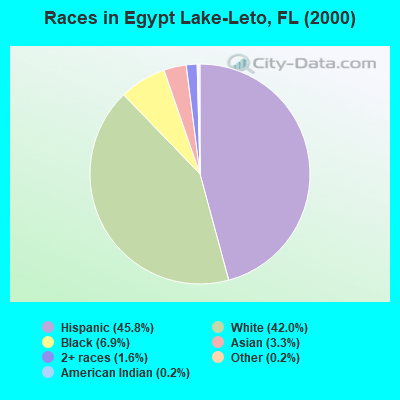
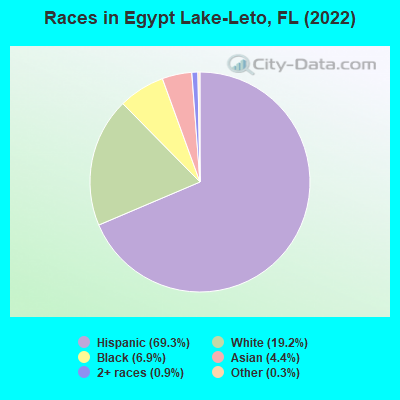
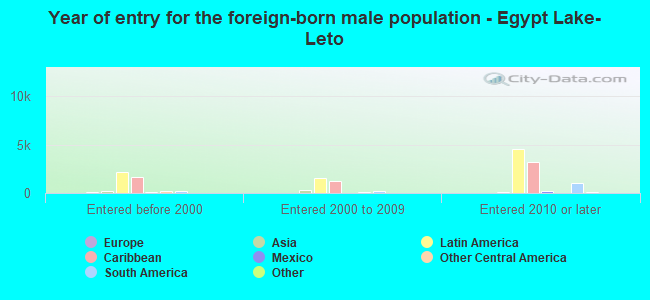
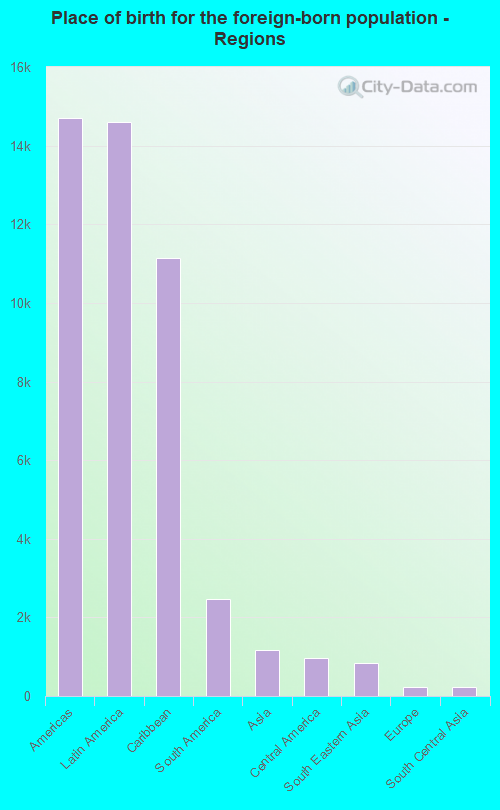
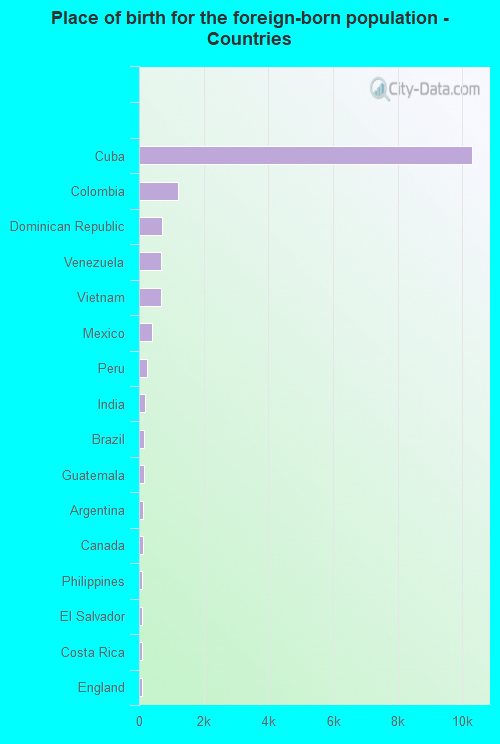
According to 2022 data, the most numerous races in Egypt Lake-Leto, FL are White alone (7,140 residents), Hispanic (25,710 residents), and Black alone (2,554 residents). 34.7% of Egypt Lake-Leto residents speak English at home. 43.7% of Egypt Lake-Leto, FL residents are foreign-born (38.5% born in Latin America), which is 51.9% greater than the foreign-born rate of 21.0% across the entire state of Florida.
Race distribution in Egypt Lake-Leto
2000 2022
10,458,509 65.4% White alone 2,682,715 16.8% Hispanic 2,264,268 14.2% Black alone 261,693 1.6% Asian alone 236,954 1.5% Two or more races 42,358 0.3% American Indian alone 28,994 0.2% Other race alone 6,887 0.04% Native Hawaiian and Other
11,309,403 50.8% White alone 6,025,039 27.1% Hispanic 3,241,015 14.6% Black alone 861,630 3.9% Two or more races 623,692 2.8% Asian alone 152,054 0.7% Other race alone 22,504 0.1% American Indian alone 9,486 0.04% Native Hawaiian and Other
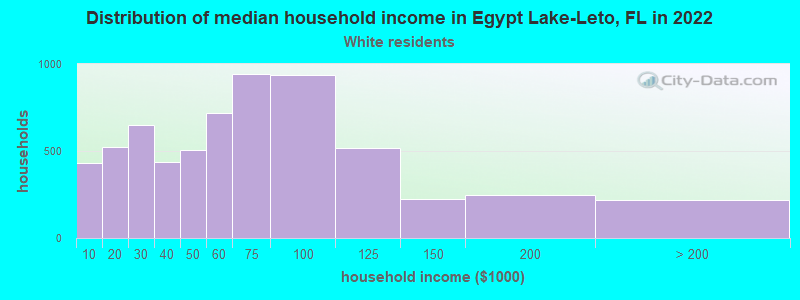
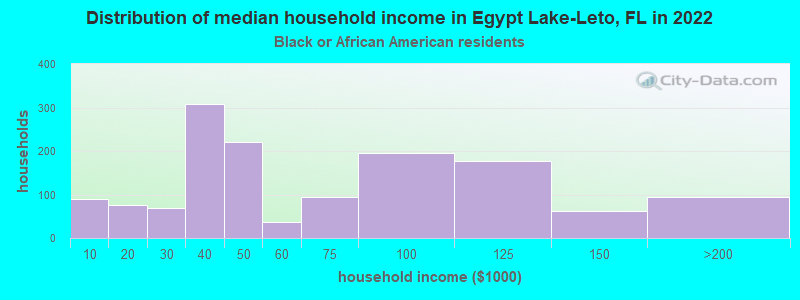
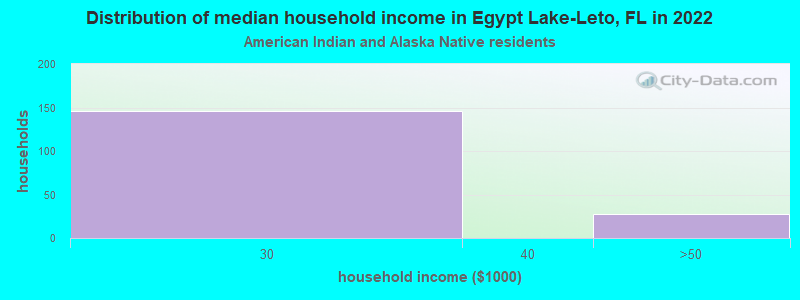
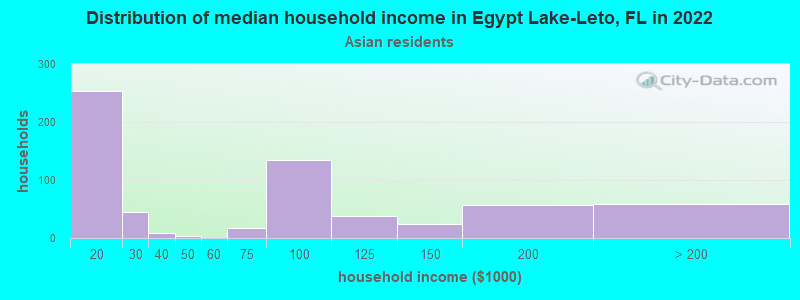
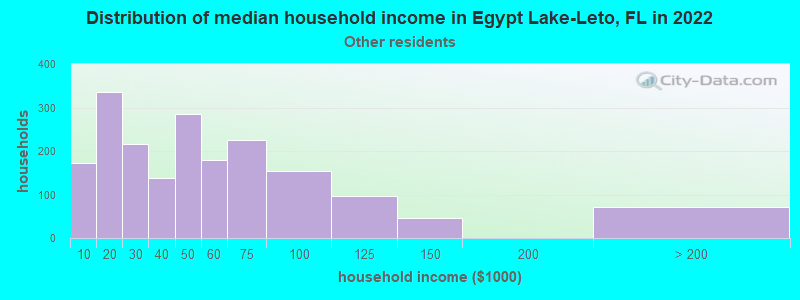
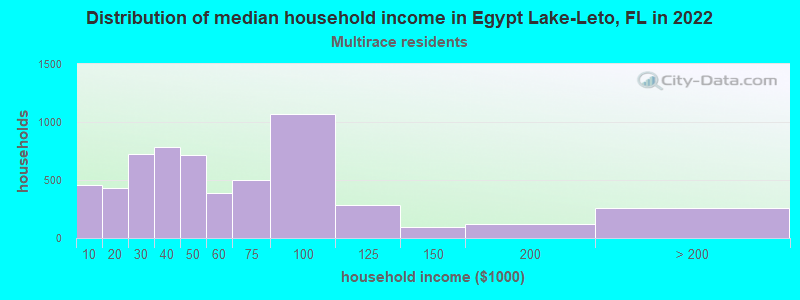
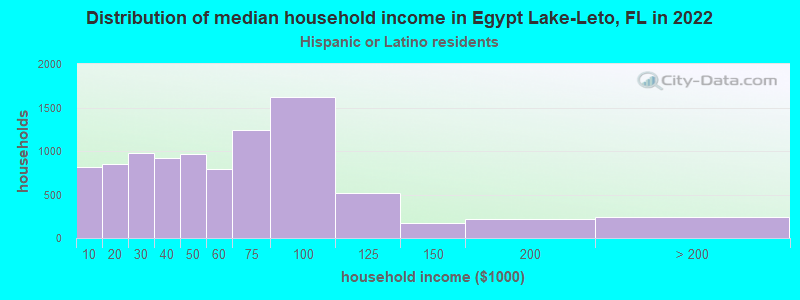
Income and house value in Egypt Lake-Leto Median household income in 2022 $56,202 White non-Hispanic householders$48,263 Black householders$42,947 American Indian and Alaska Native householders$77,163 Asian householders$43,714 Some other race householders$45,361 Two or more races householders$52,556 Hispanic or Latino race householdersMedian 2022 house value $329,920 White Non-Hispanic householders$374,504 Black or African American householders$235,889 American Indian or Alaska Native householders $326,272 Asian householders$314,113 Some other race householders$336,405 Two or more races householders$339,242 Hispanic or Latino householders
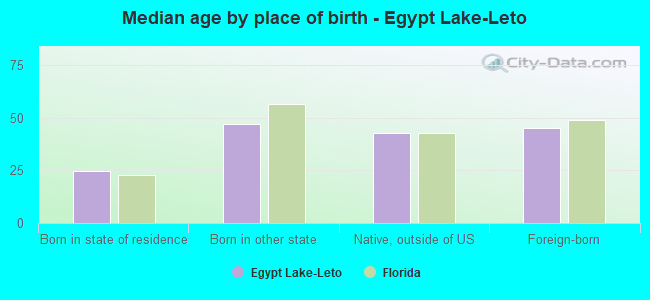
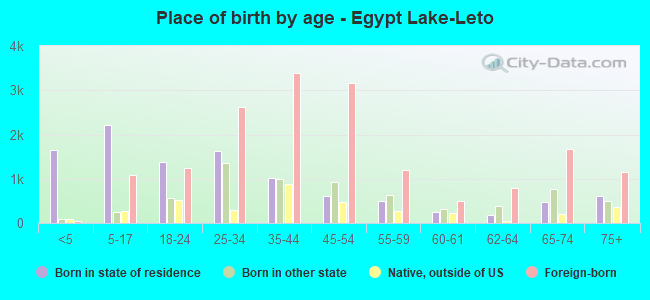
Median age by race in Egypt Lake-Leto
41.4 Median age for White residents40.5 42.7 34.0 Median age for Black or African American residents31.3 34.4 38.9 Median age for American Indian / Alaska Native residents-676,245,210.1 37.8 37.1 Median age for Asian residents36.6 37.4 -848,484,847.6 Median age for Native Hawaiian / Pacific Islander residents-776,729,559.0 -490,118,576.6 47.9 Median age for Other race residents47.1 47.3 44.2 Median age for Two or more races residents42.6 45.4 49.0 Median age for White alone residents46.7 52.0 40.3 Median age for Hispanic or Latino residents40.2 41.1
Owner/renter occupied households by race in Egypt Lake-Leto
House owners and renters - White residents 3,692 56.6% Owner occupied2,826 43.4% Renter occupiedHouse owners and renters - Black or African American residents 224 16.0% Owner occupied1,172 84.0% Renter occupiedHouse owners and renters - American Indian / Alaska Native residents 181 100.0% Renter occupiedHouse owners and renters - Asian residents 326 64.6% Owner occupied179 35.4% Renter occupiedHouse owners and renters - Other race residents 528 26.8% Owner occupied1,444 73.2% Renter occupiedHouse owners and renters - Two or more races residents 2,937 50.3% Owner occupied2,905 49.7% Renter occupiedHouse owners and renters - White alone residents 2,197 62.8% Owner occupied1,304 37.2% Renter occupiedHouse owners and renters - Hispanic or Latino residents 4,264 44.9% Owner occupied5,241 55.1% Renter occupied
Language usage in Egypt Lake-Leto
English speakers - Total 34.7% of residents of Egypt Lake-Leto speak English at home.
60.6% of residents speak Spanish at home 6,871 32.1% Speak English very well14,519 67.9% Speak English less than very well6.1% of residents speak other language at home 1,048 48.3% Speak English very well1,120 51.7% Speak English less than very well
English speakers - Born in the United States 73.1% of residents of Egypt Lake-Leto speak English at home.
24.1% of residents speak Spanish at home 1,238 76.9% Speak English very well371 23.1% Speak English less than very well2.3% of residents speak other language at home 119 77.8% Speak English very well34 22.2% Speak English less than very well
English speakers - Native, born elsewhere 10.6% of residents of Egypt Lake-Leto speak English at home.
82.1% of residents speak Spanish at home 975 34.5% Speak English very well1,854 65.5% Speak English less than very well9.4% of residents speak other language at home 279 86.1% Speak English very well45 13.9% Speak English less than very well
English speakers - Foreign-born 5.7% of residents of Egypt Lake-Leto speak English at home.
87.2% of residents speak Spanish at home 2,604 17.7% Speak English very well12,098 82.3% Speak English less than very well9.0% of residents speak other language at home 525 34.4% Speak English very well1,000 65.6% Speak English less than very well
White (Caucasian) - Speak only English Native:
76.0% (7,270)Foreign-born:
8.0% (228)
White (Caucasian) - Speak another language Native:
14.5% (1,382)Foreign-born:
81.1% (2,312)
Black or African American - Speak only English Native:
91.5% (2,147)Foreign-born:
29.3% (257)
Black or African American - Speak another language Native:
8.4% (197)Foreign-born:
71.0% (623)
American Indian / Alaska Native - Speak only English Native:
45.0% (49)Foreign-born:
25.6% (24)
American Indian / Alaska Native - Speak another language Native:
6.6% (7)Foreign-born:
48.8% (46)
Asian - Speak only English Native:
3.7% (14)Foreign-born:
5.2% (59)
Asian - Speak another language Native:
100.0% (376)Foreign-born:
94.5% (1,067)
Other race - Speak only English Native:
27.5% (495)Foreign-born:
4.4% (133)
Other race - Speak another language Native:
72.2% (1,300)Foreign-born:
96.0% (2,881)
Two or more races - Speak only English Native:
23.3% (1,455)Foreign-born:
2.9% (283)
Two or more races - Speak another language Native:
79.6% (4,981)Foreign-born:
98.7% (9,467)
White alone - Speak only English Native:
95.0% (6,192)Foreign-born:
35.6% (130)
White alone - Speak another language Native:
4.8% (316)Foreign-born:
64.1% (234)
Hispanic or Latino - Speak only English Native:
29.4% (2,872)Foreign-born:
3.3% (493)
Hispanic or Latino - Speak another language Native:
68.0% (6,648)Foreign-born:
96.8% (14,394)
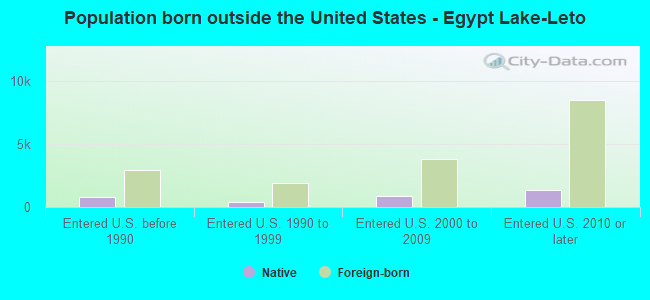
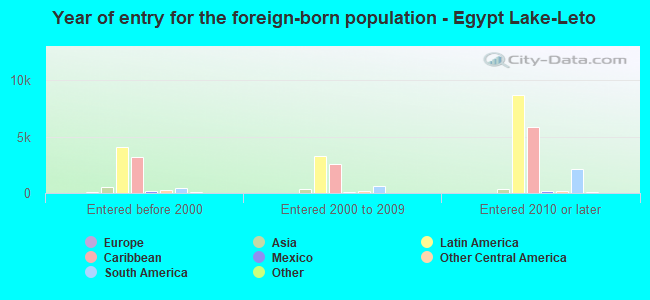
Foreign-born residents in Egypt Lake-Leto 16,200 residents are foreign born (38.5% Latin America ).
This city:
43.7%Florida:
21.1%
Marital status for residents in Egypt Lake-Leto Marital status - White (Caucasian) population 15 years and over
Males 43.7% Never married35.2% Now married5.1% Separated2.9% Widowed13.1% DivorcedFemales 31.4% Never married36.7% Now married4.9% Separated9.6% Widowed17.4% DivorcedWomen who gave birth in the past 12 months Now married:
58.7% (32)Unmarried:
41.3% (22)
Women who did not give birth in the past 12 months Now married:
40.2% (1,313)Unmarried:
59.8% (1,951)
Marital status - Black or African American population 15 years and over
Males 63.2% Never married26.3% Now married0.0% Separated4.9% Widowed5.5% DivorcedFemales 56.8% Never married19.4% Now married1.6% Separated3.8% Widowed18.4% DivorcedWomen who did not give birth in the past 12 months Now married:
11.4% (113)Unmarried:
88.6% (879)
Marital status - American Indian / Alaska Native population 15 years and over
Males 0.0% Never married100.0% Now married0.0% Separated0.0% Widowed0.0% DivorcedFemales 24.5% Never married22.6% Now married0.0% Separated0.0% Widowed52.8% DivorcedWomen who did not give birth in the past 12 months Now married:
0.0% (0)Unmarried:
100.0% (165)
Marital status - Asian population 15 years and over
Males 25.7% Never married74.3% Now married0.0% Separated0.0% Widowed0.0% DivorcedFemales 36.8% Never married48.0% Now married0.0% Separated10.3% Widowed4.9% DivorcedWomen who gave birth in the past 12 months Now married:
100.0% (33)Unmarried:
0.0% (0)
Women who did not give birth in the past 12 months Now married:
44.6% (224)Unmarried:
55.4% (279)
Marital status - Other race population 15 years and over
Males 41.6% Never married40.2% Now married6.1% Separated0.0% Widowed12.1% DivorcedFemales 28.0% Never married35.4% Now married7.1% Separated5.3% Widowed24.3% DivorcedWomen who gave birth in the past 12 months Now married:
0.0% (0)Unmarried:
100.0% (29)
Women who did not give birth in the past 12 months Now married:
46.9% (500)Unmarried:
53.1% (566)
Marital status - Two or more races population 15 years and over
Males 48.9% Never married40.8% Now married0.9% Separated1.3% Widowed8.1% DivorcedFemales 43.3% Never married24.3% Now married4.4% Separated8.4% Widowed19.6% DivorcedWomen who gave birth in the past 12 months Now married:
0.0% (0)Unmarried:
100.0% (141)
Women who did not give birth in the past 12 months Now married:
23.9% (1,016)Unmarried:
76.1% (3,241)
Marital status - White alone, not Hispanic / Latino population 15 years and over
Males 42.3% Never married34.9% Now married2.7% Separated5.2% Widowed14.9% DivorcedFemales 37.0% Never married36.6% Now married0.8% Separated10.7% Widowed14.9% DivorcedWomen who gave birth in the past 12 months Now married:
0.0% (0)Unmarried:
100.0% (15)
Women who did not give birth in the past 12 months Now married:
27.9% (364)Unmarried:
72.1% (941)
Marital status - Hispanic or Latino population 15 years and over
Males 45.1% Never married38.9% Now married4.4% Separated1.5% Widowed10.1% DivorcedFemales 35.9% Never married30.9% Now married6.0% Separated7.9% Widowed19.3% DivorcedWomen who gave birth in the past 12 months Now married:
23.0% (39)Unmarried:
77.0% (129)
Women who did not give birth in the past 12 months Now married:
35.3% (2,295)Unmarried:
64.7% (4,214)
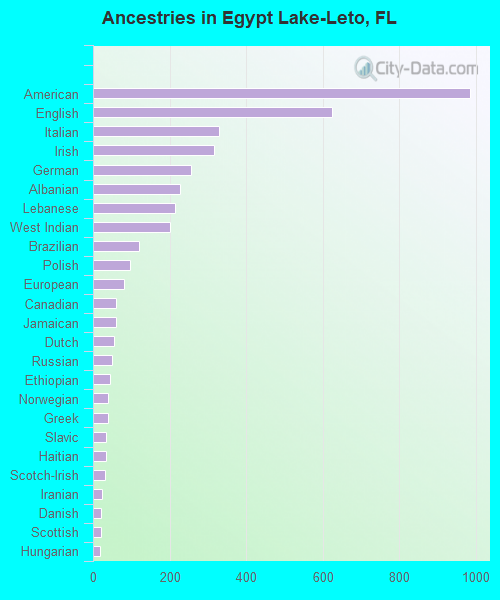
Ancestries in Egypt Lake-Leto
985 4.2% American624 2.6% English329 1.4% Italian316 1.3% Irish256 1.1% German227 1.0% Albanian213 0.9% Lebanese201 0.9% West Indian121 0.5% Brazilian96 0.4% Polish82 0.3% European60 0.3% Canadian60 0.3% Jamaican54 0.2% Dutch50 0.2% Russian45 0.2% Ethiopian39 0.2% Norwegian38 0.2% Greek34 0.1% Slavic33 0.1% Haitian31 0.1% Scotch-Irish24 0.1% Iranian20 0.08% Danish20 0.08% Scottish17 0.07% Hungarian12 0.05% Welsh10 0.04% Armenian
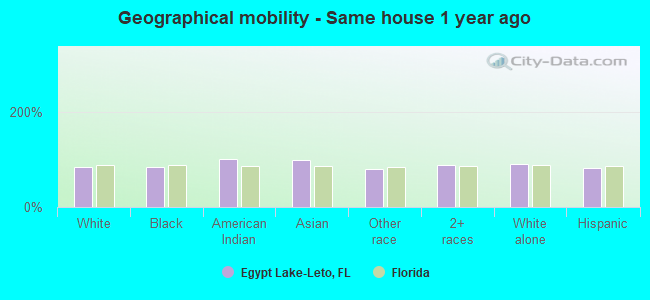
Geographical mobility in Egypt Lake-Leto Same house 1 year ago 12,528 84.1% White (Caucasian)2,741 82.8% Black or African American201 100.0% American Indian / Alaska Native1,599 98.8% Asian3,947 78.7% Other race13,652 87.6% Two or more races6,431 90.3% White alone, not Hispanic / Latino21,081 82.5% Hispanic or LatinoMoved within same county 1,234 8.3% White / Caucasian241 7.3% Black or African American4 1.8% American Indian / Alaska Native43 2.7% Asian724 14.4% Other race842 5.4% Two or more races280 3.9% White alone, not Hispanic / Latino2,498 9.8% Hispanic or LatinoMoved within same state 257 1.7% White / Caucasian177 5.3% Black or African American15 0.9% Asian241 4.8% Other race639 4.1% Two or more races222 3.1% White alone, not Hispanic / Latino633 2.5% Hispanic or LatinoMoved from different state 317 2.1% White / Caucasian82 2.5% Black or African American14 0.9% Asian268 1.7% Two or more races224 3.2% White alone, not Hispanic / Latino344 1.3% Hispanic or LatinoMoved from abroad 235 1.6% White70 2.1% Black or African American6 0.1% Other race226 1.5% Two or more races14 0.2% White alone, not Hispanic / Latino944 3.7% Hispanic or Latino
Children Nativity (place of birth) in Egypt Lake-Leto
Children under 6 years - Living with two parents Both parents native 136 100.0% NativeBoth parents foreign-born 589 100.0% NativeOne native, one foreign-born parent 60 100.0% NativeChildren under 6 years - Living with one parent Native parent 631 100.0% NativeForeign-born parent 333 96.7% Native11 3.3% Foreign-bornChildren 6 to 17 years - Living with two parents Both parents native 484 100.0% NativeBoth parents foreign-born 364 36.6% Native632 63.4% Foreign-bornOne native, one foreign-born parent 226 94.5% Native13 5.5% Foreign-bornChildren 6 to 17 years - Living with one parent Native parent 450 100.0% NativeForeign-born parent 896 62.8% Native531 37.2% Foreign-born
Grandparents responsible for own grandchildren in Egypt Lake-Leto
Grandparents (30 to 59 years) White / Caucasian 58 100.0% Not responsible for grandchildrenBlack or African American 45 100.0% Not responsible for grandchildrenOther race 6 54.6% Responsible for grandchildren5 45.4% Not responsible for grandchildrenTwo or more races 135 79.0% Responsible for grandchildren36 21.0% Not responsible for grandchildrenWhite alone, not Hispanic / Latino 19 100.0% Not responsible for grandchildrenHispanic or Latino 89 60.7% Responsible for grandchildren58 39.3% Not responsible for grandchildrenGrandparents (60 years and over) White / Caucasian 22 13.6% Responsible for grandchildren137 86.4% Not responsible for grandchildrenBlack or African American 19 100.0% Not responsible for grandchildrenOther race 69 100.0% Not responsible for grandchildrenTwo or more races 57 31.5% Responsible for grandchildren123 68.5% Not responsible for grandchildrenWhite alone, not Hispanic / Latino 18 18.1% Responsible for grandchildren80 81.9% Not responsible for grandchildrenHispanic or Latino 42 14.4% Responsible for grandchildren247 85.6% Not responsible for grandchildren