Races in El Campo, Texas (TX) Detailed Stats
Data:
Races - White alone (%)
Races - White alone (% change since 2000)
Races - Black alone (%)
Races - Black alone (% change since 2000)
Races - American Indian alone (%)
Races - American Indian alone (% change since 2000)
Races - Asian alone (%)
Races - Asian alone (% change since 2000)
Races - Hispanic (%)
Races - Hispanic (% change since 2000)
Races - Native Hawaiian and Other Pacific Islander alone (%)
Races - Native Hawaiian and Other Pacific Islander alone (% change since 2000)
Races - Two or more races(%)
Races - Two or more races(% change since 2000)
Races - Other race alone (%)
Races - Other race alone (% change since 2000)
Racial diversity
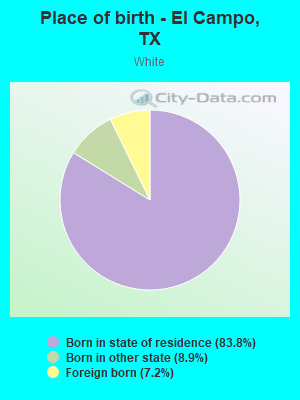
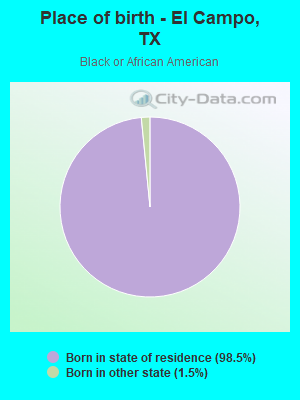
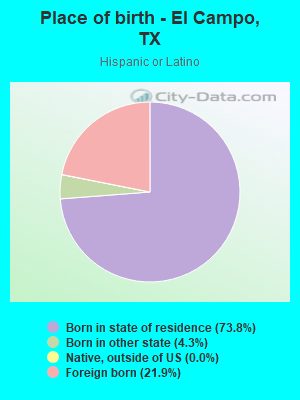
Place of birth - Born in state of residence (%)
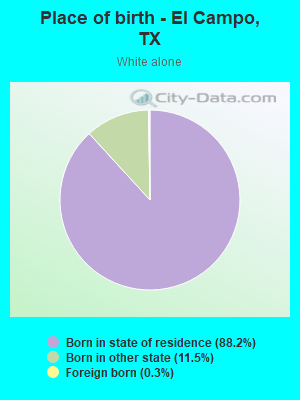
Place of birth - Born in state of residence (%) - White
Place of birth - Born in state of residence (%) - Black or African American
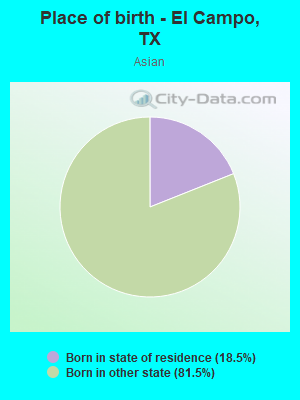
Place of birth - Born in state of residence (%) - Asian
Place of birth - Born in state of residence (%) - Hispanic or Latino
Place of birth - Born in state of residence (%) - American Indian and Alaska Native
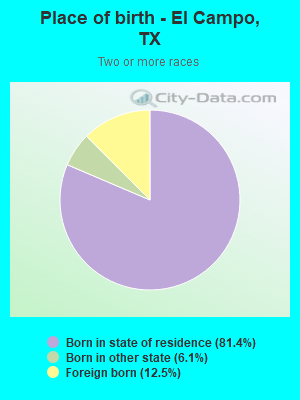
Place of birth - Born in state of residence (%) - Multirace
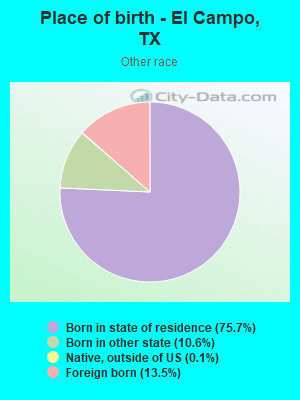
Place of birth - Born in state of residence (%) - Other Race
Place of birth - Born in other state (%)
Place of birth - Born in other state (%) - White
Place of birth - Born in other state (%) - Black or African American
Place of birth - Born in other state (%) - Asian
Place of birth - Born in other state (%) - Hispanic or Latino
Place of birth - Born in other state (%) - American Indian and Alaska Native
Place of birth - Born in other state (%) - Multirace
Place of birth - Born in other state (%) - Other Race
Place of birth - Native, outside of US (%)
Place of birth - Native, outside of US (%) - White
Place of birth - Native, outside of US (%) - Black or African American
Place of birth - Native, outside of US (%) - Asian
Place of birth - Native, outside of US (%) - Hispanic or Latino
Place of birth - Native, outside of US (%) - American Indian and Alaska Native
Place of birth - Native, outside of US (%) - Multirace
Place of birth - Native, outside of US (%) - Other Race
Place of birth - Foreign born (%)
Place of birth - Foreign born (%) - White
Place of birth - Foreign born (%) - Black or African American
Place of birth - Foreign born (%) - Asian
Place of birth - Foreign born (%) - Hispanic or Latino
Place of birth - Foreign born (%) - American Indian and Alaska Native
Place of birth - Foreign born (%) - Multirace
Place of birth - Foreign born (%) - Other Race
Residents speaking English at home (%)
Residents speaking English at home - Born in the United States (%)
Residents speaking English at home - Native, born elsewhere (%)
Residents speaking English at home - Foreign born (%)
Residents speaking Spanish at home (%)
Residents speaking Spanish at home - Born in the United States (%)
Residents speaking Spanish at home - Native, born elsewhere (%)
Residents speaking Spanish at home - Foreign born (%)
Residents speaking other language at home (%)
Residents speaking other language at home - Born in the United States (%)
Residents speaking other language at home - Native, born elsewhere (%)
Residents speaking other language at home - Foreign born (%)
Marital status - Never married (%)
Marital status - Now married (%)
Marital status - Separated (%)
Marital status - Widowed (%)
Marital status - Divorced (%)
Ancestries Reported - Arab (%)
Ancestries Reported - Czech (%)
Ancestries Reported - Danish (%)
Ancestries Reported - Dutch (%)
Ancestries Reported - English (%)
Ancestries Reported - French (%)
Ancestries Reported - French Canadian (%)
Ancestries Reported - German (%)
Ancestries Reported - Greek (%)
Ancestries Reported - Hungarian (%)
Ancestries Reported - Irish (%)
Ancestries Reported - Italian (%)
Ancestries Reported - Lithuanian (%)
Ancestries Reported - Norwegian (%)
Ancestries Reported - Polish (%)
Ancestries Reported - Portuguese (%)
Ancestries Reported - Russian (%)
Ancestries Reported - Scotch-Irish (%)
Ancestries Reported - Scottish (%)
Ancestries Reported - Slovak (%)
Ancestries Reported - Subsaharan African (%)
Ancestries Reported - Swedish (%)
Ancestries Reported - Swiss (%)
Ancestries Reported - Ukrainian (%)
Ancestries Reported - United States (%)
Ancestries Reported - Welsh (%)
Ancestries Reported - West Indian (%)
Ancestries Reported - Other (%)
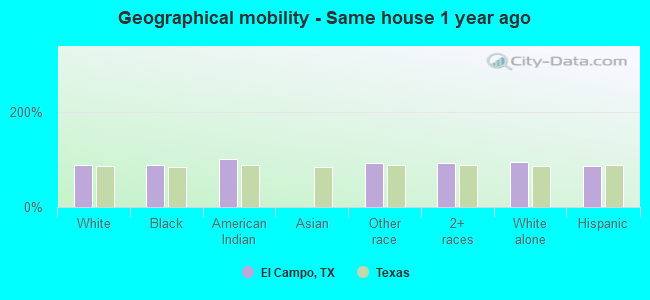
Geographical mobility - Same house 1 year ago (%)
Geographical mobility - Same house 1 year ago (%) - White
Geographical mobility - Same house 1 year ago (%) - Black or African American
Geographical mobility - Same house 1 year ago (%) - Asian
Geographical mobility - Same house 1 year ago (%) - Hispanic or Latino
Geographical mobility - Same house 1 year ago (%) - American Indian and Alaska Native
Geographical mobility - Same house 1 year ago (%) - Multirace
Geographical mobility - Same house 1 year ago (%) - Other Race
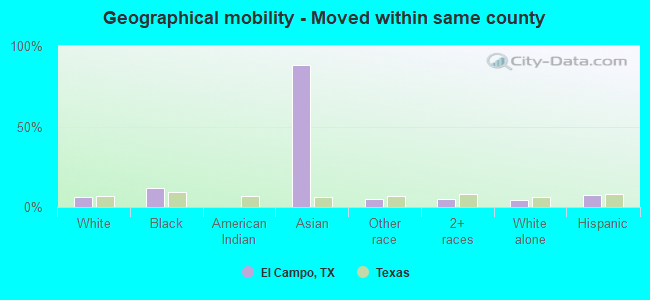
Geographical mobility - Moved within same county (%)
Geographical mobility - Moved within same county (%) - White
Geographical mobility - Moved within same county (%) - Black or African American
Geographical mobility - Moved within same county (%) - Asian
Geographical mobility - Moved within same county (%) - Hispanic or Latino
Geographical mobility - Moved within same county (%) - American Indian and Alaska Native
Geographical mobility - Moved within same county (%) - Multirace
Geographical mobility - Moved within same county (%) - Other Race
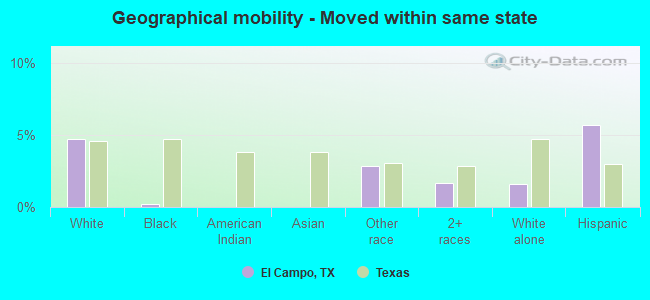
Geographical mobility - Moved from different county within same state (%)
Geographical mobility - Moved from different county within same state (%) - White
Geographical mobility - Moved from different county within same state (%) - Black or African American
Geographical mobility - Moved from different county within same state (%) - Asian
Geographical mobility - Moved from different county within same state (%) - Hispanic or Latino
Geographical mobility - Moved from different county within same state (%) - American Indian and Alaska Native
Geographical mobility - Moved from different county within same state (%) - Multirace
Geographical mobility - Moved from different county within same state (%) - Other Race
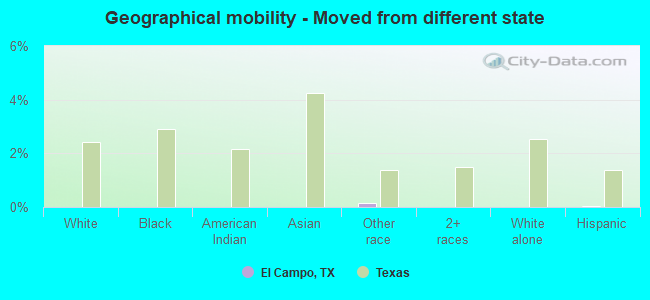
Geographical mobility - Moved from different state (%)
Geographical mobility - Moved from different state (%) - White
Geographical mobility - Moved from different state (%) - Black or African American
Geographical mobility - Moved from different state (%) - Asian
Geographical mobility - Moved from different state (%) - Hispanic or Latino
Geographical mobility - Moved from different state (%) - American Indian and Alaska Native
Geographical mobility - Moved from different state (%) - Multirace
Geographical mobility - Moved from different state (%) - Other Race
Geographical mobility - Moved from abroad (%)
Geographical mobility - Moved from abroad (%) - White
Geographical mobility - Moved from abroad (%) - Black or African American
Geographical mobility - Moved from abroad (%) - Asian
Geographical mobility - Moved from abroad (%) - Hispanic or Latino
Geographical mobility - Moved from abroad (%) - American Indian and Alaska Native
Geographical mobility - Moved from abroad (%) - Multirace
Geographical mobility - Moved from abroad (%) - Other Race
Place of birth for the foreign-born population - Ireland (%)
Place of birth for the foreign-born population - Denmark (%)
Place of birth for the foreign-born population - Norway (%)
Place of birth for the foreign-born population - Sweden (%)
Place of birth for the foreign-born population - United Kingdom (%)
Place of birth for the foreign-born population - England (%)
Place of birth for the foreign-born population - Scotland (%)
Place of birth for the foreign-born population - Other Northern Europe (%)
Place of birth for the foreign-born population - Austria (%)
Place of birth for the foreign-born population - Belgium (%)
Place of birth for the foreign-born population - France (%)
Place of birth for the foreign-born population - Germany (%)
Place of birth for the foreign-born population - Netherlands (%)
Place of birth for the foreign-born population - Switzerland (%)
Place of birth for the foreign-born population - Other Western Europe (%)
Place of birth for the foreign-born population - Greece (%)
Place of birth for the foreign-born population - Italy (%)
Place of birth for the foreign-born population - Portugal (%)
Place of birth for the foreign-born population - Spain (%)
Place of birth for the foreign-born population - Other Southern Europe (%)
Place of birth for the foreign-born population - Albania (%)
Place of birth for the foreign-born population - Belarus (%)
Place of birth for the foreign-born population - Bosnia and Herzegovina (%)
Place of birth for the foreign-born population - Bulgaria (%)
Place of birth for the foreign-born population - Croatia (%)
Place of birth for the foreign-born population - Czechoslovakia (%)
Place of birth for the foreign-born population - Hungary (%)
Place of birth for the foreign-born population - Latvia (%)
Place of birth for the foreign-born population - Lithuania (%)
Place of birth for the foreign-born population - North Macedonia (Macedonia) (%)
Place of birth for the foreign-born population - Moldova (%)
Place of birth for the foreign-born population - Poland (%)
Place of birth for the foreign-born population - Romania (%)
Place of birth for the foreign-born population - Russia (%)
Place of birth for the foreign-born population - Serbia (%)
Place of birth for the foreign-born population - Ukraine (%)
Place of birth for the foreign-born population - Other Eastern Europe (%)
Place of birth for the foreign-born population - China (%)
Place of birth for the foreign-born population - Hong Kong (%)
Place of birth for the foreign-born population - Taiwan (%)
Place of birth for the foreign-born population - Japan (%)
Place of birth for the foreign-born population - Korea (%)
Place of birth for the foreign-born population - Other Eastern Asia (%)
Place of birth for the foreign-born population - Afghanistan (%)
Place of birth for the foreign-born population - Bangladesh (%)
Place of birth for the foreign-born population - India (%)
Place of birth for the foreign-born population - Iran (%)
Place of birth for the foreign-born population - Kazakhstan (%)
Place of birth for the foreign-born population - Nepal (%)
Place of birth for the foreign-born population - Pakistan (%)
Place of birth for the foreign-born population - Sri Lanka (%)
Place of birth for the foreign-born population - Uzbekistan (%)
Place of birth for the foreign-born population - Other South Central Asia (%)
Place of birth for the foreign-born population - Burma (%)
Place of birth for the foreign-born population - Cambodia (%)
Place of birth for the foreign-born population - Indonesia (%)
Place of birth for the foreign-born population - Laos (%)
Place of birth for the foreign-born population - Malaysia (%)
Place of birth for the foreign-born population - Philippines (%)
Place of birth for the foreign-born population - Singapore (%)
Place of birth for the foreign-born population - Thailand (%)
Place of birth for the foreign-born population - Vietnam (%)
Place of birth for the foreign-born population - Other South Eastern Asia (%)
Place of birth for the foreign-born population - Armenia (%)
Place of birth for the foreign-born population - Iraq (%)
Place of birth for the foreign-born population - Israel (%)
Place of birth for the foreign-born population - Jordan (%)
Place of birth for the foreign-born population - Kuwait (%)
Place of birth for the foreign-born population - Lebanon (%)
Place of birth for the foreign-born population - Saudi Arabia (%)
Place of birth for the foreign-born population - Syria (%)
Place of birth for the foreign-born population - Turkey (%)
Place of birth for the foreign-born population - Yemen (%)
Place of birth for the foreign-born population - Other Western Asia (%)
Place of birth for the foreign-born population - Eritrea (%)
Place of birth for the foreign-born population - Ethiopia (%)
Place of birth for the foreign-born population - Kenya (%)
Place of birth for the foreign-born population - Somalia (%)
Place of birth for the foreign-born population - Uganda (%)
Place of birth for the foreign-born population - Zimbabwe (%)
Place of birth for the foreign-born population - Other Eastern Africa (%)
Place of birth for the foreign-born population - Cameroon (%)
Place of birth for the foreign-born population - Congo (%)
Place of birth for the foreign-born population - Democratic Republic of Congo (Zaire) (%)
Place of birth for the foreign-born population - Other Middle Africa (%)
Place of birth for the foreign-born population - Egypt (%)
Place of birth for the foreign-born population - Morocco (%)
Place of birth for the foreign-born population - Sudan (%)
Place of birth for the foreign-born population - Other Northern Africa (%)
Place of birth for the foreign-born population - South Africa (%)
Place of birth for the foreign-born population - Other Southern Africa (%)
Place of birth for the foreign-born population - Cabo Verde (%)
Place of birth for the foreign-born population - Ghana (%)
Place of birth for the foreign-born population - Liberia (%)
Place of birth for the foreign-born population - Nigeria (%)
Place of birth for the foreign-born population - Senegal (%)
Place of birth for the foreign-born population - Sierra Leone (%)
Place of birth for the foreign-born population - Other Western Africa (%)
Place of birth for the foreign-born population - Australia (%)
Place of birth for the foreign-born population - New Zealand (%)
Place of birth for the foreign-born population - Fiji (%)
Place of birth for the foreign-born population - Micronesia (%)
Place of birth for the foreign-born population - Bahamas (%)
Place of birth for the foreign-born population - Barbados (%)
Place of birth for the foreign-born population - Cuba (%)
Place of birth for the foreign-born population - Dominica (%)
Place of birth for the foreign-born population - Dominican Republic (%)
Place of birth for the foreign-born population - Grenada (%)
Place of birth for the foreign-born population - Haiti (%)
Place of birth for the foreign-born population - Jamaica (%)
Place of birth for the foreign-born population - St. Vincent and the Grenadines (%)
Place of birth for the foreign-born population - Trinidad and Tobago (%)
Place of birth for the foreign-born population - West Indies (%)
Place of birth for the foreign-born population - Other Caribbean (%)
Place of birth for the foreign-born population - Belize (%)
Place of birth for the foreign-born population - Costa Rica (%)
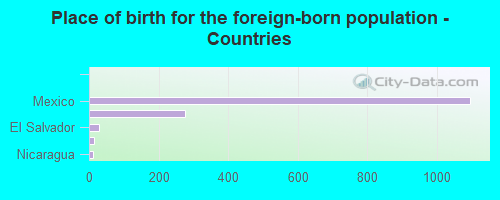
Place of birth for the foreign-born population - El Salvador (%)
Place of birth for the foreign-born population - Guatemala (%)
Place of birth for the foreign-born population - Honduras (%)
Place of birth for the foreign-born population - Mexico (%)
Place of birth for the foreign-born population - Nicaragua (%)
Place of birth for the foreign-born population - Panama (%)
Place of birth for the foreign-born population - Other Central America (%)
Place of birth for the foreign-born population - Argentina (%)
Place of birth for the foreign-born population - Bolivia (%)
Place of birth for the foreign-born population - Brazil (%)
Place of birth for the foreign-born population - Chile (%)
Place of birth for the foreign-born population - Colombia (%)
Place of birth for the foreign-born population - Ecuador (%)
Place of birth for the foreign-born population - Guyana (%)
Place of birth for the foreign-born population - Peru (%)
Place of birth for the foreign-born population - Uruguay (%)
Place of birth for the foreign-born population - Venezuela (%)
Place of birth for the foreign-born population - Other South America (%)
Place of birth for the foreign-born population - Canada (%)
Place of birth for the foreign-born population - Other Northern America (%)
Place of birth for the foreign-born population - Other (%)
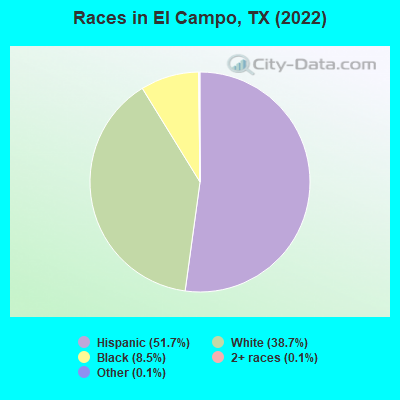
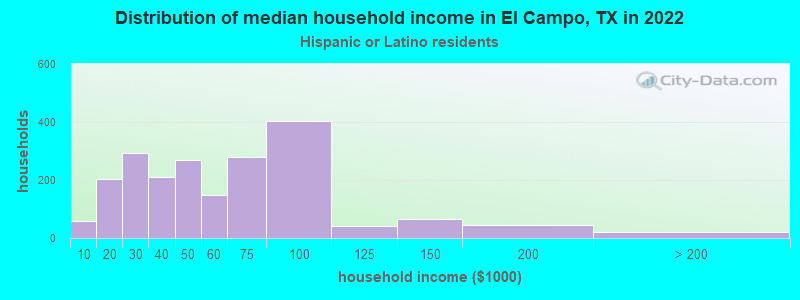
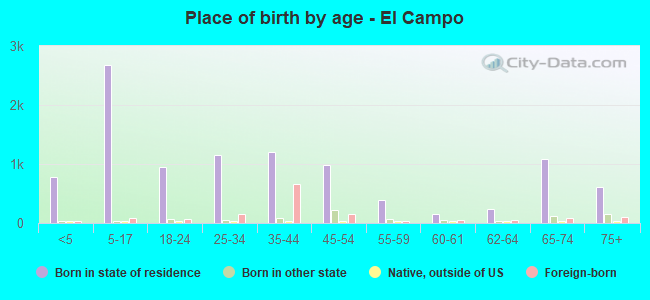
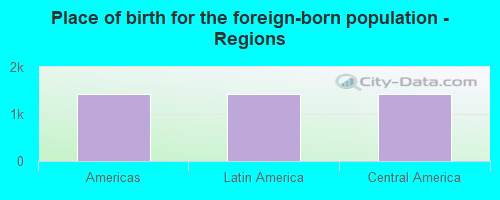
According to 2022 data, the most numerous races in El Campo, TX are Hispanic (6,494 residents), White alone (4,863 residents), and Black alone (1,073 residents). 68.5% of El Campo residents speak English at home. 11.4% of El Campo, TX residents are foreign-born (11.2% born in Latin America), which is 49.1% less than the foreign-born rate of 17.0% across the entire state of Texas.
Race distribution in El Campo
2000 2022
10,933,313 52.4% White alone 6,669,666 32.0% Hispanic 2,364,255 11.3% Black alone 554,445 2.7% Asian alone 230,567 1.1% Two or more races 68,859 0.3% American Indian alone 19,958 0.10% Other race alone 10,757 0.05% Native Hawaiian and Other
12,070,642 40.2% Hispanic 11,683,430 38.9% White alone 3,508,706 11.7% Black alone 1,608,173 5.4% Asian alone 956,560 3.2% Two or more races 125,763 0.4% Other race alone 47,023 0.2% American Indian alone 29,275 0.10% Native Hawaiian and Other
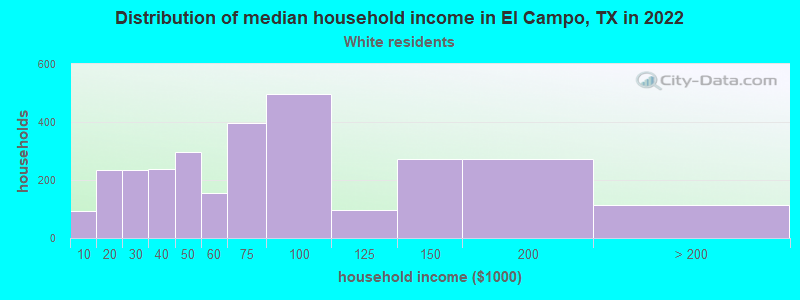
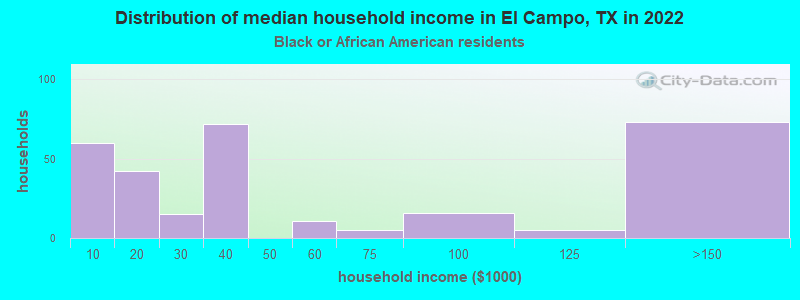
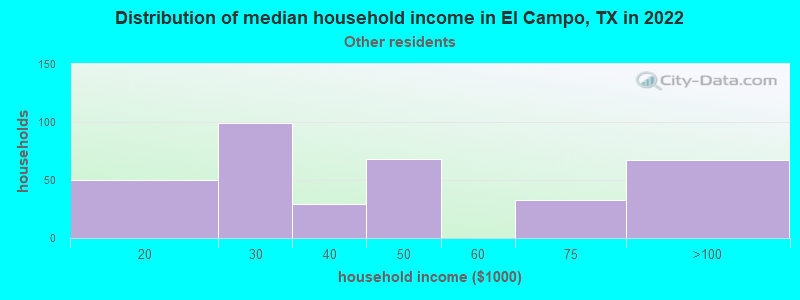
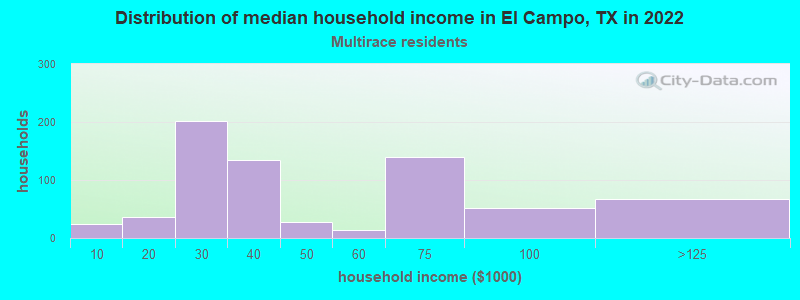
Income and house value in El Campo Median household income in 2022 $68,019 White non-Hispanic householders$38,593 Black householders$39,380 Some other race householders$33,188 Two or more races householders$49,373 Hispanic or Latino race householdersMedian 2022 house value $233,054 White Non-Hispanic householders$103,779 Black or African American householders$132,148 Some other race householders$284,406 Two or more races householders$137,175 Hispanic or Latino householders
Median age by race in El Campo
39.5 Median age for White residents42.0 36.7 39.1 Median age for Black or African American residents37.5 40.6 -684,418,145.3 Median age for American Indian / Alaska Native residents-682,445,758.7 -684,418,145.3 10.5 Median age for Asian residents-683,426,442.5 10.7 -581,560,283.1 Median age for Native Hawaiian / Pacific Islander residents-612,729,233.5 -577,777,777.2 27.0 Median age for Other race residents26.2 28.4 22.4 Median age for Two or more races residents21.0 25.3 43.9 Median age for White alone residents41.9 47.0 28.4 Median age for Hispanic or Latino residents29.9 27.8
Owner/renter occupied households by race in El Campo
House owners and renters - White residents 1,738 59.3% Owner occupied1,191 40.7% Renter occupiedHouse owners and renters - Black or African American residents 107 34.6% Owner occupied202 65.4% Renter occupiedHouse owners and renters - American Indian / Alaska Native residents 10 100.0% Owner occupiedHouse owners and renters - Asian residents 1 100.0% Renter occupiedHouse owners and renters - Other race residents 136 38.4% Owner occupied217 61.6% Renter occupiedHouse owners and renters - Two or more races residents 524 75.2% Owner occupied173 24.8% Renter occupiedHouse owners and renters - White alone residents 1,454 68.7% Owner occupied663 31.3% Renter occupiedHouse owners and renters - Hispanic or Latino residents 972 47.8% Owner occupied1,062 52.2% Renter occupied
Language usage in El Campo
English speakers - Total 68.5% of residents of El Campo speak English at home.
31.0% of residents speak Spanish at home 2,030 55.9% Speak English very well1,602 44.1% Speak English less than very well0.3% of residents speak other language at home 28 93.3% Speak English very well2 6.7% Speak English less than very well
English speakers - Born in the United States 75.5% of residents of El Campo speak English at home.
22.3% of residents speak Spanish at home 156 83.4% Speak English very well31 16.6% Speak English less than very well2.3% of residents speak other language at home 19 100.0% Speak English very well
English speakers - Native, born elsewhere 0.0% of residents of El Campo speak English at home.
100.0% of residents speak Spanish at home 1 100.0% Speak English very well
English speakers - Foreign-born 5.4% of residents of El Campo speak English at home.
93.2% of residents speak Spanish at home 171 13.1% Speak English very well1,139 86.9% Speak English less than very well0.1% of residents speak other language at home 2 100.0% Speak English less than very well
White (Caucasian) - Speak only English Native:
90.9% (5,941)Foreign-born:
9.7% (50)
White (Caucasian) - Speak another language Native:
9.6% (628)Foreign-born:
83.5% (430)
Other race - Speak another language Native:
73.5% (552)Foreign-born:
99.5% (147)
Two or more races - Speak only English Native:
43.6% (669)Foreign-born:
9.4% (20)
Two or more races - Speak another language Native:
57.0% (874)Foreign-born:
90.4% (187)
White alone - Speak only English Native:
98.9% (4,666)Foreign-born:
100.0% (13)
Hispanic or Latino - Speak only English Native:
52.3% (2,336)Foreign-born:
4.8% (67)
Hispanic or Latino - Speak another language Native:
48.1% (2,149)Foreign-born:
95.1% (1,320)
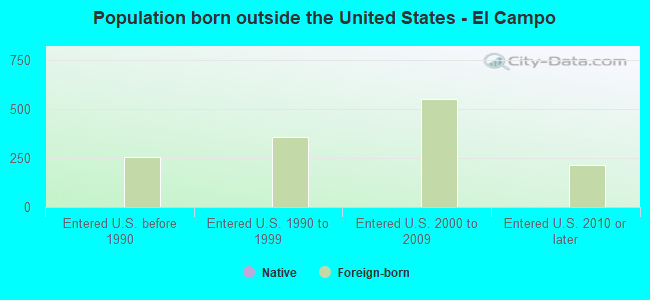
Foreign-born residents in El Campo 1,433 residents are foreign born (11.2% Latin America ).
This city:
11.4%Texas:
17.1%
Marital status for residents in El Campo Marital status - White (Caucasian) population 15 years and over
Males 20.8% Never married60.1% Now married1.5% Separated5.0% Widowed12.6% DivorcedFemales 29.8% Never married49.9% Now married0.8% Separated10.9% Widowed8.7% DivorcedWomen who gave birth in the past 12 months Now married:
72.0% (54)Unmarried:
28.0% (21)
Women who did not give birth in the past 12 months Now married:
50.1% (974)Unmarried:
49.9% (969)
Marital status - Black or African American population 15 years and over
Males 59.1% Never married30.1% Now married6.0% Separated0.0% Widowed4.7% DivorcedFemales 37.6% Never married34.4% Now married10.8% Separated15.7% Widowed1.5% DivorcedWomen who gave birth in the past 12 months Now married:
100.0% (40)Unmarried:
0.0% (0)
Women who did not give birth in the past 12 months Now married:
29.3% (54)Unmarried:
70.7% (129)
Marital status - Other race population 15 years and over
Males 39.6% Never married36.9% Now married0.0% Separated0.0% Widowed23.5% DivorcedFemales 43.0% Never married41.2% Now married0.0% Separated8.5% Widowed7.4% DivorcedWomen who gave birth in the past 12 months Now married:
6.8% (4)Unmarried:
93.2% (56)
Women who did not give birth in the past 12 months Now married:
50.0% (111)Unmarried:
50.0% (111)
Marital status - Two or more races population 15 years and over
Males 25.5% Never married65.2% Now married4.6% Separated0.0% Widowed4.6% DivorcedFemales 34.5% Never married43.0% Now married0.0% Separated6.0% Widowed16.5% DivorcedWomen who gave birth in the past 12 months Now married:
0.0% (0)Unmarried:
100.0% (93)
Women who did not give birth in the past 12 months Now married:
35.8% (142)Unmarried:
64.2% (254)
Marital status - White alone, not Hispanic / Latino population 15 years and over
Males 20.6% Never married59.3% Now married2.5% Separated2.1% Widowed15.5% DivorcedFemales 21.2% Never married54.5% Now married0.0% Separated13.7% Widowed10.6% DivorcedWomen who gave birth in the past 12 months Now married:
100.0% (22)Unmarried:
0.0% (0)
Women who did not give birth in the past 12 months Now married:
56.4% (563)Unmarried:
43.6% (435)
Marital status - Hispanic or Latino population 15 years and over
Males 24.6% Never married58.9% Now married0.8% Separated6.3% Widowed9.4% DivorcedFemales 40.2% Never married43.2% Now married1.2% Separated7.2% Widowed8.3% DivorcedWomen who gave birth in the past 12 months Now married:
27.9% (50)Unmarried:
72.1% (129)
Women who did not give birth in the past 12 months Now married:
44.7% (839)Unmarried:
55.3% (1,037)
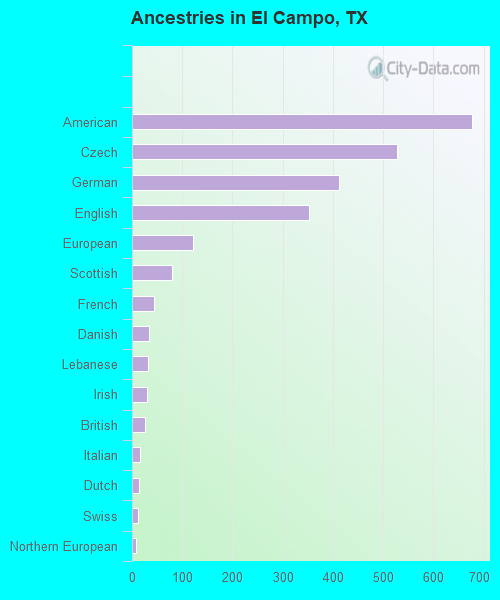
Ancestries in El Campo
677 8.4% American527 6.6% Czech412 5.1% German352 4.4% English122 1.5% European79 1.0% Scottish44 0.5% French33 0.4% Danish31 0.4% Lebanese30 0.4% Irish25 0.3% British15 0.2% Italian14 0.2% Dutch12 0.1% Swiss7 0.09% Northern European3 0.04% Cajun3 0.04% African
Children Nativity (place of birth) in El Campo
Children under 6 years - Living with two parents Both parents native 330 100.0% NativeBoth parents foreign-born 197 100.0% NativeOne native, one foreign-born parent 18 100.0% NativeChildren under 6 years - Living with one parent Native parent 370 100.0% NativeForeign-born parent 63 100.0% NativeChildren 6 to 17 years - Living with two parents Both parents native 1,001 100.0% NativeBoth parents foreign-born 330 100.0% NativeOne native, one foreign-born parent 209 100.0% NativeChildren 6 to 17 years - Living with one parent Native parent 586 100.0% NativeForeign-born parent 333 57.0% Native251 43.0% Foreign-born
Grandparents responsible for own grandchildren in El Campo
Grandparents (30 to 59 years) White / Caucasian 61 69.8% Responsible for grandchildren26 30.2% Not responsible for grandchildrenTwo or more races 64 100.0% Not responsible for grandchildrenHispanic or Latino 92 54.2% Responsible for grandchildren78 45.8% Not responsible for grandchildrenGrandparents (60 years and over) White / Caucasian 30 45.2% Responsible for grandchildren36 54.8% Not responsible for grandchildrenTwo or more races 38 100.0% Not responsible for grandchildrenHispanic or Latino 49 100.0% Not responsible for grandchildren