Races in El Dorado, Kansas (KS) Detailed Stats
Data:
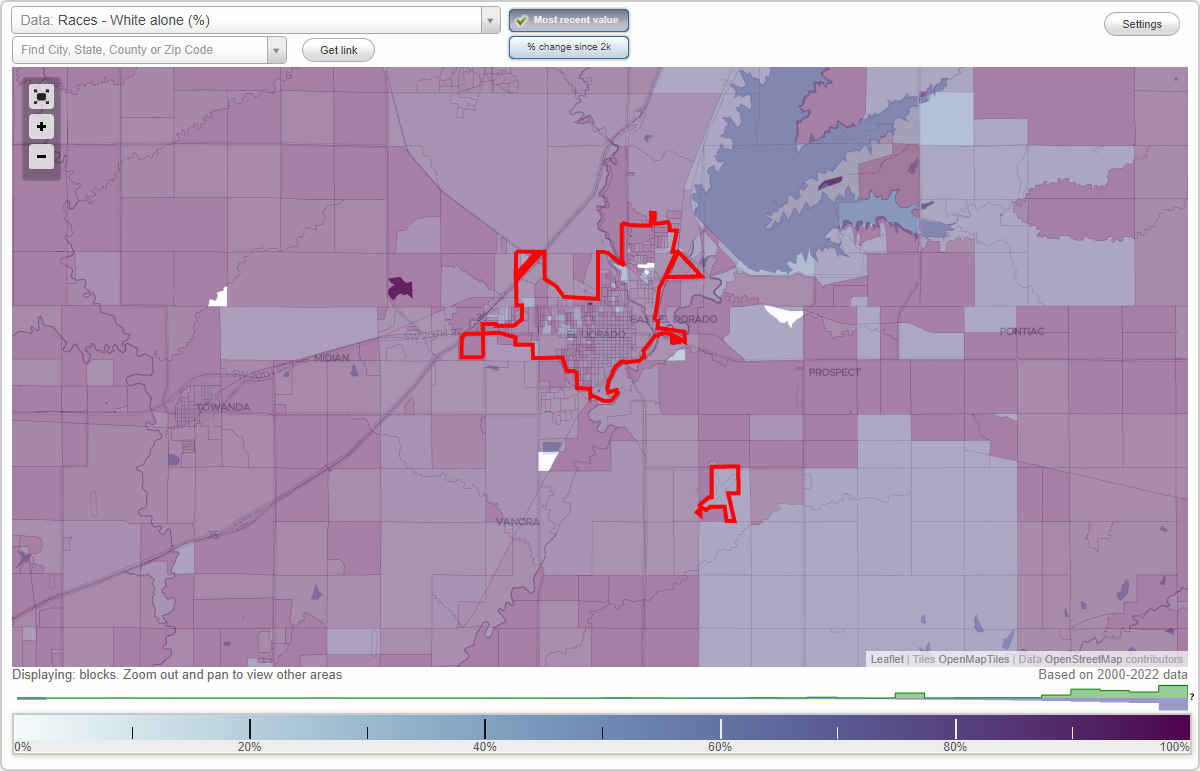
Races - White alone (%)
Races - White alone (% change since 2000)
Races - Black alone (%)
Races - Black alone (% change since 2000)
Races - American Indian alone (%)
Races - American Indian alone (% change since 2000)
Races - Asian alone (%)
Races - Asian alone (% change since 2000)
Races - Hispanic (%)
Races - Hispanic (% change since 2000)
Races - Native Hawaiian and Other Pacific Islander alone (%)
Races - Native Hawaiian and Other Pacific Islander alone (% change since 2000)
Races - Two or more races(%)
Races - Two or more races(% change since 2000)
Races - Other race alone (%)
Races - Other race alone (% change since 2000)
Racial diversity
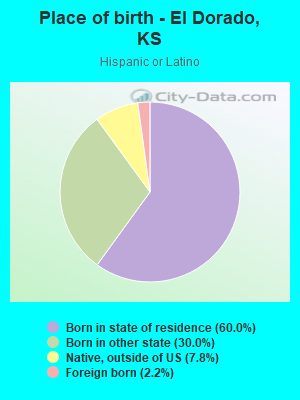
Place of birth - Born in state of residence (%)
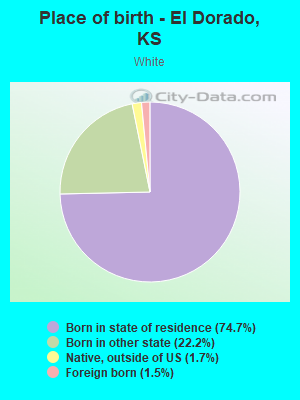
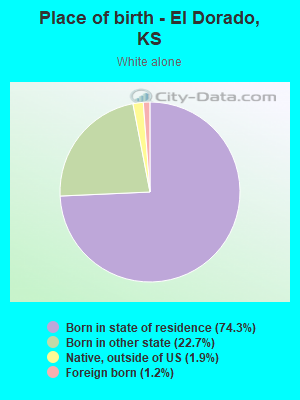
Place of birth - Born in state of residence (%) - White
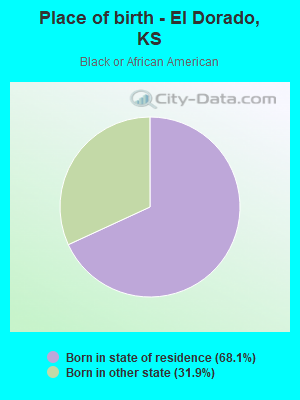
Place of birth - Born in state of residence (%) - Black or African American
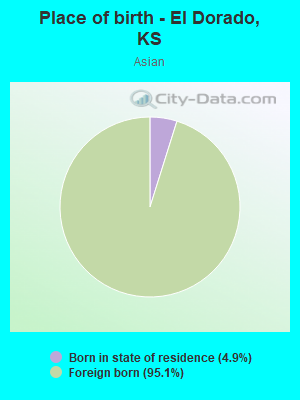
Place of birth - Born in state of residence (%) - Asian
Place of birth - Born in state of residence (%) - Hispanic or Latino
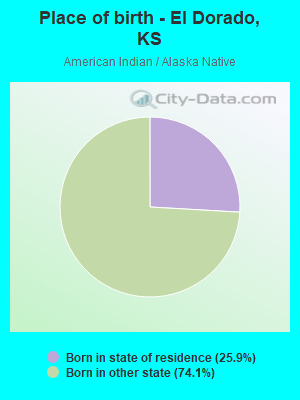
Place of birth - Born in state of residence (%) - American Indian and Alaska Native
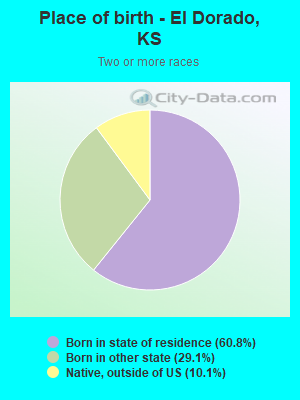
Place of birth - Born in state of residence (%) - Multirace
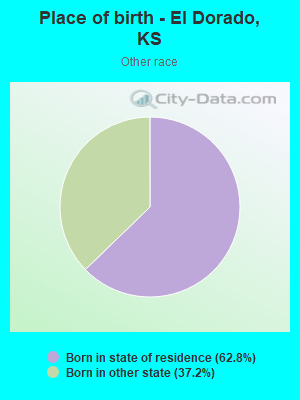
Place of birth - Born in state of residence (%) - Other Race
Place of birth - Born in other state (%)
Place of birth - Born in other state (%) - White
Place of birth - Born in other state (%) - Black or African American
Place of birth - Born in other state (%) - Asian
Place of birth - Born in other state (%) - Hispanic or Latino
Place of birth - Born in other state (%) - American Indian and Alaska Native
Place of birth - Born in other state (%) - Multirace
Place of birth - Born in other state (%) - Other Race
Place of birth - Native, outside of US (%)
Place of birth - Native, outside of US (%) - White
Place of birth - Native, outside of US (%) - Black or African American
Place of birth - Native, outside of US (%) - Asian
Place of birth - Native, outside of US (%) - Hispanic or Latino
Place of birth - Native, outside of US (%) - American Indian and Alaska Native
Place of birth - Native, outside of US (%) - Multirace
Place of birth - Native, outside of US (%) - Other Race
Place of birth - Foreign born (%)
Place of birth - Foreign born (%) - White
Place of birth - Foreign born (%) - Black or African American
Place of birth - Foreign born (%) - Asian
Place of birth - Foreign born (%) - Hispanic or Latino
Place of birth - Foreign born (%) - American Indian and Alaska Native
Place of birth - Foreign born (%) - Multirace
Place of birth - Foreign born (%) - Other Race
Residents speaking English at home (%)
Residents speaking English at home - Born in the United States (%)
Residents speaking English at home - Native, born elsewhere (%)
Residents speaking English at home - Foreign born (%)
Residents speaking Spanish at home (%)
Residents speaking Spanish at home - Born in the United States (%)
Residents speaking Spanish at home - Native, born elsewhere (%)
Residents speaking Spanish at home - Foreign born (%)
Residents speaking other language at home (%)
Residents speaking other language at home - Born in the United States (%)
Residents speaking other language at home - Native, born elsewhere (%)
Residents speaking other language at home - Foreign born (%)
Marital status - Never married (%)
Marital status - Now married (%)
Marital status - Separated (%)
Marital status - Widowed (%)
Marital status - Divorced (%)
Ancestries Reported - Arab (%)
Ancestries Reported - Czech (%)
Ancestries Reported - Danish (%)
Ancestries Reported - Dutch (%)
Ancestries Reported - English (%)
Ancestries Reported - French (%)
Ancestries Reported - French Canadian (%)
Ancestries Reported - German (%)
Ancestries Reported - Greek (%)
Ancestries Reported - Hungarian (%)
Ancestries Reported - Irish (%)
Ancestries Reported - Italian (%)
Ancestries Reported - Lithuanian (%)
Ancestries Reported - Norwegian (%)
Ancestries Reported - Polish (%)
Ancestries Reported - Portuguese (%)
Ancestries Reported - Russian (%)
Ancestries Reported - Scotch-Irish (%)
Ancestries Reported - Scottish (%)
Ancestries Reported - Slovak (%)
Ancestries Reported - Subsaharan African (%)
Ancestries Reported - Swedish (%)
Ancestries Reported - Swiss (%)
Ancestries Reported - Ukrainian (%)
Ancestries Reported - United States (%)
Ancestries Reported - Welsh (%)
Ancestries Reported - West Indian (%)
Ancestries Reported - Other (%)
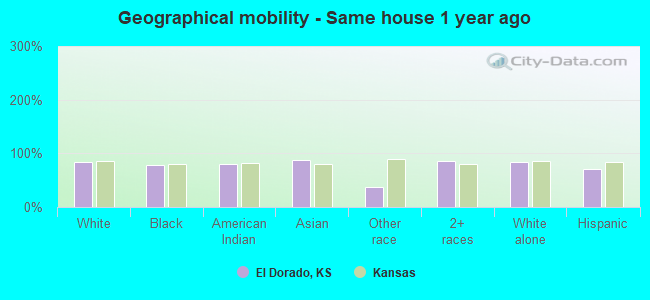
Geographical mobility - Same house 1 year ago (%)
Geographical mobility - Same house 1 year ago (%) - White
Geographical mobility - Same house 1 year ago (%) - Black or African American
Geographical mobility - Same house 1 year ago (%) - Asian
Geographical mobility - Same house 1 year ago (%) - Hispanic or Latino
Geographical mobility - Same house 1 year ago (%) - American Indian and Alaska Native
Geographical mobility - Same house 1 year ago (%) - Multirace
Geographical mobility - Same house 1 year ago (%) - Other Race
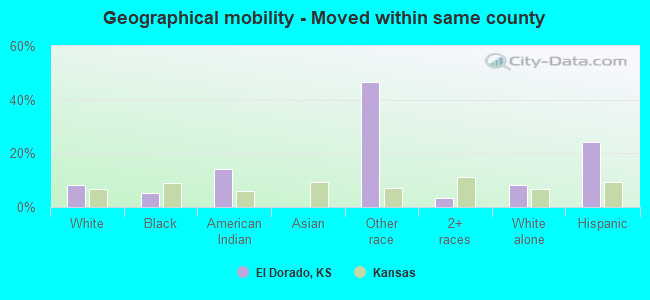
Geographical mobility - Moved within same county (%)
Geographical mobility - Moved within same county (%) - White
Geographical mobility - Moved within same county (%) - Black or African American
Geographical mobility - Moved within same county (%) - Asian
Geographical mobility - Moved within same county (%) - Hispanic or Latino
Geographical mobility - Moved within same county (%) - American Indian and Alaska Native
Geographical mobility - Moved within same county (%) - Multirace
Geographical mobility - Moved within same county (%) - Other Race
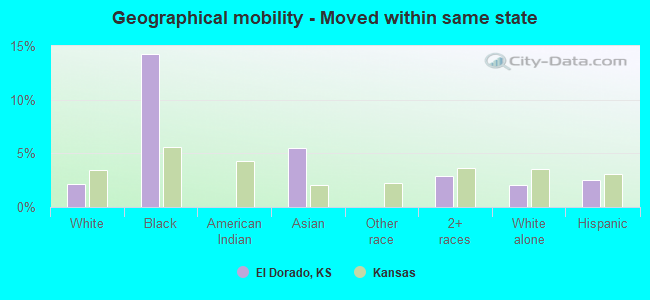
Geographical mobility - Moved from different county within same state (%)
Geographical mobility - Moved from different county within same state (%) - White
Geographical mobility - Moved from different county within same state (%) - Black or African American
Geographical mobility - Moved from different county within same state (%) - Asian
Geographical mobility - Moved from different county within same state (%) - Hispanic or Latino
Geographical mobility - Moved from different county within same state (%) - American Indian and Alaska Native
Geographical mobility - Moved from different county within same state (%) - Multirace
Geographical mobility - Moved from different county within same state (%) - Other Race
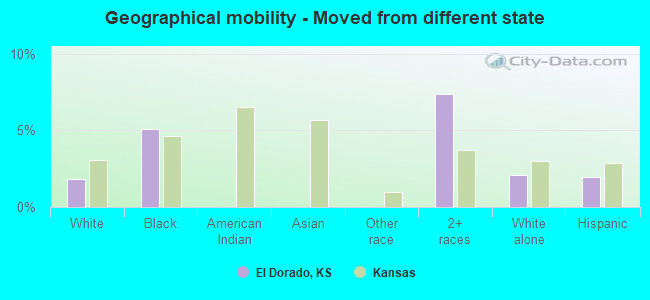
Geographical mobility - Moved from different state (%)
Geographical mobility - Moved from different state (%) - White
Geographical mobility - Moved from different state (%) - Black or African American
Geographical mobility - Moved from different state (%) - Asian
Geographical mobility - Moved from different state (%) - Hispanic or Latino
Geographical mobility - Moved from different state (%) - American Indian and Alaska Native
Geographical mobility - Moved from different state (%) - Multirace
Geographical mobility - Moved from different state (%) - Other Race
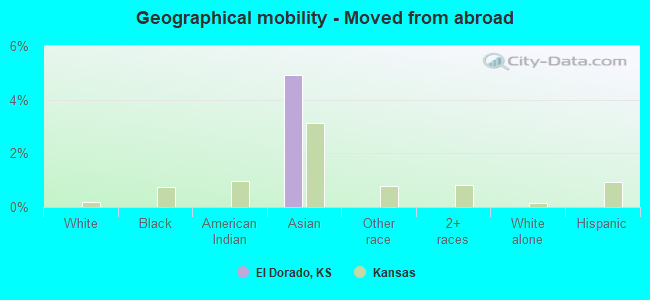
Geographical mobility - Moved from abroad (%)
Geographical mobility - Moved from abroad (%) - White
Geographical mobility - Moved from abroad (%) - Black or African American
Geographical mobility - Moved from abroad (%) - Asian
Geographical mobility - Moved from abroad (%) - Hispanic or Latino
Geographical mobility - Moved from abroad (%) - American Indian and Alaska Native
Geographical mobility - Moved from abroad (%) - Multirace
Geographical mobility - Moved from abroad (%) - Other Race
Place of birth for the foreign-born population - Ireland (%)
Place of birth for the foreign-born population - Denmark (%)
Place of birth for the foreign-born population - Norway (%)
Place of birth for the foreign-born population - Sweden (%)
Place of birth for the foreign-born population - United Kingdom (%)
Place of birth for the foreign-born population - England (%)
Place of birth for the foreign-born population - Scotland (%)
Place of birth for the foreign-born population - Other Northern Europe (%)
Place of birth for the foreign-born population - Austria (%)
Place of birth for the foreign-born population - Belgium (%)
Place of birth for the foreign-born population - France (%)
Place of birth for the foreign-born population - Germany (%)
Place of birth for the foreign-born population - Netherlands (%)
Place of birth for the foreign-born population - Switzerland (%)
Place of birth for the foreign-born population - Other Western Europe (%)
Place of birth for the foreign-born population - Greece (%)
Place of birth for the foreign-born population - Italy (%)
Place of birth for the foreign-born population - Portugal (%)
Place of birth for the foreign-born population - Spain (%)
Place of birth for the foreign-born population - Other Southern Europe (%)
Place of birth for the foreign-born population - Albania (%)
Place of birth for the foreign-born population - Belarus (%)
Place of birth for the foreign-born population - Bosnia and Herzegovina (%)
Place of birth for the foreign-born population - Bulgaria (%)
Place of birth for the foreign-born population - Croatia (%)
Place of birth for the foreign-born population - Czechoslovakia (%)
Place of birth for the foreign-born population - Hungary (%)
Place of birth for the foreign-born population - Latvia (%)
Place of birth for the foreign-born population - Lithuania (%)
Place of birth for the foreign-born population - North Macedonia (Macedonia) (%)
Place of birth for the foreign-born population - Moldova (%)
Place of birth for the foreign-born population - Poland (%)
Place of birth for the foreign-born population - Romania (%)
Place of birth for the foreign-born population - Russia (%)
Place of birth for the foreign-born population - Serbia (%)
Place of birth for the foreign-born population - Ukraine (%)
Place of birth for the foreign-born population - Other Eastern Europe (%)
Place of birth for the foreign-born population - China (%)
Place of birth for the foreign-born population - Hong Kong (%)
Place of birth for the foreign-born population - Taiwan (%)
Place of birth for the foreign-born population - Japan (%)
Place of birth for the foreign-born population - Korea (%)
Place of birth for the foreign-born population - Other Eastern Asia (%)
Place of birth for the foreign-born population - Afghanistan (%)
Place of birth for the foreign-born population - Bangladesh (%)
Place of birth for the foreign-born population - India (%)
Place of birth for the foreign-born population - Iran (%)
Place of birth for the foreign-born population - Kazakhstan (%)
Place of birth for the foreign-born population - Nepal (%)
Place of birth for the foreign-born population - Pakistan (%)
Place of birth for the foreign-born population - Sri Lanka (%)
Place of birth for the foreign-born population - Uzbekistan (%)
Place of birth for the foreign-born population - Other South Central Asia (%)
Place of birth for the foreign-born population - Burma (%)
Place of birth for the foreign-born population - Cambodia (%)
Place of birth for the foreign-born population - Indonesia (%)
Place of birth for the foreign-born population - Laos (%)
Place of birth for the foreign-born population - Malaysia (%)
Place of birth for the foreign-born population - Philippines (%)
Place of birth for the foreign-born population - Singapore (%)
Place of birth for the foreign-born population - Thailand (%)
Place of birth for the foreign-born population - Vietnam (%)
Place of birth for the foreign-born population - Other South Eastern Asia (%)
Place of birth for the foreign-born population - Armenia (%)
Place of birth for the foreign-born population - Iraq (%)
Place of birth for the foreign-born population - Israel (%)
Place of birth for the foreign-born population - Jordan (%)
Place of birth for the foreign-born population - Kuwait (%)
Place of birth for the foreign-born population - Lebanon (%)
Place of birth for the foreign-born population - Saudi Arabia (%)
Place of birth for the foreign-born population - Syria (%)
Place of birth for the foreign-born population - Turkey (%)
Place of birth for the foreign-born population - Yemen (%)
Place of birth for the foreign-born population - Other Western Asia (%)
Place of birth for the foreign-born population - Eritrea (%)
Place of birth for the foreign-born population - Ethiopia (%)
Place of birth for the foreign-born population - Kenya (%)
Place of birth for the foreign-born population - Somalia (%)
Place of birth for the foreign-born population - Uganda (%)
Place of birth for the foreign-born population - Zimbabwe (%)
Place of birth for the foreign-born population - Other Eastern Africa (%)
Place of birth for the foreign-born population - Cameroon (%)
Place of birth for the foreign-born population - Congo (%)
Place of birth for the foreign-born population - Democratic Republic of Congo (Zaire) (%)
Place of birth for the foreign-born population - Other Middle Africa (%)
Place of birth for the foreign-born population - Egypt (%)
Place of birth for the foreign-born population - Morocco (%)
Place of birth for the foreign-born population - Sudan (%)
Place of birth for the foreign-born population - Other Northern Africa (%)
Place of birth for the foreign-born population - South Africa (%)
Place of birth for the foreign-born population - Other Southern Africa (%)
Place of birth for the foreign-born population - Cabo Verde (%)
Place of birth for the foreign-born population - Ghana (%)
Place of birth for the foreign-born population - Liberia (%)
Place of birth for the foreign-born population - Nigeria (%)
Place of birth for the foreign-born population - Senegal (%)
Place of birth for the foreign-born population - Sierra Leone (%)
Place of birth for the foreign-born population - Other Western Africa (%)
Place of birth for the foreign-born population - Australia (%)
Place of birth for the foreign-born population - New Zealand (%)
Place of birth for the foreign-born population - Fiji (%)
Place of birth for the foreign-born population - Micronesia (%)
Place of birth for the foreign-born population - Bahamas (%)
Place of birth for the foreign-born population - Barbados (%)
Place of birth for the foreign-born population - Cuba (%)
Place of birth for the foreign-born population - Dominica (%)
Place of birth for the foreign-born population - Dominican Republic (%)
Place of birth for the foreign-born population - Grenada (%)
Place of birth for the foreign-born population - Haiti (%)
Place of birth for the foreign-born population - Jamaica (%)
Place of birth for the foreign-born population - St. Vincent and the Grenadines (%)
Place of birth for the foreign-born population - Trinidad and Tobago (%)
Place of birth for the foreign-born population - West Indies (%)
Place of birth for the foreign-born population - Other Caribbean (%)
Place of birth for the foreign-born population - Belize (%)
Place of birth for the foreign-born population - Costa Rica (%)
Place of birth for the foreign-born population - El Salvador (%)
Place of birth for the foreign-born population - Guatemala (%)
Place of birth for the foreign-born population - Honduras (%)
Place of birth for the foreign-born population - Mexico (%)
Place of birth for the foreign-born population - Nicaragua (%)
Place of birth for the foreign-born population - Panama (%)
Place of birth for the foreign-born population - Other Central America (%)
Place of birth for the foreign-born population - Argentina (%)
Place of birth for the foreign-born population - Bolivia (%)
Place of birth for the foreign-born population - Brazil (%)
Place of birth for the foreign-born population - Chile (%)
Place of birth for the foreign-born population - Colombia (%)
Place of birth for the foreign-born population - Ecuador (%)
Place of birth for the foreign-born population - Guyana (%)
Place of birth for the foreign-born population - Peru (%)
Place of birth for the foreign-born population - Uruguay (%)
Place of birth for the foreign-born population - Venezuela (%)
Place of birth for the foreign-born population - Other South America (%)
Place of birth for the foreign-born population - Canada (%)
Place of birth for the foreign-born population - Other Northern America (%)
Place of birth for the foreign-born population - Other (%)
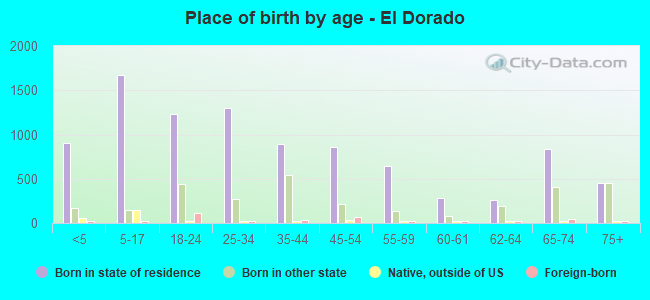
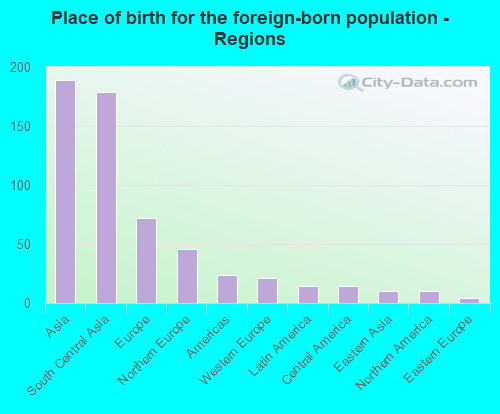
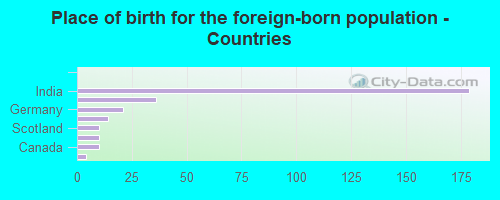
According to 2022 data, the most numerous races in El Dorado, KS are White alone (11,208 residents), Hispanic (615 residents), and Black alone (192 residents). 95.1% of El Dorado residents speak English at home. 2.2% of El Dorado, KS residents are foreign-born (1.4% born in Asia, 0.5% born in Europe), which is 218.2% less than the foreign-born rate of 7.0% across the entire state of Kansas.
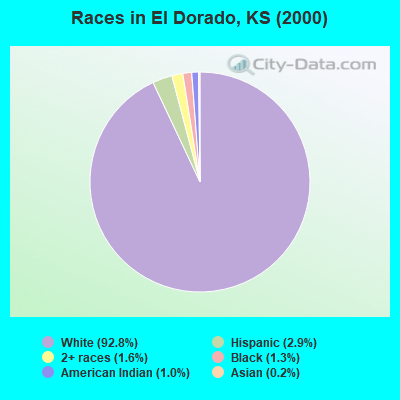
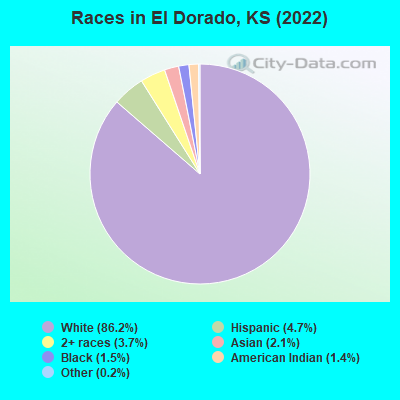
Race distribution in El Dorado
2000 2022
2,233,997 83.1% White alone 188,252 7.0% Hispanic 151,407 5.6% Black alone 46,301 1.7% Asian alone 42,508 1.6% Two or more races 22,322 0.8% American Indian alone 2,477 0.09% Other race alone 1,154 0.04% Native Hawaiian and Other
2,147,943 73.1% White alone 381,746 13.0% Hispanic 147,666 5.0% Black alone 145,362 4.9% Two or more races 85,085 2.9% Asian alone 13,263 0.5% Other race alone 12,065 0.4% American Indian alone 4,020 0.1% Native Hawaiian and Other
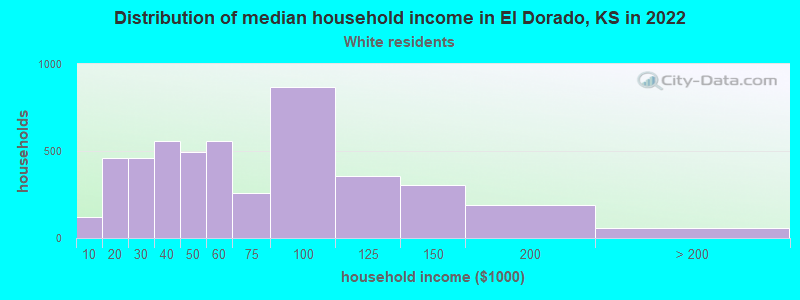
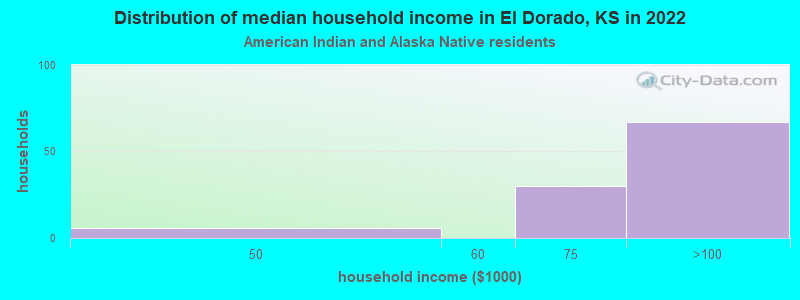
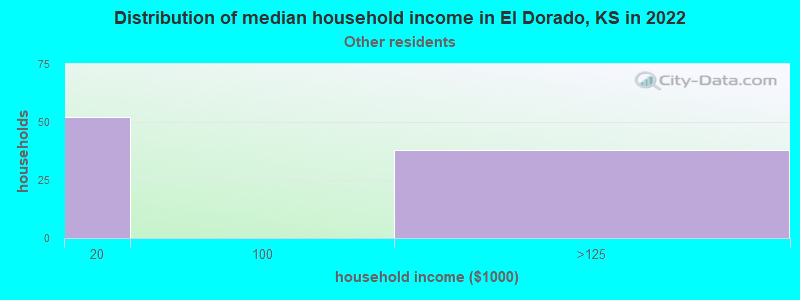
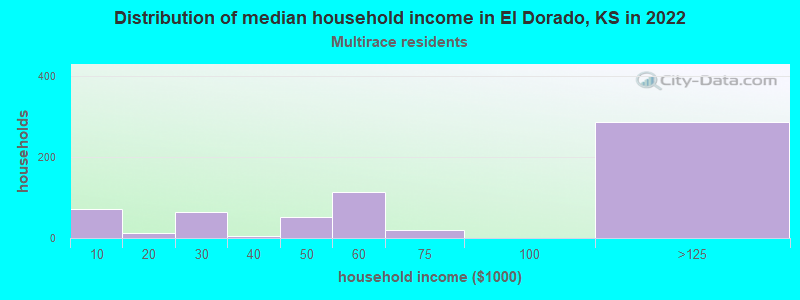
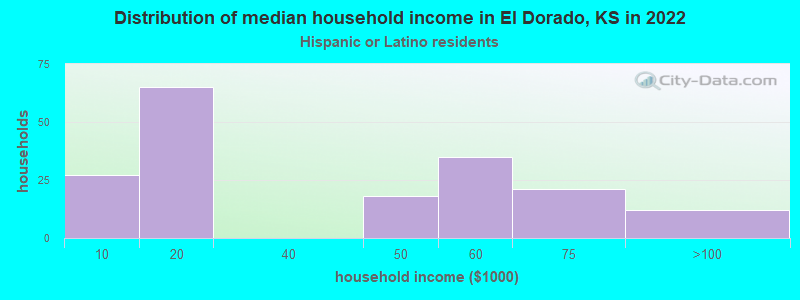
Income and house value in El Dorado Median household income in 2022 $51,714 White non-Hispanic householders$109,422 American Indian and Alaska Native householders$41,127 Two or more races householdersMedian 2022 house value $111,633 White Non-Hispanic householders$98,552 Black or African American householders$107,512 American Indian or Alaska Native householders$116,471 Some other race householders$122,922 Two or more races householders$118,621 Hispanic or Latino householders
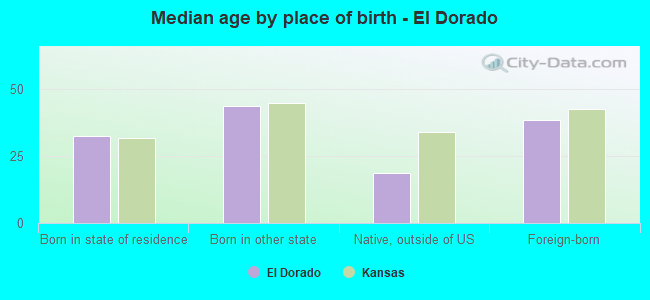
Median age by race in El Dorado
36.0 Median age for White residents34.1 38.3 34.0 Median age for Black or African American residents38.9 23.2 29.7 Median age for American Indian / Alaska Native residents25.5 22.8 34.1 Median age for Asian residents-1,018,518,517.5 34.8 -627,039,626.4 Median age for Native Hawaiian / Pacific Islander residents-666,666,666.0 -666,666,666.0 29.4 Median age for Other race residents-1,235,820,894.3 19.4 36.4 Median age for Two or more races residents12.1 27.8 36.2 Median age for White alone residents34.0 38.8 23.5 Median age for Hispanic or Latino residents33.1 23.7
Owner/renter occupied households by race in El Dorado
House owners and renters - White residents 3,000 63.3% Owner occupied1,738 36.7% Renter occupiedHouse owners and renters - Black or African American residents 16 100.0% Renter occupiedHouse owners and renters - American Indian / Alaska Native residents 39 43.8% Owner occupied49 56.2% Renter occupiedHouse owners and renters - Asian residents 37 100.0% Renter occupiedHouse owners and renters - Other race residents 27 37.5% Owner occupied45 62.5% Renter occupiedHouse owners and renters - Two or more races residents 305 76.0% Owner occupied96 24.0% Renter occupiedHouse owners and renters - White alone residents 2,926 62.6% Owner occupied1,750 37.4% Renter occupiedHouse owners and renters - Hispanic or Latino residents 86 41.1% Owner occupied123 58.9% Renter occupied
Language usage in El Dorado
English speakers - Total 95.1% of residents of El Dorado speak English at home.
1.7% of residents speak Spanish at home 201 100.0% Speak English very well3.2% of residents speak other language at home 292 77.7% Speak English very well84 22.3% Speak English less than very well
English speakers - Born in the United States 95.2% of residents of El Dorado speak English at home.
2.3% of residents speak Spanish at home 64 100.0% Speak English very well2.4% of residents speak other language at home 66 100.0% Speak English very well
English speakers - Native, born elsewhere 85.4% of residents of El Dorado speak English at home.
15.9% of residents speak other language at home 26 100.0% Speak English very well
English speakers - Foreign-born 21.7% of residents of El Dorado speak English at home.
5.0% of residents speak Spanish at home 14 100.0% Speak English very well71.5% of residents speak other language at home 114 56.7% Speak English very well87 43.3% Speak English less than very well
White (Caucasian) - Speak only English Native:
98.8% (10,233)Foreign-born:
39.7% (69)
White (Caucasian) - Speak another language Native:
1.3% (131)Foreign-born:
10.2% (18)
White alone - Speak only English Native:
98.4% (9,933)Foreign-born:
68.6% (54)
White alone - Speak another language Native:
1.6% (157)Foreign-born:
27.5% (22)
Hispanic or Latino - Speak another language Native:
37.8% (190)Foreign-born:
98.4% (14)
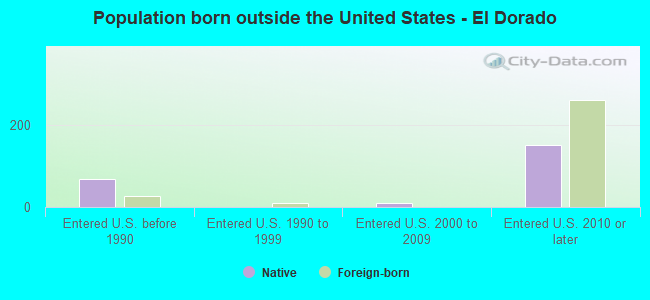
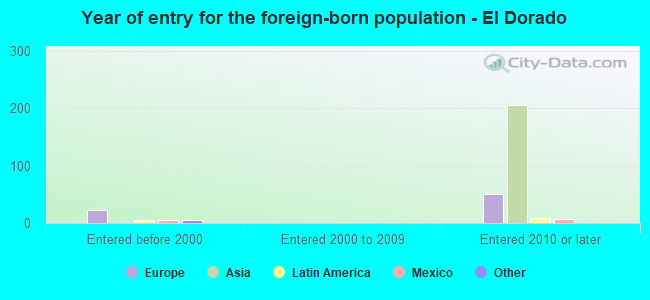
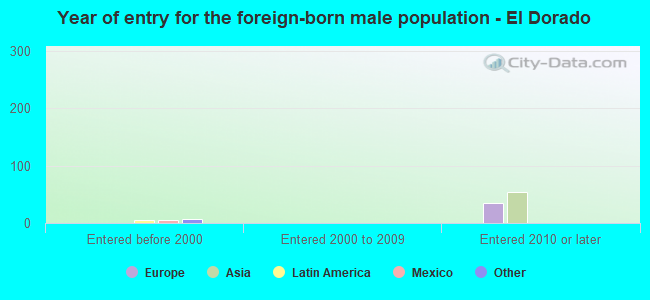
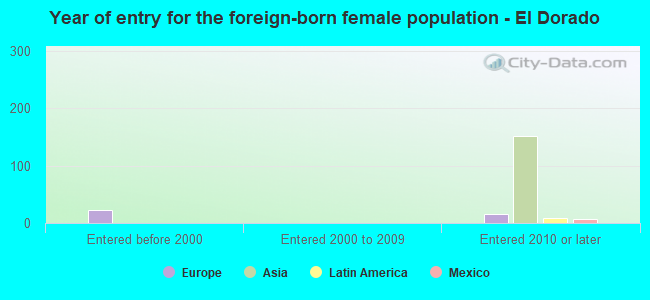
Foreign-born residents in El Dorado 286 residents are foreign born (1.4% Asia , 0.5% Europe ).
This city:
2.2%Kansas:
7.1%
Marital status for residents in El Dorado Marital status - White (Caucasian) population 15 years and over
Males 28.5% Never married53.8% Now married0.9% Separated6.0% Widowed10.8% DivorcedFemales 21.5% Never married50.3% Now married0.5% Separated9.2% Widowed18.5% DivorcedWomen who gave birth in the past 12 months Now married:
67.0% (135)Unmarried:
33.0% (66)
Women who did not give birth in the past 12 months Now married:
53.1% (1,336)Unmarried:
46.9% (1,181)
Marital status - Black or African American population 15 years and over
Males 74.4% Never married25.6% Now married0.0% Separated0.0% Widowed0.0% DivorcedFemales 74.2% Never married25.8% Now married0.0% Separated0.0% Widowed0.0% DivorcedWomen who did not give birth in the past 12 months Now married:
0.0% (0)Unmarried:
100.0% (50)
Marital status - American Indian / Alaska Native population 15 years and over
Males 20.6% Never married79.4% Now married0.0% Separated0.0% Widowed0.0% DivorcedFemales 88.9% Never married0.0% Now married0.0% Separated11.1% Widowed0.0% DivorcedWomen who did not give birth in the past 12 months Now married:
0.0% (0)Unmarried:
100.0% (54)
Marital status - Asian population 15 years and over
Males 14.1% Never married0.0% Now married0.0% Separated85.9% Widowed0.0% DivorcedFemales 71.8% Never married28.2% Now married0.0% Separated0.0% Widowed0.0% DivorcedWomen who did not give birth in the past 12 months Now married:
28.2% (37)Unmarried:
71.8% (94)
Marital status - Other race population 15 years and over
Males 43.9% Never married0.0% Now married0.0% Separated0.0% Widowed56.1% DivorcedFemales 0.0% Never married0.0% Now married0.0% Separated36.4% Widowed63.6% DivorcedMarital status - Two or more races population 15 years and over
Males 0.0% Never married39.5% Now married0.0% Separated18.6% Widowed41.9% DivorcedFemales 28.3% Never married47.9% Now married0.0% Separated3.5% Widowed20.3% DivorcedWomen who gave birth in the past 12 months Now married:
100.0% (270)Unmarried:
0.0% (0)
Women who did not give birth in the past 12 months Now married:
0.0% (0)Unmarried:
100.0% (138)
Marital status - White alone, not Hispanic / Latino population 15 years and over
Males 29.1% Never married53.9% Now married0.9% Separated6.1% Widowed10.0% DivorcedFemales 20.5% Never married51.3% Now married0.5% Separated8.9% Widowed18.9% DivorcedWomen who gave birth in the past 12 months Now married:
77.6% (133)Unmarried:
22.4% (38)
Women who did not give birth in the past 12 months Now married:
54.1% (1,314)Unmarried:
45.9% (1,117)
Marital status - Hispanic or Latino population 15 years and over
Males 16.8% Never married35.8% Now married0.0% Separated0.0% Widowed47.4% DivorcedFemales 66.0% Never married16.3% Now married0.0% Separated17.7% Widowed0.0% DivorcedWomen who gave birth in the past 12 months Now married:
52.7% (31)Unmarried:
47.3% (27)
Women who did not give birth in the past 12 months Now married:
0.0% (0)Unmarried:
100.0% (77)
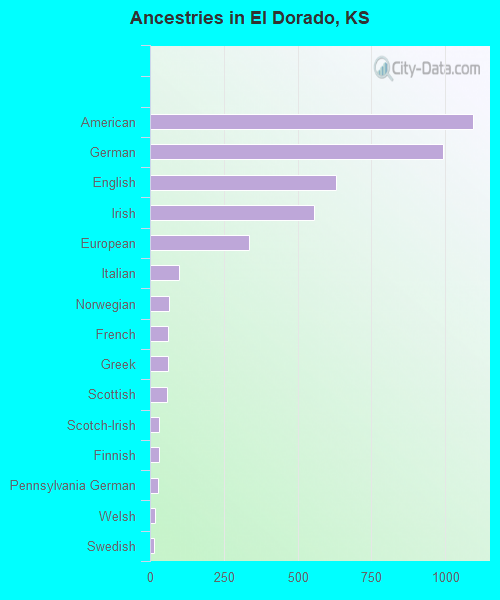
Ancestries in El Dorado
1,094 18.8% American992 17.0% German629 10.8% English556 9.5% Irish335 5.8% European98 1.7% Italian63 1.1% Norwegian62 1.1% French62 1.1% Greek56 1.0% Scottish32 0.5% Scotch-Irish29 0.5% Finnish26 0.4% Pennsylvania German16 0.3% Welsh15 0.3% Swedish8 0.1% Slovak6 0.1% Canadian2 0.03% Danish
Children Nativity (place of birth) in El Dorado
Children under 6 years - Living with two parents Both parents native 784 100.0% NativeChildren under 6 years - Living with one parent Native parent 297 100.0% NativeChildren 6 to 17 years - Living with two parents Both parents native 1,116 100.0% NativeChildren 6 to 17 years - Living with one parent Native parent 647 94.0% Native42 6.0% Foreign-bornForeign-born parent 42 100.0% Native
Grandparents responsible for own grandchildren in El Dorado
Grandparents (30 to 59 years) White / Caucasian 8 22.8% Responsible for grandchildren26 77.2% Not responsible for grandchildrenWhite alone, not Hispanic / Latino 8 22.4% Responsible for grandchildren28 77.6% Not responsible for grandchildrenGrandparents (60 years and over) White / Caucasian 6 9.6% Responsible for grandchildren53 90.4% Not responsible for grandchildrenWhite alone, not Hispanic / Latino 6 9.1% Responsible for grandchildren58 90.9% Not responsible for grandchildren