Races in Elgin, Illinois (IL) Detailed Stats
Data:
Races - White alone (%)
Races - White alone (% change since 2000)
Races - Black alone (%)
Races - Black alone (% change since 2000)
Races - American Indian alone (%)
Races - American Indian alone (% change since 2000)
Races - Asian alone (%)
Races - Asian alone (% change since 2000)
Races - Hispanic (%)
Races - Hispanic (% change since 2000)
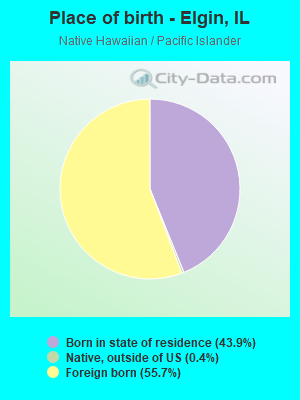
Races - Native Hawaiian and Other Pacific Islander alone (%)
Races - Native Hawaiian and Other Pacific Islander alone (% change since 2000)
Races - Two or more races(%)
Races - Two or more races(% change since 2000)
Races - Other race alone (%)
Races - Other race alone (% change since 2000)
Racial diversity
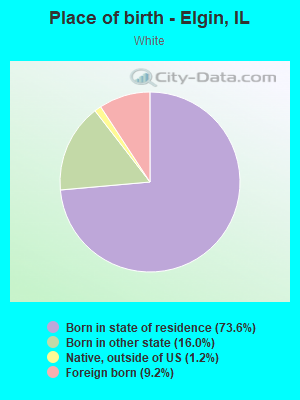
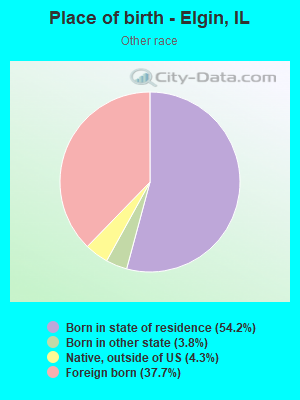
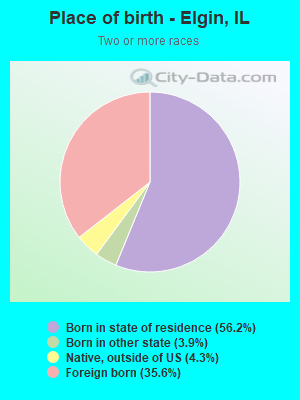
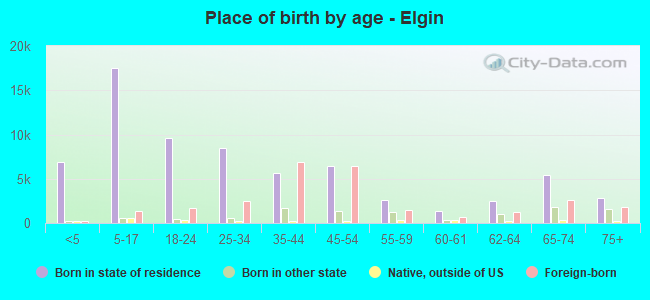
Place of birth - Born in state of residence (%)
Place of birth - Born in state of residence (%) - White
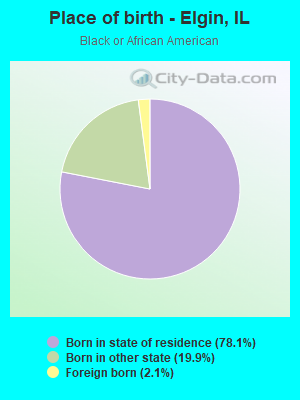
Place of birth - Born in state of residence (%) - Black or African American
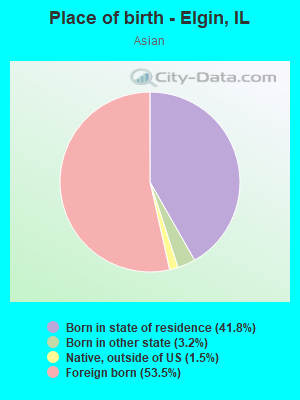
Place of birth - Born in state of residence (%) - Asian
Place of birth - Born in state of residence (%) - Hispanic or Latino
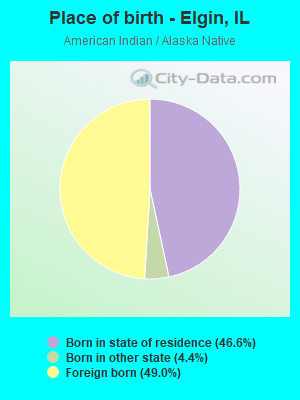
Place of birth - Born in state of residence (%) - American Indian and Alaska Native
Place of birth - Born in state of residence (%) - Multirace
Place of birth - Born in state of residence (%) - Other Race
Place of birth - Born in other state (%)
Place of birth - Born in other state (%) - White
Place of birth - Born in other state (%) - Black or African American
Place of birth - Born in other state (%) - Asian
Place of birth - Born in other state (%) - Hispanic or Latino
Place of birth - Born in other state (%) - American Indian and Alaska Native
Place of birth - Born in other state (%) - Multirace
Place of birth - Born in other state (%) - Other Race
Place of birth - Native, outside of US (%)
Place of birth - Native, outside of US (%) - White
Place of birth - Native, outside of US (%) - Black or African American
Place of birth - Native, outside of US (%) - Asian
Place of birth - Native, outside of US (%) - Hispanic or Latino
Place of birth - Native, outside of US (%) - American Indian and Alaska Native
Place of birth - Native, outside of US (%) - Multirace
Place of birth - Native, outside of US (%) - Other Race
Place of birth - Foreign born (%)
Place of birth - Foreign born (%) - White
Place of birth - Foreign born (%) - Black or African American
Place of birth - Foreign born (%) - Asian
Place of birth - Foreign born (%) - Hispanic or Latino
Place of birth - Foreign born (%) - American Indian and Alaska Native
Place of birth - Foreign born (%) - Multirace
Place of birth - Foreign born (%) - Other Race
Residents speaking English at home (%)
Residents speaking English at home - Born in the United States (%)
Residents speaking English at home - Native, born elsewhere (%)
Residents speaking English at home - Foreign born (%)
Residents speaking Spanish at home (%)
Residents speaking Spanish at home - Born in the United States (%)
Residents speaking Spanish at home - Native, born elsewhere (%)
Residents speaking Spanish at home - Foreign born (%)
Residents speaking other language at home (%)
Residents speaking other language at home - Born in the United States (%)
Residents speaking other language at home - Native, born elsewhere (%)
Residents speaking other language at home - Foreign born (%)
Marital status - Never married (%)
Marital status - Now married (%)
Marital status - Separated (%)
Marital status - Widowed (%)
Marital status - Divorced (%)
Ancestries Reported - Arab (%)
Ancestries Reported - Czech (%)
Ancestries Reported - Danish (%)
Ancestries Reported - Dutch (%)
Ancestries Reported - English (%)
Ancestries Reported - French (%)
Ancestries Reported - French Canadian (%)
Ancestries Reported - German (%)
Ancestries Reported - Greek (%)
Ancestries Reported - Hungarian (%)
Ancestries Reported - Irish (%)
Ancestries Reported - Italian (%)
Ancestries Reported - Lithuanian (%)
Ancestries Reported - Norwegian (%)
Ancestries Reported - Polish (%)
Ancestries Reported - Portuguese (%)
Ancestries Reported - Russian (%)
Ancestries Reported - Scotch-Irish (%)
Ancestries Reported - Scottish (%)
Ancestries Reported - Slovak (%)
Ancestries Reported - Subsaharan African (%)
Ancestries Reported - Swedish (%)
Ancestries Reported - Swiss (%)
Ancestries Reported - Ukrainian (%)
Ancestries Reported - United States (%)
Ancestries Reported - Welsh (%)
Ancestries Reported - West Indian (%)
Ancestries Reported - Other (%)
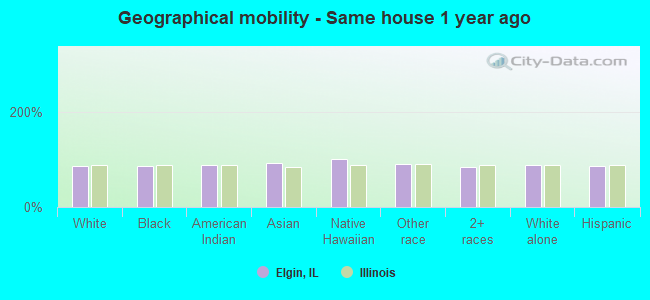
Geographical mobility - Same house 1 year ago (%)
Geographical mobility - Same house 1 year ago (%) - White
Geographical mobility - Same house 1 year ago (%) - Black or African American
Geographical mobility - Same house 1 year ago (%) - Asian
Geographical mobility - Same house 1 year ago (%) - Hispanic or Latino
Geographical mobility - Same house 1 year ago (%) - American Indian and Alaska Native
Geographical mobility - Same house 1 year ago (%) - Multirace
Geographical mobility - Same house 1 year ago (%) - Other Race
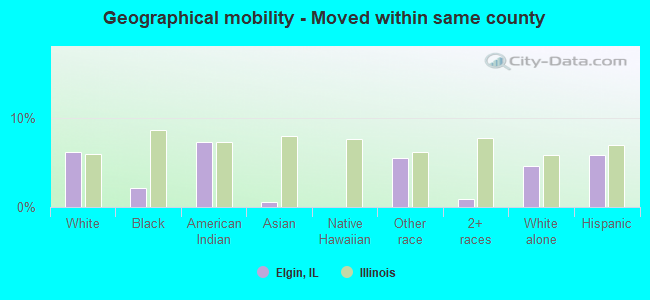
Geographical mobility - Moved within same county (%)
Geographical mobility - Moved within same county (%) - White
Geographical mobility - Moved within same county (%) - Black or African American
Geographical mobility - Moved within same county (%) - Asian
Geographical mobility - Moved within same county (%) - Hispanic or Latino
Geographical mobility - Moved within same county (%) - American Indian and Alaska Native
Geographical mobility - Moved within same county (%) - Multirace
Geographical mobility - Moved within same county (%) - Other Race
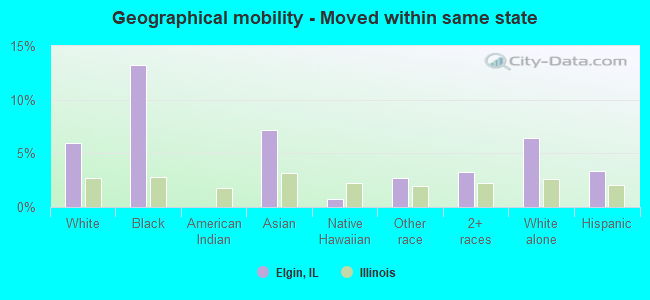
Geographical mobility - Moved from different county within same state (%)
Geographical mobility - Moved from different county within same state (%) - White
Geographical mobility - Moved from different county within same state (%) - Black or African American
Geographical mobility - Moved from different county within same state (%) - Asian
Geographical mobility - Moved from different county within same state (%) - Hispanic or Latino
Geographical mobility - Moved from different county within same state (%) - American Indian and Alaska Native
Geographical mobility - Moved from different county within same state (%) - Multirace
Geographical mobility - Moved from different county within same state (%) - Other Race
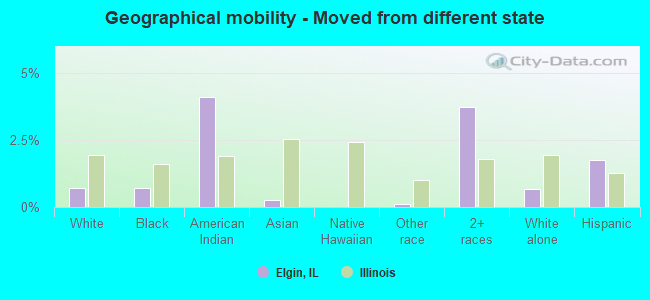
Geographical mobility - Moved from different state (%)
Geographical mobility - Moved from different state (%) - White
Geographical mobility - Moved from different state (%) - Black or African American
Geographical mobility - Moved from different state (%) - Asian
Geographical mobility - Moved from different state (%) - Hispanic or Latino
Geographical mobility - Moved from different state (%) - American Indian and Alaska Native
Geographical mobility - Moved from different state (%) - Multirace
Geographical mobility - Moved from different state (%) - Other Race
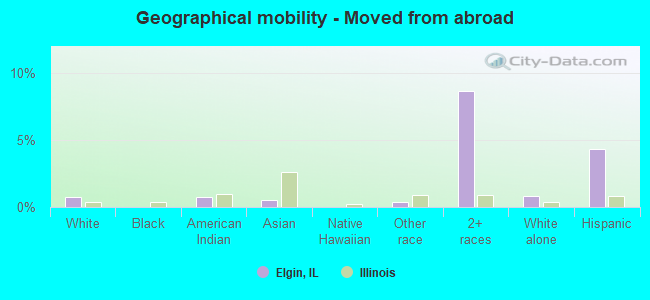
Geographical mobility - Moved from abroad (%)
Geographical mobility - Moved from abroad (%) - White
Geographical mobility - Moved from abroad (%) - Black or African American
Geographical mobility - Moved from abroad (%) - Asian
Geographical mobility - Moved from abroad (%) - Hispanic or Latino
Geographical mobility - Moved from abroad (%) - American Indian and Alaska Native
Geographical mobility - Moved from abroad (%) - Multirace
Geographical mobility - Moved from abroad (%) - Other Race
Place of birth for the foreign-born population - Ireland (%)
Place of birth for the foreign-born population - Denmark (%)
Place of birth for the foreign-born population - Norway (%)
Place of birth for the foreign-born population - Sweden (%)
Place of birth for the foreign-born population - United Kingdom (%)
Place of birth for the foreign-born population - England (%)
Place of birth for the foreign-born population - Scotland (%)
Place of birth for the foreign-born population - Other Northern Europe (%)
Place of birth for the foreign-born population - Austria (%)
Place of birth for the foreign-born population - Belgium (%)
Place of birth for the foreign-born population - France (%)
Place of birth for the foreign-born population - Germany (%)
Place of birth for the foreign-born population - Netherlands (%)
Place of birth for the foreign-born population - Switzerland (%)
Place of birth for the foreign-born population - Other Western Europe (%)
Place of birth for the foreign-born population - Greece (%)
Place of birth for the foreign-born population - Italy (%)
Place of birth for the foreign-born population - Portugal (%)
Place of birth for the foreign-born population - Spain (%)
Place of birth for the foreign-born population - Other Southern Europe (%)
Place of birth for the foreign-born population - Albania (%)
Place of birth for the foreign-born population - Belarus (%)
Place of birth for the foreign-born population - Bosnia and Herzegovina (%)
Place of birth for the foreign-born population - Bulgaria (%)
Place of birth for the foreign-born population - Croatia (%)
Place of birth for the foreign-born population - Czechoslovakia (%)
Place of birth for the foreign-born population - Hungary (%)
Place of birth for the foreign-born population - Latvia (%)
Place of birth for the foreign-born population - Lithuania (%)
Place of birth for the foreign-born population - North Macedonia (Macedonia) (%)
Place of birth for the foreign-born population - Moldova (%)
Place of birth for the foreign-born population - Poland (%)
Place of birth for the foreign-born population - Romania (%)
Place of birth for the foreign-born population - Russia (%)
Place of birth for the foreign-born population - Serbia (%)
Place of birth for the foreign-born population - Ukraine (%)
Place of birth for the foreign-born population - Other Eastern Europe (%)
Place of birth for the foreign-born population - China (%)
Place of birth for the foreign-born population - Hong Kong (%)
Place of birth for the foreign-born population - Taiwan (%)
Place of birth for the foreign-born population - Japan (%)
Place of birth for the foreign-born population - Korea (%)
Place of birth for the foreign-born population - Other Eastern Asia (%)
Place of birth for the foreign-born population - Afghanistan (%)
Place of birth for the foreign-born population - Bangladesh (%)
Place of birth for the foreign-born population - India (%)
Place of birth for the foreign-born population - Iran (%)
Place of birth for the foreign-born population - Kazakhstan (%)
Place of birth for the foreign-born population - Nepal (%)
Place of birth for the foreign-born population - Pakistan (%)
Place of birth for the foreign-born population - Sri Lanka (%)
Place of birth for the foreign-born population - Uzbekistan (%)
Place of birth for the foreign-born population - Other South Central Asia (%)
Place of birth for the foreign-born population - Burma (%)
Place of birth for the foreign-born population - Cambodia (%)
Place of birth for the foreign-born population - Indonesia (%)
Place of birth for the foreign-born population - Laos (%)
Place of birth for the foreign-born population - Malaysia (%)
Place of birth for the foreign-born population - Philippines (%)
Place of birth for the foreign-born population - Singapore (%)
Place of birth for the foreign-born population - Thailand (%)
Place of birth for the foreign-born population - Vietnam (%)
Place of birth for the foreign-born population - Other South Eastern Asia (%)
Place of birth for the foreign-born population - Armenia (%)
Place of birth for the foreign-born population - Iraq (%)
Place of birth for the foreign-born population - Israel (%)
Place of birth for the foreign-born population - Jordan (%)
Place of birth for the foreign-born population - Kuwait (%)
Place of birth for the foreign-born population - Lebanon (%)
Place of birth for the foreign-born population - Saudi Arabia (%)
Place of birth for the foreign-born population - Syria (%)
Place of birth for the foreign-born population - Turkey (%)
Place of birth for the foreign-born population - Yemen (%)
Place of birth for the foreign-born population - Other Western Asia (%)
Place of birth for the foreign-born population - Eritrea (%)
Place of birth for the foreign-born population - Ethiopia (%)
Place of birth for the foreign-born population - Kenya (%)
Place of birth for the foreign-born population - Somalia (%)
Place of birth for the foreign-born population - Uganda (%)
Place of birth for the foreign-born population - Zimbabwe (%)
Place of birth for the foreign-born population - Other Eastern Africa (%)
Place of birth for the foreign-born population - Cameroon (%)
Place of birth for the foreign-born population - Congo (%)
Place of birth for the foreign-born population - Democratic Republic of Congo (Zaire) (%)
Place of birth for the foreign-born population - Other Middle Africa (%)
Place of birth for the foreign-born population - Egypt (%)
Place of birth for the foreign-born population - Morocco (%)
Place of birth for the foreign-born population - Sudan (%)
Place of birth for the foreign-born population - Other Northern Africa (%)
Place of birth for the foreign-born population - South Africa (%)
Place of birth for the foreign-born population - Other Southern Africa (%)
Place of birth for the foreign-born population - Cabo Verde (%)
Place of birth for the foreign-born population - Ghana (%)
Place of birth for the foreign-born population - Liberia (%)
Place of birth for the foreign-born population - Nigeria (%)
Place of birth for the foreign-born population - Senegal (%)
Place of birth for the foreign-born population - Sierra Leone (%)
Place of birth for the foreign-born population - Other Western Africa (%)
Place of birth for the foreign-born population - Australia (%)
Place of birth for the foreign-born population - New Zealand (%)
Place of birth for the foreign-born population - Fiji (%)
Place of birth for the foreign-born population - Micronesia (%)
Place of birth for the foreign-born population - Bahamas (%)
Place of birth for the foreign-born population - Barbados (%)
Place of birth for the foreign-born population - Cuba (%)
Place of birth for the foreign-born population - Dominica (%)
Place of birth for the foreign-born population - Dominican Republic (%)
Place of birth for the foreign-born population - Grenada (%)
Place of birth for the foreign-born population - Haiti (%)
Place of birth for the foreign-born population - Jamaica (%)
Place of birth for the foreign-born population - St. Vincent and the Grenadines (%)
Place of birth for the foreign-born population - Trinidad and Tobago (%)
Place of birth for the foreign-born population - West Indies (%)
Place of birth for the foreign-born population - Other Caribbean (%)
Place of birth for the foreign-born population - Belize (%)
Place of birth for the foreign-born population - Costa Rica (%)
Place of birth for the foreign-born population - El Salvador (%)
Place of birth for the foreign-born population - Guatemala (%)
Place of birth for the foreign-born population - Honduras (%)
Place of birth for the foreign-born population - Mexico (%)
Place of birth for the foreign-born population - Nicaragua (%)
Place of birth for the foreign-born population - Panama (%)
Place of birth for the foreign-born population - Other Central America (%)
Place of birth for the foreign-born population - Argentina (%)
Place of birth for the foreign-born population - Bolivia (%)
Place of birth for the foreign-born population - Brazil (%)
Place of birth for the foreign-born population - Chile (%)
Place of birth for the foreign-born population - Colombia (%)
Place of birth for the foreign-born population - Ecuador (%)
Place of birth for the foreign-born population - Guyana (%)
Place of birth for the foreign-born population - Peru (%)
Place of birth for the foreign-born population - Uruguay (%)
Place of birth for the foreign-born population - Venezuela (%)
Place of birth for the foreign-born population - Other South America (%)
Place of birth for the foreign-born population - Canada (%)
Place of birth for the foreign-born population - Other Northern America (%)
Place of birth for the foreign-born population - Other (%)
Latest news about races in Elgin, IL collected exclusively by city-data.com from local newspapers, TV, and radio stations
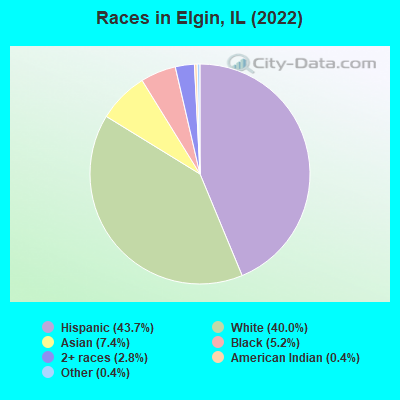
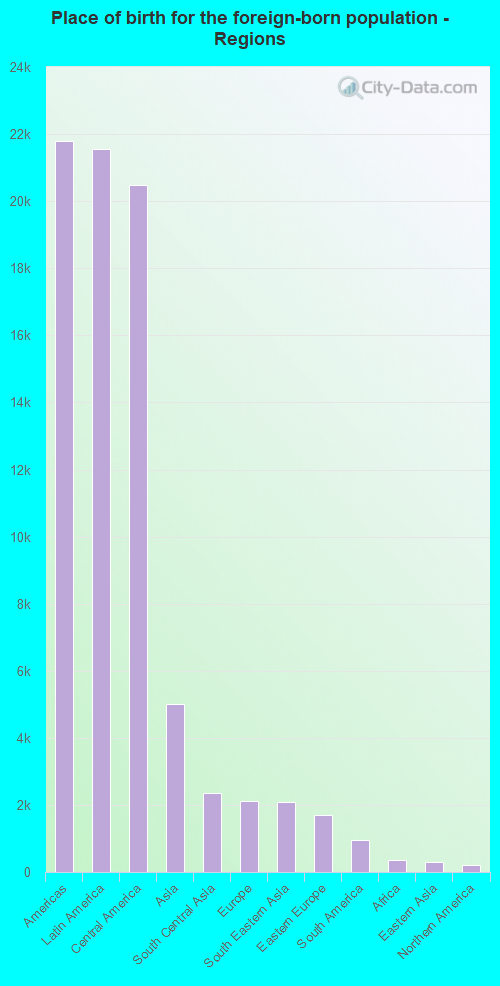
According to 2022 data, the most numerous races in Elgin, IL are White alone (43,861 residents), Hispanic (47,924 residents), and Black alone (5,748 residents). 55.6% of Elgin residents speak English at home. 25.8% of Elgin, IL residents are foreign-born (18.8% born in Latin America, 4.4% born in Asia), which is 45.8% greater than the foreign-born rate of 14.0% across the entire state of Illinois.
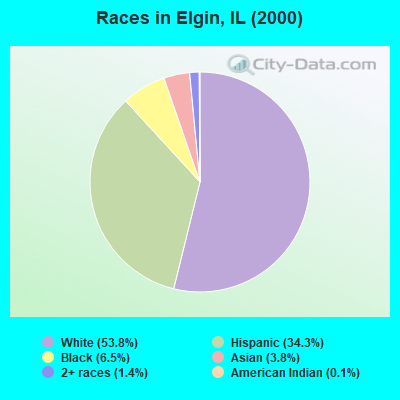
Race distribution in Elgin
2000 2022
50,831 53.8% White alone 32,430 34.3% Hispanic 6,100 6.5% Black alone 3,600 3.8% Asian alone 1,305 1.4% Two or more races 135 0.1% American Indian alone 72 0.08% Other race alone 14 0.01% Native Hawaiian and Other
47,924 43.7% Hispanic 43,861 40.0% White alone 8,163 7.4% Asian alone 5,748 5.2% Black alone 3,048 2.8% Two or more races 416 0.4% Other race alone 474 0.4% American Indian alone
2000 2022
8,424,140 67.8% White alone 1,856,152 14.9% Black alone 1,530,262 12.3% Hispanic 419,916 3.4% Asian alone 153,996 1.2% Two or more races 13,479 0.1% Other race alone 18,232 0.1% American Indian alone 3,116 0.03% Native Hawaiian and Other
7,356,301 58.5% White alone 2,299,726 18.3% Hispanic 1,660,423 13.2% Black alone 747,296 5.9% Asian alone 458,599 3.6% Two or more races 45,386 0.4% Other race alone 10,405 0.08% American Indian alone 3,896 0.03% Native Hawaiian and Other
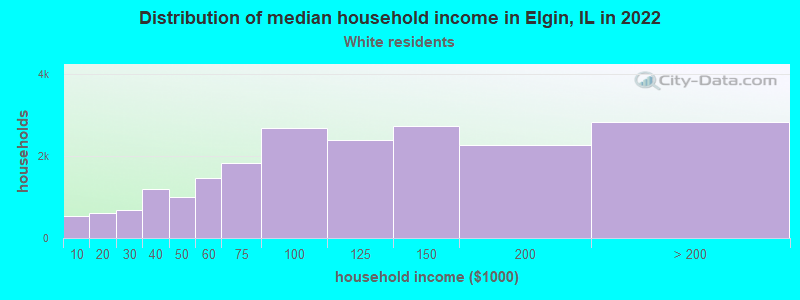
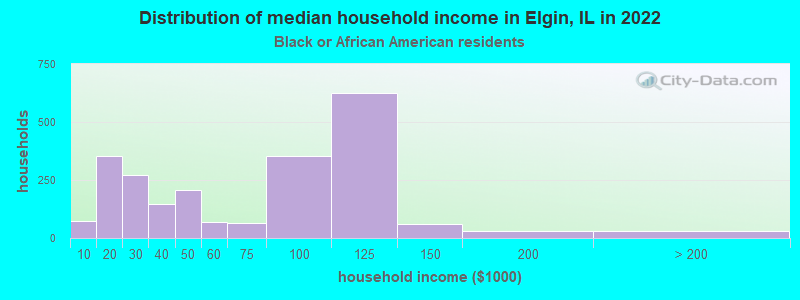
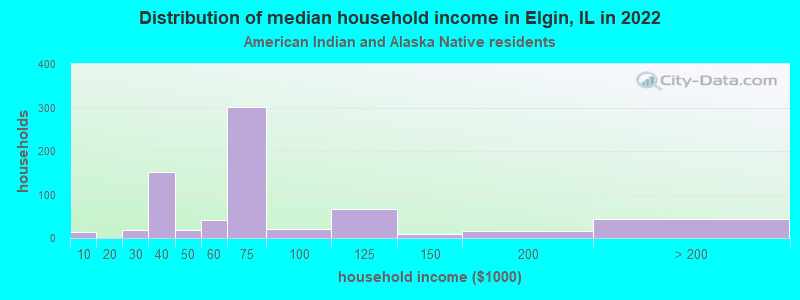
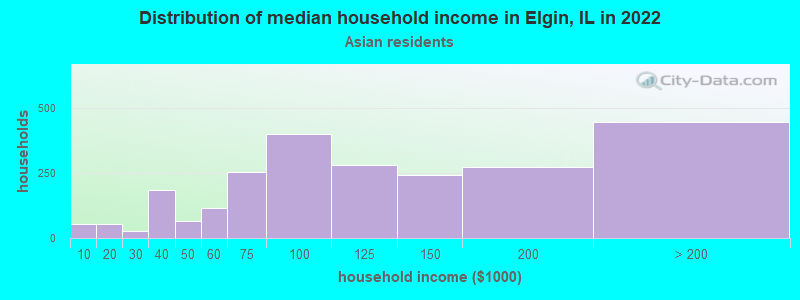
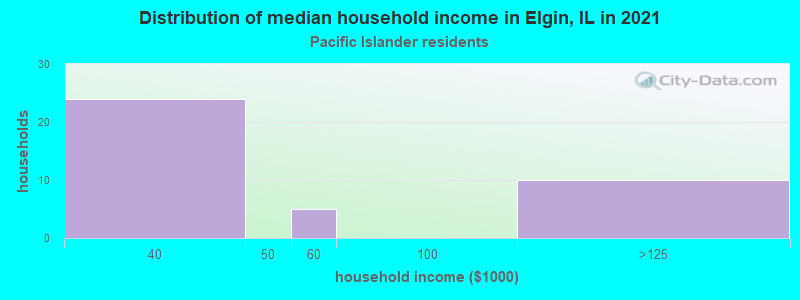
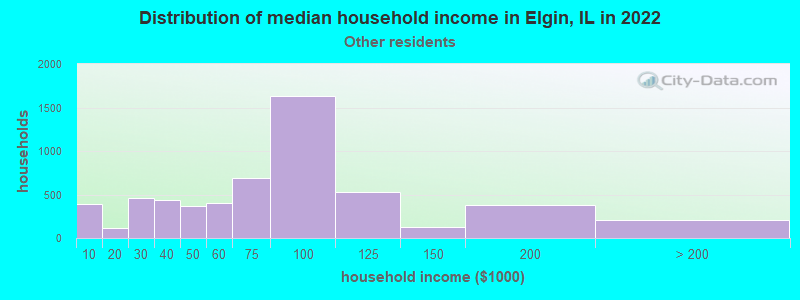
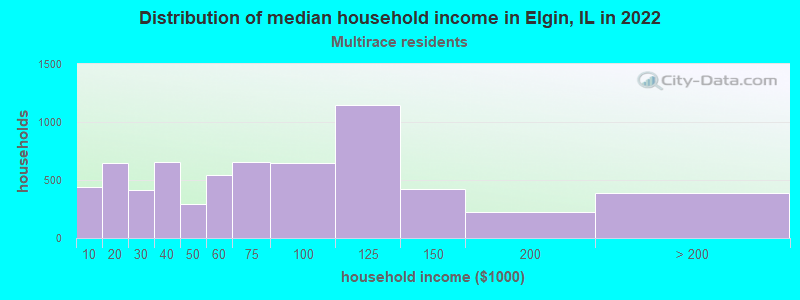
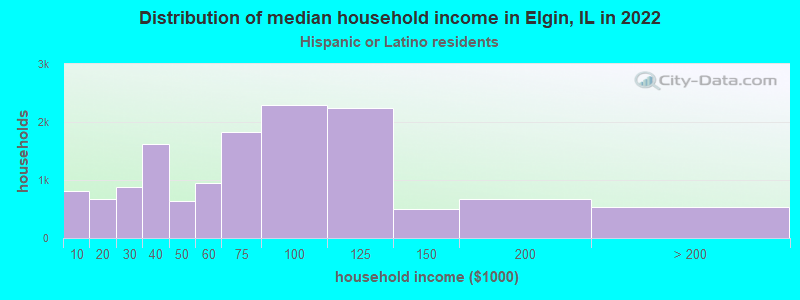
Income and house value in Elgin Median household income in 2022 $100,486 White non-Hispanic householders$64,439 Black householders$67,517 American Indian and Alaska Native householders$83,653 Asian householders$77,712 Some other race householders$67,215 Two or more races householders$70,903 Hispanic or Latino race householdersMedian 2022 house value $276,056 White Non-Hispanic householders$245,806 Black or African American householders$223,546 American Indian or Alaska Native householders $290,706 Asian householders$214,034 Native Hawaiian and other Pacific Islander householders$244,855 Some other race householders$250,182 Two or more races householders$244,474 Hispanic or Latino householders
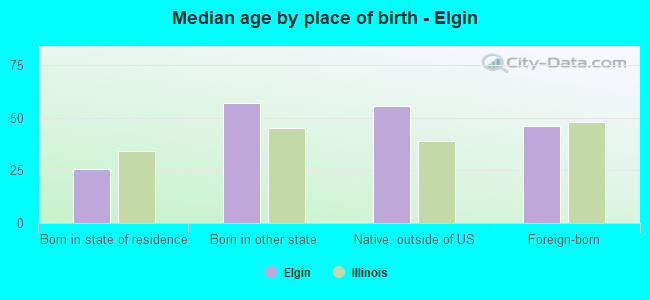
Median age by race in Elgin
47.9 Median age for White residents45.1 49.9 46.6 Median age for Black or African American residents38.9 46.8 27.7 Median age for American Indian / Alaska Native residents28.0 26.8 36.5 Median age for Asian residents36.4 36.7 29.8 Median age for Native Hawaiian / Pacific Islander residents29.2 -666,666,666.0 25.3 Median age for Other race residents29.8 21.8 27.7 Median age for Two or more races residents22.7 31.9 49.6 Median age for White alone residents47.5 50.6 26.5 Median age for Hispanic or Latino residents27.4 26.0
Owner/renter occupied households by race in Elgin
House owners and renters - White residents 17,421 86.2% Owner occupied2,800 13.8% Renter occupiedHouse owners and renters - Black or African American residents 1,179 53.5% Owner occupied1,026 46.5% Renter occupiedHouse owners and renters - American Indian / Alaska Native residents 680 56.6% Owner occupied522 43.4% Renter occupiedHouse owners and renters - Asian residents 1,738 73.9% Owner occupied613 26.1% Renter occupiedHouse owners and renters - Native Hawaiian / Pacific Islander residents 12 18.3% Owner occupied55 81.7% Renter occupiedHouse owners and renters - Other race residents 3,141 54.7% Owner occupied2,600 45.3% Renter occupiedHouse owners and renters - Two or more races residents 4,518 69.8% Owner occupied1,954 30.2% Renter occupiedHouse owners and renters - White alone residents 16,592 86.1% Owner occupied2,675 13.9% Renter occupiedHouse owners and renters - Hispanic or Latino residents 8,598 63.0% Owner occupied5,049 37.0% Renter occupied
Language usage in Elgin
English speakers - Total 55.6% of residents of Elgin speak English at home.
35.5% of residents speak Spanish at home 21,448 59.0% Speak English very well14,908 41.0% Speak English less than very well8.9% of residents speak other language at home 5,835 63.9% Speak English very well3,298 36.1% Speak English less than very well
English speakers - Born in the United States 89.2% of residents of Elgin speak English at home.
9.7% of residents speak Spanish at home 976 93.3% Speak English very well70 6.7% Speak English less than very well1.1% of residents speak other language at home 115 100.0% Speak English very well
English speakers - Native, born elsewhere 15.7% of residents of Elgin speak English at home.
65.7% of residents speak Spanish at home 993 59.2% Speak English very well683 40.8% Speak English less than very well18.5% of residents speak other language at home 267 56.4% Speak English very well206 43.6% Speak English less than very well
English speakers - Foreign-born 8.6% of residents of Elgin speak English at home.
67.6% of residents speak Spanish at home 5,904 32.8% Speak English very well12,086 67.2% Speak English less than very well23.8% of residents speak other language at home 4,040 63.8% Speak English very well2,292 36.2% Speak English less than very well
White (Caucasian) - Speak only English Native:
91.8% (38,704)Foreign-born:
24.6% (1,104)
White (Caucasian) - Speak another language Native:
8.2% (3,436)Foreign-born:
75.4% (3,391)
Black or African American - Speak only English Native:
97.7% (4,484)Foreign-born:
42.5% (84)
Black or African American - Speak another language Native:
2.2% (103)Foreign-born:
55.8% (111)
American Indian / Alaska Native - Speak only English Native:
4.9% (48)Foreign-born:
3.8% (39)
American Indian / Alaska Native - Speak another language Native:
97.9% (963)Foreign-born:
95.9% (978)
Asian - Speak only English Native:
47.9% (1,711)Foreign-born:
5.6% (249)
Asian - Speak another language Native:
52.1% (1,862)Foreign-born:
94.4% (4,181)
Native Hawaiian / Pacific Islander - Speak only English Native:
60.8% (45)Foreign-born:
23.4% (33)
Native Hawaiian / Pacific Islander - Speak another language Native:
33.3% (24)Foreign-born:
79.0% (111)
Other race - Speak only English Native:
21.4% (2,343)Foreign-born:
6.2% (508)
Other race - Speak another language Native:
78.6% (8,606)Foreign-born:
93.8% (7,669)
Two or more races - Speak only English Native:
53.9% (6,272)Foreign-born:
4.1% (299)
Two or more races - Speak another language Native:
46.1% (5,359)Foreign-born:
95.9% (7,027)
White alone - Speak only English Native:
95.1% (36,969)Foreign-born:
34.5% (1,104)
White alone - Speak another language Native:
4.9% (1,909)Foreign-born:
65.5% (2,100)
Hispanic or Latino - Speak only English Native:
30.4% (7,507)Foreign-born:
4.6% (861)
Hispanic or Latino - Speak another language Native:
69.6% (17,162)Foreign-born:
95.4% (17,875)
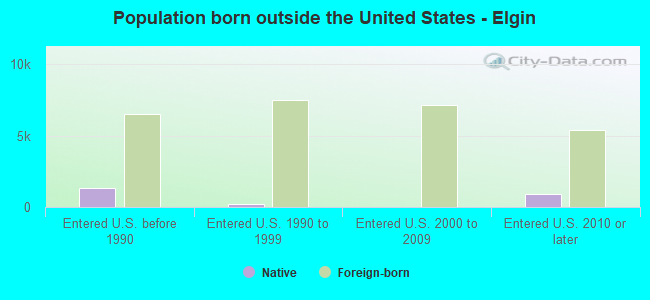
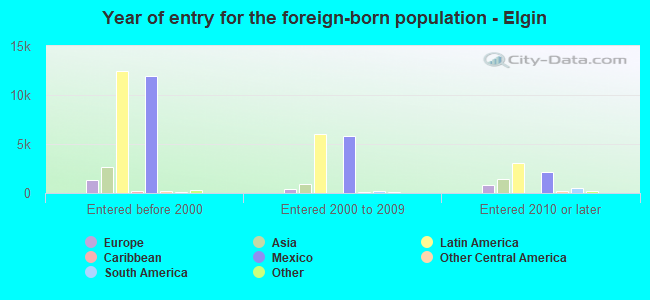
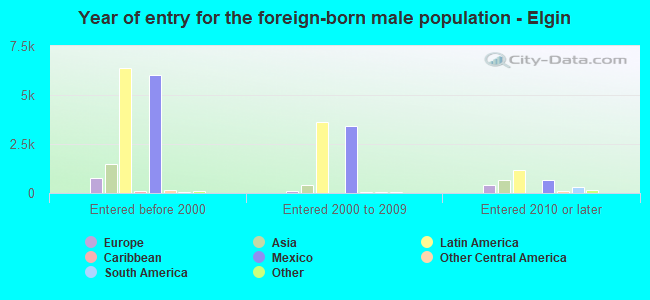
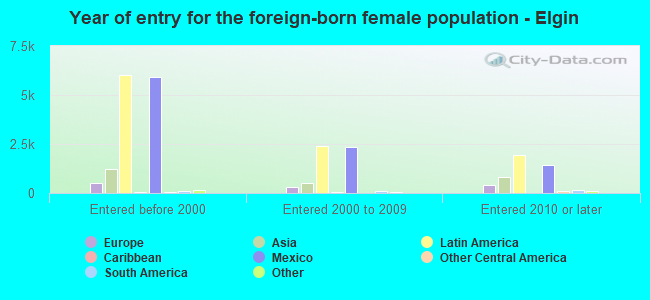
Foreign-born residents in Elgin 29,314 residents are foreign born (18.8% Latin America , 4.4% Asia ).
This city:
25.8%Illinois:
14.1%
Marital status for residents in Elgin Marital status - White (Caucasian) population 15 years and over
Males 32.1% Never married55.0% Now married1.5% Separated4.0% Widowed7.5% DivorcedFemales 24.0% Never married50.7% Now married1.6% Separated10.8% Widowed13.0% DivorcedWomen who gave birth in the past 12 months Now married:
82.6% (413)Unmarried:
17.4% (87)
Women who did not give birth in the past 12 months Now married:
46.0% (4,093)Unmarried:
54.0% (4,812)
Marital status - Black or African American population 15 years and over
Males 41.1% Never married23.0% Now married10.2% Separated21.2% Widowed4.5% DivorcedFemales 40.5% Never married45.2% Now married0.0% Separated4.5% Widowed9.8% DivorcedWomen who gave birth in the past 12 months Now married:
8.1% (8)Unmarried:
91.9% (87)
Women who did not give birth in the past 12 months Now married:
20.8% (191)Unmarried:
79.2% (726)
Marital status - American Indian / Alaska Native population 15 years and over
Males 44.3% Never married38.8% Now married5.2% Separated6.0% Widowed5.8% DivorcedFemales 36.1% Never married37.8% Now married3.4% Separated3.2% Widowed19.4% DivorcedWomen who gave birth in the past 12 months Now married:
67.6% (38)Unmarried:
32.4% (18)
Women who did not give birth in the past 12 months Now married:
32.6% (226)Unmarried:
67.4% (468)
Marital status - Asian population 15 years and over
Males 26.3% Never married67.5% Now married2.1% Separated1.3% Widowed2.8% DivorcedFemales 25.0% Never married60.5% Now married2.7% Separated4.7% Widowed7.0% DivorcedWomen who gave birth in the past 12 months Now married:
100.0% (99)Unmarried:
0.0% (0)
Women who did not give birth in the past 12 months Now married:
49.6% (947)Unmarried:
50.4% (960)
Marital status - Native Hawaiian / Pacific Islander population 15 years and over
Males 36.7% Never married62.0% Now married0.0% Separated1.3% Widowed0.0% DivorcedFemales 60.9% Never married37.7% Now married0.0% Separated0.0% Widowed1.4% DivorcedWomen who did not give birth in the past 12 months Now married:
31.1% (29)Unmarried:
68.9% (63)
Marital status - Other race population 15 years and over
Males 43.9% Never married41.8% Now married2.7% Separated1.8% Widowed9.8% DivorcedFemales 47.1% Never married40.2% Now married3.7% Separated2.2% Widowed6.7% DivorcedWomen who gave birth in the past 12 months Now married:
23.1% (171)Unmarried:
76.9% (569)
Women who did not give birth in the past 12 months Now married:
40.3% (1,915)Unmarried:
59.7% (2,842)
Marital status - Two or more races population 15 years and over
Males 48.0% Never married45.4% Now married1.0% Separated1.5% Widowed4.1% DivorcedFemales 45.7% Never married35.2% Now married1.3% Separated6.8% Widowed11.0% DivorcedWomen who gave birth in the past 12 months Now married:
65.9% (129)Unmarried:
34.1% (67)
Women who did not give birth in the past 12 months Now married:
40.0% (2,496)Unmarried:
60.0% (3,737)
Marital status - White alone, not Hispanic / Latino population 15 years and over
Males 29.5% Never married57.1% Now married1.1% Separated4.5% Widowed7.8% DivorcedFemales 23.4% Never married51.8% Now married1.7% Separated10.0% Widowed13.1% DivorcedWomen who gave birth in the past 12 months Now married:
100.0% (362)Unmarried:
0.0% (0)
Women who did not give birth in the past 12 months Now married:
45.4% (3,800)Unmarried:
54.6% (4,566)
Marital status - Hispanic or Latino population 15 years and over
Males 44.8% Never married44.0% Now married3.1% Separated1.1% Widowed7.0% DivorcedFemales 42.4% Never married38.6% Now married2.1% Separated6.1% Widowed10.7% DivorcedWomen who gave birth in the past 12 months Now married:
32.9% (322)Unmarried:
67.1% (656)
Women who did not give birth in the past 12 months Now married:
41.0% (4,751)Unmarried:
59.0% (6,847)
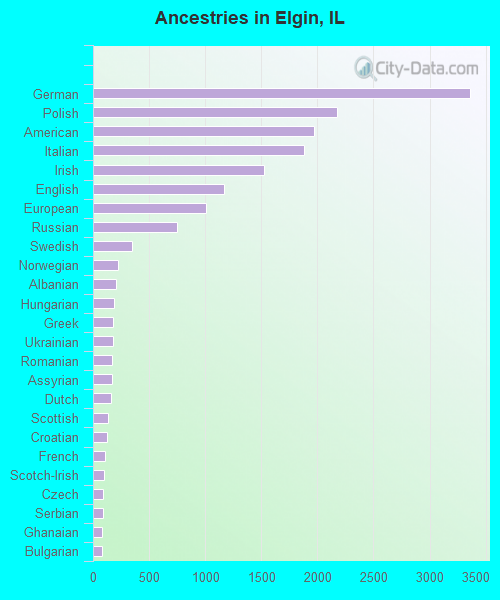
Ancestries in Elgin
3,362 5.3% German2,172 3.4% Polish1,971 3.1% American1,880 3.0% Italian1,522 2.4% Irish1,167 1.8% English1,010 1.6% European746 1.2% Russian345 0.5% Swedish219 0.3% Norwegian206 0.3% Albanian190 0.3% Hungarian182 0.3% Greek177 0.3% Ukrainian169 0.3% Romanian168 0.3% Assyrian157 0.2% Dutch135 0.2% Scottish127 0.2% Croatian103 0.2% French95 0.1% Scotch-Irish88 0.1% Czech87 0.1% Serbian80 0.1% Ghanaian76 0.1% Bulgarian65 0.1% Kenyan57 0.09% Welsh54 0.08% African53 0.08% Australian52 0.08% Danish47 0.07% Canadian43 0.07% Eastern European38 0.06% Jamaican35 0.06% Slovene34 0.05% Syrian33 0.05% Scandinavian30 0.05% Swiss27 0.04% Turkish26 0.04% French Canadian26 0.04% Lithuanian24 0.04% Nigerian24 0.04% Haitian19 0.03% Egyptian19 0.03% West Indian18 0.03% Belgian17 0.03% British16 0.03% Finnish15 0.02% Austrian13 0.02% Luxembourger13 0.02% Somali13 0.02% Trinidadian and Tobagonian13 0.02% Lebanese12 0.02% Yugoslavian9 0.01% Northern European8 0.01% Slovak7 0.01% Bahamian6 0.01% Czechoslovakian6 0.01% Barbadian4 0.01% U.S. Virgin Islander
Geographical mobility in Elgin Same house 1 year ago 41,311 86.5% White (Caucasian)4,451 85.1% Black or African American1,832 87.7% American Indian / Alaska Native7,066 93.0% Asian158 100.0% Native Hawaiian / Pacific Islander27,512 90.9% Other race17,206 83.5% Two or more races37,569 87.5% White alone, not Hispanic / Latino39,741 84.8% Hispanic or LatinoMoved within same county 2,943 6.2% White / Caucasian112 2.1% Black or African American152 7.3% American Indian / Alaska Native44 0.6% Asian1,645 5.4% Other race183 0.9% Two or more races1,964 4.6% White alone, not Hispanic / Latino2,738 5.8% Hispanic or LatinoMoved within same state 2,836 5.9% White / Caucasian694 13.3% Black or African American543 7.1% Asian1 0.7% Native Hawaiian / Pacific Islander816 2.7% Other race676 3.3% Two or more races2,753 6.4% White alone, not Hispanic / Latino1,555 3.3% Hispanic or LatinoMoved from different state 331 0.7% White / Caucasian37 0.7% Black or African American86 4.1% American Indian / Alaska Native21 0.3% Asian30 0.1% Other race765 3.7% Two or more races291 0.7% White alone, not Hispanic / Latino830 1.8% Hispanic or LatinoMoved from abroad 341 0.7% White15 0.7% American Indian / Alaska Native40 0.5% Asian119 0.4% Other race1,777 8.6% Two or more races341 0.8% White alone, not Hispanic / Latino2,023 4.3% Hispanic or Latino
Children Nativity (place of birth) in Elgin
Children under 6 years - Living with two parents Both parents native 2,443 100.0% NativeBoth parents foreign-born 1,116 92.9% Native85 7.1% Foreign-bornOne native, one foreign-born parent 679 100.0% NativeChildren under 6 years - Living with one parent Native parent 2,164 100.0% NativeForeign-born parent 778 100.0% NativeChildren 6 to 17 years - Living with two parents Both parents native 4,570 100.0% NativeBoth parents foreign-born 4,149 79.4% Native1,076 20.6% Foreign-bornOne native, one foreign-born parent 1,770 100.0% NativeChildren 6 to 17 years - Living with one parent Native parent 3,734 100.0% NativeForeign-born parent 2,487 50.0% Native2,487 50.0% Foreign-born
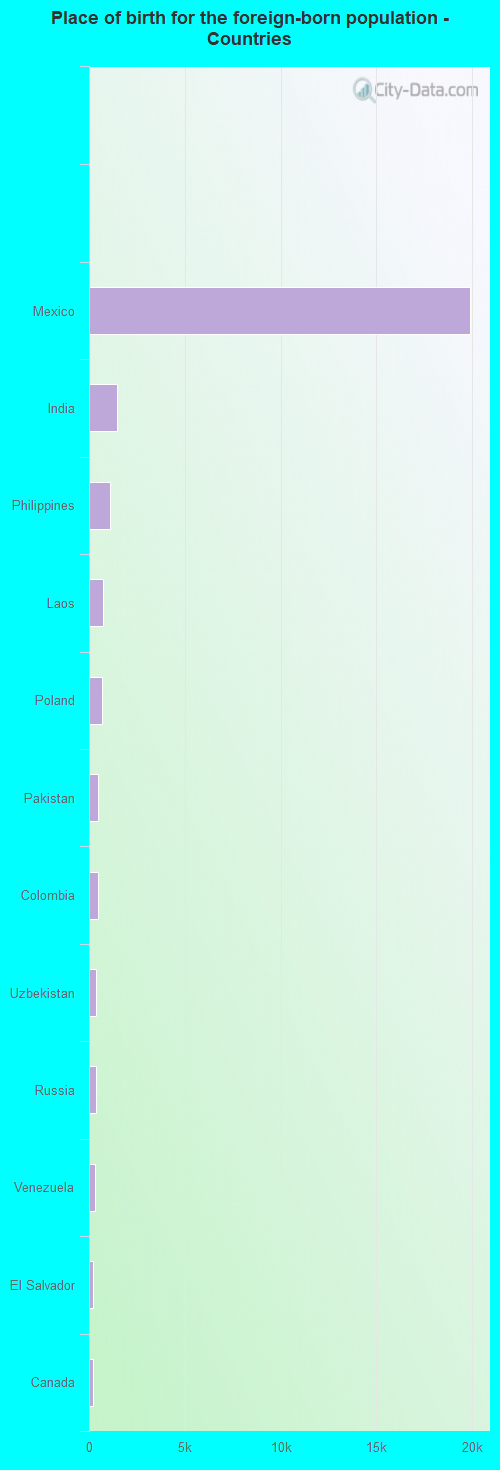
Place of birth for residents in Elgin 21,782 Americas21,570 Latin America20,479 Central America5,006 Asia2,347 South Central Asia2,119 Europe2,096 South Eastern Asia1,686 Eastern Europe946 South America360 Africa304 Eastern Asia211 Northern America190 Western Asia158 Western Africa157 Western Europe144 Caribbean139 Southern Europe98 China84 Northern Europe73 Middle Africa64 Eastern Africa55 Northern Africa46 Oceania46 Australia and New Zealand Subregion19,883 Mexico1,452 India1,120 Philippines722 Laos670 Poland486 Pakistan483 Colombia382 Uzbekistan340 Russia296 Venezuela230 El Salvador211 Canada174 Korea167 Guatemala151 Costa Rica133 Germany128 North Macedonia (Macedonia)128 Syria118 Vietnam111 Ukraine102 Romania88 Bosnia and Herzegovina85 Ghana75 China73 Cameroon73 Togo70 Bulgaria67 Italy66 Ecuador66 Thailand65 Greece60 Moldova55 Algeria47 England47 Croatia46 Australia45 Serbia42 Jamaica39 Honduras32 Japan31 Tanzania31 Bahamas31 Peru30 West Indies30 Burma (Myanmar)29 Turkey28 Brazil26 Iran25 Indonesia21 Argentina20 Kenya20 Chile17 France16 Hong Kong14 Malaysia14 Scotland13 Haiti13 Lithuania12 Sweden11 Trinidad and Tobago10 United Kingdom10 Somalia10 Barbados7 Taiwan7 Cuba7 Belize7 Netherlands7 Spain3 Ethiopia1 Ireland
Grandparents responsible for own grandchildren in Elgin
Grandparents (30 to 59 years) White / Caucasian 462 59.1% Responsible for grandchildren320 40.9% Not responsible for grandchildrenBlack or African American 83 73.9% Responsible for grandchildren29 26.1% Not responsible for grandchildrenAmerican Indian / Alaska Native 24 100.0% Not responsible for grandchildrenAsian 22 100.0% Not responsible for grandchildrenOther race 427 42.5% Responsible for grandchildren578 57.5% Not responsible for grandchildrenTwo or more races 35 14.2% Responsible for grandchildren209 85.8% Not responsible for grandchildrenWhite alone, not Hispanic / Latino 320 69.9% Responsible for grandchildren138 30.1% Not responsible for grandchildrenHispanic or Latino 361 32.8% Responsible for grandchildren738 67.2% Not responsible for grandchildrenGrandparents (60 years and over) White / Caucasian 265 31.8% Responsible for grandchildren569 68.2% Not responsible for grandchildrenBlack or African American 6 100.0% Responsible for grandchildrenAmerican Indian / Alaska Native 25 100.0% Not responsible for grandchildrenAsian 248 100.0% Not responsible for grandchildrenOther race 167 42.5% Responsible for grandchildren226 57.5% Not responsible for grandchildrenTwo or more races 77 16.2% Responsible for grandchildren398 83.8% Not responsible for grandchildrenWhite alone, not Hispanic / Latino 234 29.4% Responsible for grandchildren564 70.6% Not responsible for grandchildrenHispanic or Latino 53 22.4% Responsible for grandchildren184 77.6% Not responsible for grandchildren