Races in Elk Grove Village, Illinois (IL) Detailed Stats
Data:
Races - White alone (%)
Races - White alone (% change since 2000)
Races - Black alone (%)
Races - Black alone (% change since 2000)
Races - American Indian alone (%)
Races - American Indian alone (% change since 2000)
Races - Asian alone (%)
Races - Asian alone (% change since 2000)
Races - Hispanic (%)
Races - Hispanic (% change since 2000)
Races - Native Hawaiian and Other Pacific Islander alone (%)
Races - Native Hawaiian and Other Pacific Islander alone (% change since 2000)
Races - Two or more races(%)
Races - Two or more races(% change since 2000)
Races - Other race alone (%)
Races - Other race alone (% change since 2000)
Racial diversity
Place of birth - Born in state of residence (%)
Place of birth - Born in state of residence (%) - White
Place of birth - Born in state of residence (%) - Black or African American
Place of birth - Born in state of residence (%) - Asian
Place of birth - Born in state of residence (%) - Hispanic or Latino
Place of birth - Born in state of residence (%) - American Indian and Alaska Native
Place of birth - Born in state of residence (%) - Multirace
Place of birth - Born in state of residence (%) - Other Race
Place of birth - Born in other state (%)
Place of birth - Born in other state (%) - White
Place of birth - Born in other state (%) - Black or African American
Place of birth - Born in other state (%) - Asian
Place of birth - Born in other state (%) - Hispanic or Latino
Place of birth - Born in other state (%) - American Indian and Alaska Native
Place of birth - Born in other state (%) - Multirace
Place of birth - Born in other state (%) - Other Race
Place of birth - Native, outside of US (%)
Place of birth - Native, outside of US (%) - White
Place of birth - Native, outside of US (%) - Black or African American
Place of birth - Native, outside of US (%) - Asian
Place of birth - Native, outside of US (%) - Hispanic or Latino
Place of birth - Native, outside of US (%) - American Indian and Alaska Native
Place of birth - Native, outside of US (%) - Multirace
Place of birth - Native, outside of US (%) - Other Race
Place of birth - Foreign born (%)
Place of birth - Foreign born (%) - White
Place of birth - Foreign born (%) - Black or African American
Place of birth - Foreign born (%) - Asian
Place of birth - Foreign born (%) - Hispanic or Latino
Place of birth - Foreign born (%) - American Indian and Alaska Native
Place of birth - Foreign born (%) - Multirace
Place of birth - Foreign born (%) - Other Race
Residents speaking English at home (%)
Residents speaking English at home - Born in the United States (%)
Residents speaking English at home - Native, born elsewhere (%)
Residents speaking English at home - Foreign born (%)
Residents speaking Spanish at home (%)
Residents speaking Spanish at home - Born in the United States (%)
Residents speaking Spanish at home - Native, born elsewhere (%)
Residents speaking Spanish at home - Foreign born (%)
Residents speaking other language at home (%)
Residents speaking other language at home - Born in the United States (%)
Residents speaking other language at home - Native, born elsewhere (%)
Residents speaking other language at home - Foreign born (%)
Marital status - Never married (%)
Marital status - Now married (%)
Marital status - Separated (%)
Marital status - Widowed (%)
Marital status - Divorced (%)
Ancestries Reported - Arab (%)
Ancestries Reported - Czech (%)
Ancestries Reported - Danish (%)
Ancestries Reported - Dutch (%)
Ancestries Reported - English (%)
Ancestries Reported - French (%)
Ancestries Reported - French Canadian (%)
Ancestries Reported - German (%)
Ancestries Reported - Greek (%)
Ancestries Reported - Hungarian (%)
Ancestries Reported - Irish (%)
Ancestries Reported - Italian (%)
Ancestries Reported - Lithuanian (%)
Ancestries Reported - Norwegian (%)
Ancestries Reported - Polish (%)
Ancestries Reported - Portuguese (%)
Ancestries Reported - Russian (%)
Ancestries Reported - Scotch-Irish (%)
Ancestries Reported - Scottish (%)
Ancestries Reported - Slovak (%)
Ancestries Reported - Subsaharan African (%)
Ancestries Reported - Swedish (%)
Ancestries Reported - Swiss (%)
Ancestries Reported - Ukrainian (%)
Ancestries Reported - United States (%)
Ancestries Reported - Welsh (%)
Ancestries Reported - West Indian (%)
Ancestries Reported - Other (%)
Geographical mobility - Same house 1 year ago (%)
Geographical mobility - Same house 1 year ago (%) - White
Geographical mobility - Same house 1 year ago (%) - Black or African American
Geographical mobility - Same house 1 year ago (%) - Asian
Geographical mobility - Same house 1 year ago (%) - Hispanic or Latino
Geographical mobility - Same house 1 year ago (%) - American Indian and Alaska Native
Geographical mobility - Same house 1 year ago (%) - Multirace
Geographical mobility - Same house 1 year ago (%) - Other Race
Geographical mobility - Moved within same county (%)
Geographical mobility - Moved within same county (%) - White
Geographical mobility - Moved within same county (%) - Black or African American
Geographical mobility - Moved within same county (%) - Asian
Geographical mobility - Moved within same county (%) - Hispanic or Latino
Geographical mobility - Moved within same county (%) - American Indian and Alaska Native
Geographical mobility - Moved within same county (%) - Multirace
Geographical mobility - Moved within same county (%) - Other Race
Geographical mobility - Moved from different county within same state (%)
Geographical mobility - Moved from different county within same state (%) - White
Geographical mobility - Moved from different county within same state (%) - Black or African American
Geographical mobility - Moved from different county within same state (%) - Asian
Geographical mobility - Moved from different county within same state (%) - Hispanic or Latino
Geographical mobility - Moved from different county within same state (%) - American Indian and Alaska Native
Geographical mobility - Moved from different county within same state (%) - Multirace
Geographical mobility - Moved from different county within same state (%) - Other Race
Geographical mobility - Moved from different state (%)
Geographical mobility - Moved from different state (%) - White
Geographical mobility - Moved from different state (%) - Black or African American
Geographical mobility - Moved from different state (%) - Asian
Geographical mobility - Moved from different state (%) - Hispanic or Latino
Geographical mobility - Moved from different state (%) - American Indian and Alaska Native
Geographical mobility - Moved from different state (%) - Multirace
Geographical mobility - Moved from different state (%) - Other Race
Geographical mobility - Moved from abroad (%)
Geographical mobility - Moved from abroad (%) - White
Geographical mobility - Moved from abroad (%) - Black or African American
Geographical mobility - Moved from abroad (%) - Asian
Geographical mobility - Moved from abroad (%) - Hispanic or Latino
Geographical mobility - Moved from abroad (%) - American Indian and Alaska Native
Geographical mobility - Moved from abroad (%) - Multirace
Geographical mobility - Moved from abroad (%) - Other Race
Place of birth for the foreign-born population - Ireland (%)
Place of birth for the foreign-born population - Denmark (%)
Place of birth for the foreign-born population - Norway (%)
Place of birth for the foreign-born population - Sweden (%)
Place of birth for the foreign-born population - United Kingdom (%)
Place of birth for the foreign-born population - England (%)
Place of birth for the foreign-born population - Scotland (%)
Place of birth for the foreign-born population - Other Northern Europe (%)
Place of birth for the foreign-born population - Austria (%)
Place of birth for the foreign-born population - Belgium (%)
Place of birth for the foreign-born population - France (%)
Place of birth for the foreign-born population - Germany (%)
Place of birth for the foreign-born population - Netherlands (%)
Place of birth for the foreign-born population - Switzerland (%)
Place of birth for the foreign-born population - Other Western Europe (%)
Place of birth for the foreign-born population - Greece (%)
Place of birth for the foreign-born population - Italy (%)
Place of birth for the foreign-born population - Portugal (%)
Place of birth for the foreign-born population - Spain (%)
Place of birth for the foreign-born population - Other Southern Europe (%)
Place of birth for the foreign-born population - Albania (%)
Place of birth for the foreign-born population - Belarus (%)
Place of birth for the foreign-born population - Bosnia and Herzegovina (%)
Place of birth for the foreign-born population - Bulgaria (%)
Place of birth for the foreign-born population - Croatia (%)
Place of birth for the foreign-born population - Czechoslovakia (%)
Place of birth for the foreign-born population - Hungary (%)
Place of birth for the foreign-born population - Latvia (%)
Place of birth for the foreign-born population - Lithuania (%)
Place of birth for the foreign-born population - North Macedonia (Macedonia) (%)
Place of birth for the foreign-born population - Moldova (%)
Place of birth for the foreign-born population - Poland (%)
Place of birth for the foreign-born population - Romania (%)
Place of birth for the foreign-born population - Russia (%)
Place of birth for the foreign-born population - Serbia (%)
Place of birth for the foreign-born population - Ukraine (%)
Place of birth for the foreign-born population - Other Eastern Europe (%)
Place of birth for the foreign-born population - China (%)
Place of birth for the foreign-born population - Hong Kong (%)
Place of birth for the foreign-born population - Taiwan (%)
Place of birth for the foreign-born population - Japan (%)
Place of birth for the foreign-born population - Korea (%)
Place of birth for the foreign-born population - Other Eastern Asia (%)
Place of birth for the foreign-born population - Afghanistan (%)
Place of birth for the foreign-born population - Bangladesh (%)
Place of birth for the foreign-born population - India (%)
Place of birth for the foreign-born population - Iran (%)
Place of birth for the foreign-born population - Kazakhstan (%)
Place of birth for the foreign-born population - Nepal (%)
Place of birth for the foreign-born population - Pakistan (%)
Place of birth for the foreign-born population - Sri Lanka (%)
Place of birth for the foreign-born population - Uzbekistan (%)
Place of birth for the foreign-born population - Other South Central Asia (%)
Place of birth for the foreign-born population - Burma (%)
Place of birth for the foreign-born population - Cambodia (%)
Place of birth for the foreign-born population - Indonesia (%)
Place of birth for the foreign-born population - Laos (%)
Place of birth for the foreign-born population - Malaysia (%)
Place of birth for the foreign-born population - Philippines (%)
Place of birth for the foreign-born population - Singapore (%)
Place of birth for the foreign-born population - Thailand (%)
Place of birth for the foreign-born population - Vietnam (%)
Place of birth for the foreign-born population - Other South Eastern Asia (%)
Place of birth for the foreign-born population - Armenia (%)
Place of birth for the foreign-born population - Iraq (%)
Place of birth for the foreign-born population - Israel (%)
Place of birth for the foreign-born population - Jordan (%)
Place of birth for the foreign-born population - Kuwait (%)
Place of birth for the foreign-born population - Lebanon (%)
Place of birth for the foreign-born population - Saudi Arabia (%)
Place of birth for the foreign-born population - Syria (%)
Place of birth for the foreign-born population - Turkey (%)
Place of birth for the foreign-born population - Yemen (%)
Place of birth for the foreign-born population - Other Western Asia (%)
Place of birth for the foreign-born population - Eritrea (%)
Place of birth for the foreign-born population - Ethiopia (%)
Place of birth for the foreign-born population - Kenya (%)
Place of birth for the foreign-born population - Somalia (%)
Place of birth for the foreign-born population - Uganda (%)
Place of birth for the foreign-born population - Zimbabwe (%)
Place of birth for the foreign-born population - Other Eastern Africa (%)
Place of birth for the foreign-born population - Cameroon (%)
Place of birth for the foreign-born population - Congo (%)
Place of birth for the foreign-born population - Democratic Republic of Congo (Zaire) (%)
Place of birth for the foreign-born population - Other Middle Africa (%)
Place of birth for the foreign-born population - Egypt (%)
Place of birth for the foreign-born population - Morocco (%)
Place of birth for the foreign-born population - Sudan (%)
Place of birth for the foreign-born population - Other Northern Africa (%)
Place of birth for the foreign-born population - South Africa (%)
Place of birth for the foreign-born population - Other Southern Africa (%)
Place of birth for the foreign-born population - Cabo Verde (%)
Place of birth for the foreign-born population - Ghana (%)
Place of birth for the foreign-born population - Liberia (%)
Place of birth for the foreign-born population - Nigeria (%)
Place of birth for the foreign-born population - Senegal (%)
Place of birth for the foreign-born population - Sierra Leone (%)
Place of birth for the foreign-born population - Other Western Africa (%)
Place of birth for the foreign-born population - Australia (%)
Place of birth for the foreign-born population - New Zealand (%)
Place of birth for the foreign-born population - Fiji (%)
Place of birth for the foreign-born population - Micronesia (%)
Place of birth for the foreign-born population - Bahamas (%)
Place of birth for the foreign-born population - Barbados (%)
Place of birth for the foreign-born population - Cuba (%)
Place of birth for the foreign-born population - Dominica (%)
Place of birth for the foreign-born population - Dominican Republic (%)
Place of birth for the foreign-born population - Grenada (%)
Place of birth for the foreign-born population - Haiti (%)
Place of birth for the foreign-born population - Jamaica (%)
Place of birth for the foreign-born population - St. Vincent and the Grenadines (%)
Place of birth for the foreign-born population - Trinidad and Tobago (%)
Place of birth for the foreign-born population - West Indies (%)
Place of birth for the foreign-born population - Other Caribbean (%)
Place of birth for the foreign-born population - Belize (%)
Place of birth for the foreign-born population - Costa Rica (%)
Place of birth for the foreign-born population - El Salvador (%)
Place of birth for the foreign-born population - Guatemala (%)
Place of birth for the foreign-born population - Honduras (%)
Place of birth for the foreign-born population - Mexico (%)
Place of birth for the foreign-born population - Nicaragua (%)
Place of birth for the foreign-born population - Panama (%)
Place of birth for the foreign-born population - Other Central America (%)
Place of birth for the foreign-born population - Argentina (%)
Place of birth for the foreign-born population - Bolivia (%)
Place of birth for the foreign-born population - Brazil (%)
Place of birth for the foreign-born population - Chile (%)
Place of birth for the foreign-born population - Colombia (%)
Place of birth for the foreign-born population - Ecuador (%)
Place of birth for the foreign-born population - Guyana (%)
Place of birth for the foreign-born population - Peru (%)
Place of birth for the foreign-born population - Uruguay (%)
Place of birth for the foreign-born population - Venezuela (%)
Place of birth for the foreign-born population - Other South America (%)
Place of birth for the foreign-born population - Canada (%)
Place of birth for the foreign-born population - Other Northern America (%)
Place of birth for the foreign-born population - Other (%)
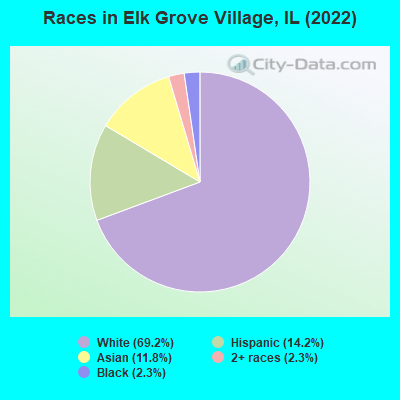
According to 2022 data, the most numerous races in Elk Grove Village, IL are White alone (21,988 residents), Hispanic (4,524 residents), and Black alone (724 residents). 67.2% of Elk Grove Village residents speak English at home. 22.4% of Elk Grove Village, IL residents are foreign-born (9.2% born in Europe, 8.2% born in Asia, 4.4% born in Latin America), which is 37.4% greater than the foreign-born rate of 14.0% across the entire state of Illinois.
Race distribution in Elk Grove Village
2000 2022
8,424,140 67.8% White alone 1,856,152 14.9% Black alone 1,530,262 12.3% Hispanic 419,916 3.4% Asian alone 153,996 1.2% Two or more races 13,479 0.1% Other race alone 18,232 0.1% American Indian alone 3,116 0.03% Native Hawaiian and Other
7,356,301 58.5% White alone 2,299,726 18.3% Hispanic 1,660,423 13.2% Black alone 747,296 5.9% Asian alone 458,599 3.6% Two or more races 45,386 0.4% Other race alone 10,405 0.08% American Indian alone 3,896 0.03% Native Hawaiian and Other
Income and house value in Elk Grove Village Median household income in 2022 $93,898 White non-Hispanic householders$54,949 Black householders$97,256 Asian householders$81,137 Two or more races householders$90,843 Hispanic or Latino race householdersMedian 2022 house value $347,409 White Non-Hispanic householders$316,610 Black or African American householders $361,709 Asian householders$323,943 Some other race householders$360,976 Two or more races householders$310,743 Hispanic or Latino householders
Median age by race in Elk Grove Village
47.8 Median age for White residents47.5 48.1 36.1 Median age for Black or African American residents34.7 42.5 35.9 Median age for American Indian / Alaska Native residents35.3 34.2 43.1 Median age for Asian residents42.5 44.4 -687,999,999.3 Median age for Native Hawaiian / Pacific Islander residents-918,721,460.3 -610,229,276.3 39.7 Median age for Other race residents19.7 41.7 22.0 Median age for Two or more races residents20.4 25.7 47.4 Median age for White alone residents47.7 47.2 26.8 Median age for Hispanic or Latino residents21.4 32.2
Owner/renter occupied households by race in Elk Grove Village
House owners and renters - White residents 7,412 77.1% Owner occupied2,200 22.9% Renter occupiedHouse owners and renters - Black or African American residents 46 14.3% Owner occupied279 85.7% Renter occupiedHouse owners and renters - American Indian / Alaska Native residents 56 100.0% Owner occupiedHouse owners and renters - Asian residents 1,062 83.4% Owner occupied211 16.6% Renter occupiedHouse owners and renters - Other race residents 212 64.7% Owner occupied116 35.3% Renter occupiedHouse owners and renters - Two or more races residents 450 54.3% Owner occupied379 45.7% Renter occupiedHouse owners and renters - White alone residents 7,636 77.9% Owner occupied2,161 22.1% Renter occupiedHouse owners and renters - Hispanic or Latino residents 655 53.6% Owner occupied566 46.4% Renter occupied
Language usage in Elk Grove Village
English speakers - Total 67.2% of residents of Elk Grove Village speak English at home.
9.0% of residents speak Spanish at home 2,105 77.0% Speak English very well627 23.0% Speak English less than very well23.8% of residents speak other language at home 4,862 67.7% Speak English very well2,323 32.3% Speak English less than very well
English speakers - Born in the United States 84.9% of residents of Elk Grove Village speak English at home.
5.4% of residents speak Spanish at home 97 80.8% Speak English very well23 19.2% Speak English less than very well10.5% of residents speak other language at home 222 94.9% Speak English very well12 5.1% Speak English less than very well
English speakers - Native, born elsewhere 34.8% of residents of Elk Grove Village speak English at home.
33.8% of residents speak Spanish at home 135 100.0% Speak English very well33.3% of residents speak other language at home 74 55.6% Speak English very well59 44.4% Speak English less than very well
English speakers - Foreign-born 7.8% of residents of Elk Grove Village speak English at home.
19.3% of residents speak Spanish at home 793 58.0% Speak English very well575 42.0% Speak English less than very well72.8% of residents speak other language at home 3,061 59.3% Speak English very well2,104 40.7% Speak English less than very well
White (Caucasian) - Speak only English Native:
94.9% (16,660)Foreign-born:
11.0% (298)
White (Caucasian) - Speak another language Native:
6.9% (1,210)Foreign-born:
88.8% (2,418)
American Indian / Alaska Native - Speak another language Native:
100.0% (24)Foreign-born:
65.7% (77)
Asian - Speak only English Native:
50.5% (543)Foreign-born:
6.6% (166)
Asian - Speak another language Native:
49.5% (533)Foreign-born:
94.1% (2,377)
Other race - Speak only English Native:
37.8% (263)Foreign-born:
0.3% (1)
Other race - Speak another language Native:
63.4% (441)Foreign-born:
100.0% (323)
Two or more races - Speak only English Native:
59.2% (1,291)Foreign-born:
2.2% (22)
Two or more races - Speak another language Native:
40.2% (878)Foreign-born:
97.8% (952)
White alone - Speak only English Native:
91.4% (16,484)Foreign-born:
9.8% (306)
White alone - Speak another language Native:
8.6% (1,548)Foreign-born:
90.8% (2,817)
Hispanic or Latino - Speak only English Native:
52.9% (1,421)Foreign-born:
4.2% (60)
Hispanic or Latino - Speak another language Native:
48.4% (1,301)Foreign-born:
95.8% (1,373)
Foreign-born residents in Elk Grove Village 7,107 residents are foreign born (9.2% Europe , 8.2% Asia , 4.4% Latin America ).
This city:
22.4%Illinois:
14.1%
Marital status for residents in Elk Grove Village Marital status - White (Caucasian) population 15 years and over
Males 26.6% Never married60.9% Now married1.1% Separated3.0% Widowed8.4% DivorcedFemales 23.7% Never married53.3% Now married1.8% Separated8.3% Widowed12.9% DivorcedWomen who gave birth in the past 12 months Now married:
79.3% (182)Unmarried:
20.7% (47)
Women who did not give birth in the past 12 months Now married:
48.8% (2,037)Unmarried:
51.2% (2,137)
Marital status - Black or African American population 15 years and over
Males 69.4% Never married29.1% Now married0.0% Separated0.0% Widowed1.6% DivorcedFemales 58.2% Never married18.0% Now married0.0% Separated2.5% Widowed21.3% DivorcedWomen who did not give birth in the past 12 months Now married:
10.7% (30)Unmarried:
89.3% (252)
Marital status - American Indian / Alaska Native population 15 years and over
Males 20.7% Never married79.3% Now married0.0% Separated0.0% Widowed0.0% DivorcedFemales 29.2% Never married70.8% Now married0.0% Separated0.0% Widowed0.0% DivorcedWomen who did not give birth in the past 12 months Now married:
61.1% (20)Unmarried:
38.9% (13)
Marital status - Asian population 15 years and over
Males 21.6% Never married74.2% Now married0.6% Separated1.0% Widowed2.6% DivorcedFemales 13.3% Never married72.3% Now married1.3% Separated10.7% Widowed2.4% DivorcedWomen who gave birth in the past 12 months Now married:
100.0% (38)Unmarried:
0.0% (0)
Women who did not give birth in the past 12 months Now married:
74.2% (516)Unmarried:
25.8% (180)
Marital status - Other race population 15 years and over
Males 57.1% Never married42.9% Now married0.0% Separated0.0% Widowed0.0% DivorcedFemales 70.2% Never married25.4% Now married0.0% Separated0.0% Widowed4.4% DivorcedWomen who gave birth in the past 12 months Now married:
0.0% (0)Unmarried:
100.0% (16)
Women who did not give birth in the past 12 months Now married:
5.0% (16)Unmarried:
95.0% (300)
Marital status - Two or more races population 15 years and over
Males 44.4% Never married47.6% Now married0.0% Separated0.0% Widowed8.0% DivorcedFemales 40.1% Never married42.5% Now married7.3% Separated0.8% Widowed9.4% DivorcedWomen who gave birth in the past 12 months Now married:
100.0% (31)Unmarried:
0.0% (0)
Women who did not give birth in the past 12 months Now married:
47.4% (309)Unmarried:
52.6% (343)
Marital status - White alone, not Hispanic / Latino population 15 years and over
Males 25.9% Never married61.8% Now married1.2% Separated2.9% Widowed8.1% DivorcedFemales 22.9% Never married54.1% Now married1.9% Separated8.7% Widowed12.3% DivorcedWomen who gave birth in the past 12 months Now married:
76.4% (172)Unmarried:
23.6% (53)
Women who did not give birth in the past 12 months Now married:
50.2% (2,126)Unmarried:
49.8% (2,113)
Marital status - Hispanic or Latino population 15 years and over
Males 44.3% Never married47.0% Now married0.0% Separated1.2% Widowed7.6% DivorcedFemales 46.0% Never married38.8% Now married2.9% Separated0.6% Widowed11.6% DivorcedWomen who gave birth in the past 12 months Now married:
100.0% (56)Unmarried:
0.0% (0)
Women who did not give birth in the past 12 months Now married:
33.1% (381)Unmarried:
66.9% (770)
Ancestries in Elk Grove Village
2,540 14.7% Polish2,013 11.6% German1,225 7.1% Italian1,013 5.8% Irish654 3.8% Bulgarian409 2.4% American391 2.3% European291 1.7% Romanian284 1.6% Serbian251 1.4% Ukrainian211 1.2% Croatian189 1.1% Lebanese151 0.9% English119 0.7% Norwegian118 0.7% Iranian116 0.7% Swedish108 0.6% Slavic102 0.6% Greek95 0.5% Albanian95 0.5% Palestinian74 0.4% Russian70 0.4% Czech67 0.4% French67 0.4% Yugoslavian59 0.3% African54 0.3% Dutch33 0.2% Scotch-Irish33 0.2% Turkish30 0.2% Czechoslovakian24 0.1% Haitian23 0.1% Belizean20 0.1% British18 0.1% Lithuanian18 0.1% Slovak17 0.10% Eastern European17 0.10% Assyrian16 0.09% Armenian15 0.09% Canadian13 0.08% Scottish12 0.07% Hungarian12 0.07% Latvian11 0.06% French Canadian9 0.05% Danish8 0.05% Slovene8 0.05% Welsh
Geographical mobility in Elk Grove Village Same house 1 year ago 19,007 90.8% White (Caucasian)605 83.5% Black or African American127 93.9% American Indian / Alaska Native3,016 82.3% Asian707 66.9% Other race3,157 91.9% Two or more races20,007 91.6% White alone, not Hispanic / Latino3,828 86.3% Hispanic or LatinoMoved within same county 1,298 6.2% White / Caucasian86 11.9% Black or African American8 5.6% American Indian / Alaska Native363 9.9% Asian284 26.9% Other race145 4.2% Two or more races1,217 5.6% White alone, not Hispanic / Latino543 12.2% Hispanic or LatinoMoved within same state 306 1.5% White / Caucasian7 0.9% Black or African American166 4.5% Asian24 2.3% Other race77 2.3% Two or more races312 1.4% White alone, not Hispanic / Latino10 0.2% Hispanic or LatinoMoved from different state 72 0.3% White / Caucasian23 3.1% Black or African American19 0.5% Asian68 0.3% White alone, not Hispanic / Latino7 0.2% Hispanic or LatinoMoved from abroad 121 0.6% White75 2.1% Asian132 0.6% White alone, not Hispanic / Latino
Children Nativity (place of birth) in Elk Grove Village
Children under 6 years - Living with two parents Both parents native 787 100.0% NativeBoth parents foreign-born 319 100.0% NativeOne native, one foreign-born parent 170 100.0% NativeChildren under 6 years - Living with one parent Native parent 478 100.0% NativeForeign-born parent 17 22.0% Native60 78.0% Foreign-bornChildren 6 to 17 years - Living with two parents Both parents native 2,056 100.0% NativeBoth parents foreign-born 892 77.6% Native257 22.4% Foreign-bornOne native, one foreign-born parent 442 100.0% NativeChildren 6 to 17 years - Living with one parent Native parent 869 100.0% NativeForeign-born parent 226 50.1% Native225 49.9% Foreign-born
Place of birth for residents in Elk Grove Village 2,975 Europe2,650 Eastern Europe2,644 Asia1,476 Americas1,435 Latin America1,203 Central America1,171 South Central Asia704 South Eastern Asia638 Eastern Asia230 South America191 Southern Europe170 China115 Western Asia106 Northern Europe40 Northern America26 Western Europe11 Africa7 Eastern Africa3 Northern Africa1,166 Poland1,064 India1,013 Mexico770 Bulgaria662 Philippines229 Korea192 Colombia158 Japan152 China137 Ukraine124 Croatia123 Italy122 Romania107 Iran80 Serbia75 Bosnia and Herzegovina71 Panama68 Greece56 Moldova40 Canada40 Czechoslovakia39 Nicaragua38 Kuwait38 Guatemala30 Ireland27 England26 Vietnam26 Belize22 Russia22 Peru21 Albania20 Turkey18 United Kingdom18 Germany16 Armenia14 Denmark14 Ecuador13 Scotland13 North Macedonia (Macedonia)13 Jordan13 Lebanon12 Honduras10 Hong Kong10 Iraq7 Taiwan7 Cambodia7 Malaysia7 Latvia7 Netherlands3 Egypt
Grandparents responsible for own grandchildren in Elk Grove Village
Grandparents (30 to 59 years) White / Caucasian 14 38.7% Responsible for grandchildren22 61.3% Not responsible for grandchildrenAsian 45 100.0% Not responsible for grandchildrenTwo or more races 87 100.0% Not responsible for grandchildrenWhite alone, not Hispanic / Latino 18 49.5% Responsible for grandchildren19 50.5% Not responsible for grandchildrenHispanic or Latino 62 100.0% Not responsible for grandchildrenGrandparents (60 years and over) White / Caucasian 26 13.3% Responsible for grandchildren171 86.7% Not responsible for grandchildrenAsian 190 100.0% Not responsible for grandchildrenWhite alone, not Hispanic / Latino 32 12.7% Responsible for grandchildren220 87.3% Not responsible for grandchildren