Races in Elkhart, Indiana (IN) Detailed Stats
Data:
Races - White alone (%)
Races - White alone (% change since 2000)
Races - Black alone (%)
Races - Black alone (% change since 2000)
Races - American Indian alone (%)
Races - American Indian alone (% change since 2000)
Races - Asian alone (%)
Races - Asian alone (% change since 2000)
Races - Hispanic (%)
Races - Hispanic (% change since 2000)
Races - Native Hawaiian and Other Pacific Islander alone (%)
Races - Native Hawaiian and Other Pacific Islander alone (% change since 2000)
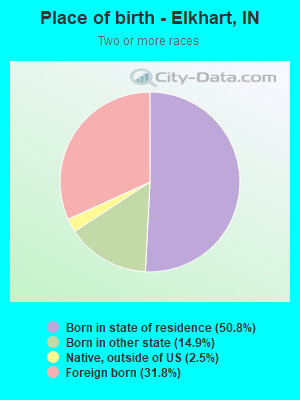
Races - Two or more races(%)
Races - Two or more races(% change since 2000)
Races - Other race alone (%)
Races - Other race alone (% change since 2000)
Racial diversity
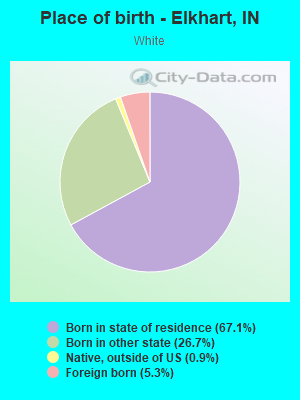
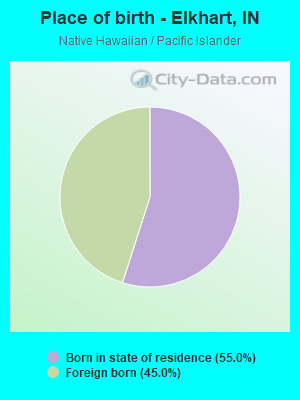
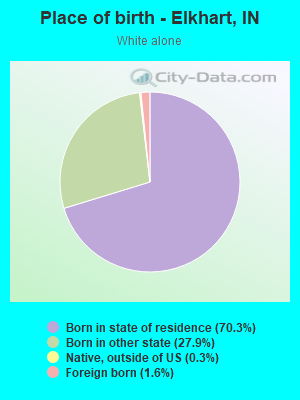
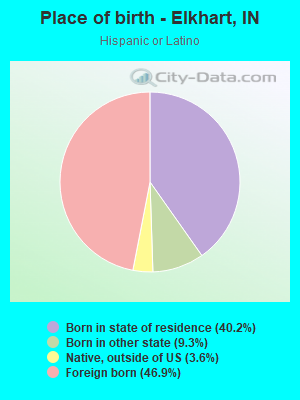
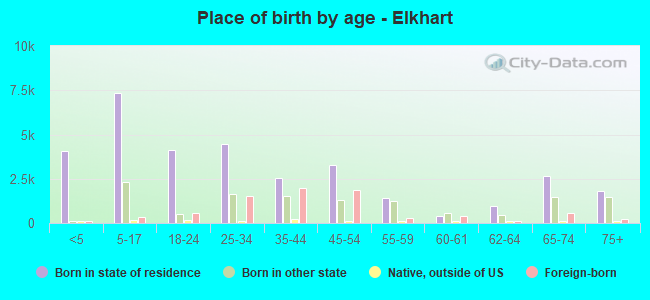
Place of birth - Born in state of residence (%)
Place of birth - Born in state of residence (%) - White
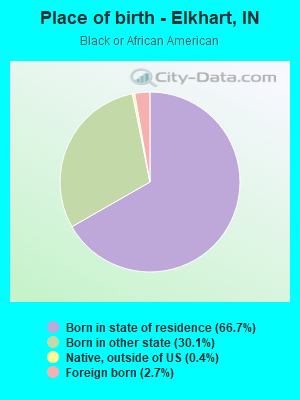
Place of birth - Born in state of residence (%) - Black or African American
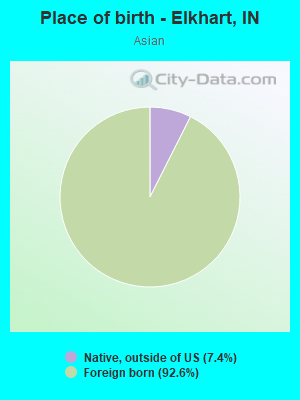
Place of birth - Born in state of residence (%) - Asian
Place of birth - Born in state of residence (%) - Hispanic or Latino
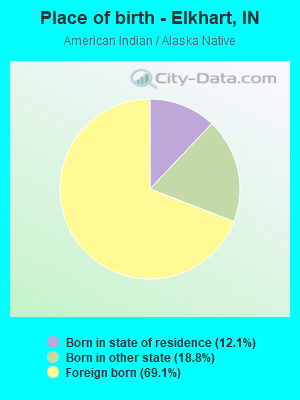
Place of birth - Born in state of residence (%) - American Indian and Alaska Native
Place of birth - Born in state of residence (%) - Multirace
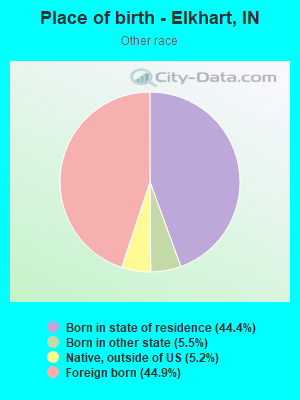
Place of birth - Born in state of residence (%) - Other Race
Place of birth - Born in other state (%)
Place of birth - Born in other state (%) - White
Place of birth - Born in other state (%) - Black or African American
Place of birth - Born in other state (%) - Asian
Place of birth - Born in other state (%) - Hispanic or Latino
Place of birth - Born in other state (%) - American Indian and Alaska Native
Place of birth - Born in other state (%) - Multirace
Place of birth - Born in other state (%) - Other Race
Place of birth - Native, outside of US (%)
Place of birth - Native, outside of US (%) - White
Place of birth - Native, outside of US (%) - Black or African American
Place of birth - Native, outside of US (%) - Asian
Place of birth - Native, outside of US (%) - Hispanic or Latino
Place of birth - Native, outside of US (%) - American Indian and Alaska Native
Place of birth - Native, outside of US (%) - Multirace
Place of birth - Native, outside of US (%) - Other Race
Place of birth - Foreign born (%)
Place of birth - Foreign born (%) - White
Place of birth - Foreign born (%) - Black or African American
Place of birth - Foreign born (%) - Asian
Place of birth - Foreign born (%) - Hispanic or Latino
Place of birth - Foreign born (%) - American Indian and Alaska Native
Place of birth - Foreign born (%) - Multirace
Place of birth - Foreign born (%) - Other Race
Residents speaking English at home (%)
Residents speaking English at home - Born in the United States (%)
Residents speaking English at home - Native, born elsewhere (%)
Residents speaking English at home - Foreign born (%)
Residents speaking Spanish at home (%)
Residents speaking Spanish at home - Born in the United States (%)
Residents speaking Spanish at home - Native, born elsewhere (%)
Residents speaking Spanish at home - Foreign born (%)
Residents speaking other language at home (%)
Residents speaking other language at home - Born in the United States (%)
Residents speaking other language at home - Native, born elsewhere (%)
Residents speaking other language at home - Foreign born (%)
Marital status - Never married (%)
Marital status - Now married (%)
Marital status - Separated (%)
Marital status - Widowed (%)
Marital status - Divorced (%)
Ancestries Reported - Arab (%)
Ancestries Reported - Czech (%)
Ancestries Reported - Danish (%)
Ancestries Reported - Dutch (%)
Ancestries Reported - English (%)
Ancestries Reported - French (%)
Ancestries Reported - French Canadian (%)
Ancestries Reported - German (%)
Ancestries Reported - Greek (%)
Ancestries Reported - Hungarian (%)
Ancestries Reported - Irish (%)
Ancestries Reported - Italian (%)
Ancestries Reported - Lithuanian (%)
Ancestries Reported - Norwegian (%)
Ancestries Reported - Polish (%)
Ancestries Reported - Portuguese (%)
Ancestries Reported - Russian (%)
Ancestries Reported - Scotch-Irish (%)
Ancestries Reported - Scottish (%)
Ancestries Reported - Slovak (%)
Ancestries Reported - Subsaharan African (%)
Ancestries Reported - Swedish (%)
Ancestries Reported - Swiss (%)
Ancestries Reported - Ukrainian (%)
Ancestries Reported - United States (%)
Ancestries Reported - Welsh (%)
Ancestries Reported - West Indian (%)
Ancestries Reported - Other (%)
Geographical mobility - Same house 1 year ago (%)
Geographical mobility - Same house 1 year ago (%) - White
Geographical mobility - Same house 1 year ago (%) - Black or African American
Geographical mobility - Same house 1 year ago (%) - Asian
Geographical mobility - Same house 1 year ago (%) - Hispanic or Latino
Geographical mobility - Same house 1 year ago (%) - American Indian and Alaska Native
Geographical mobility - Same house 1 year ago (%) - Multirace
Geographical mobility - Same house 1 year ago (%) - Other Race
Geographical mobility - Moved within same county (%)
Geographical mobility - Moved within same county (%) - White
Geographical mobility - Moved within same county (%) - Black or African American
Geographical mobility - Moved within same county (%) - Asian
Geographical mobility - Moved within same county (%) - Hispanic or Latino
Geographical mobility - Moved within same county (%) - American Indian and Alaska Native
Geographical mobility - Moved within same county (%) - Multirace
Geographical mobility - Moved within same county (%) - Other Race
Geographical mobility - Moved from different county within same state (%)
Geographical mobility - Moved from different county within same state (%) - White
Geographical mobility - Moved from different county within same state (%) - Black or African American
Geographical mobility - Moved from different county within same state (%) - Asian
Geographical mobility - Moved from different county within same state (%) - Hispanic or Latino
Geographical mobility - Moved from different county within same state (%) - American Indian and Alaska Native
Geographical mobility - Moved from different county within same state (%) - Multirace
Geographical mobility - Moved from different county within same state (%) - Other Race
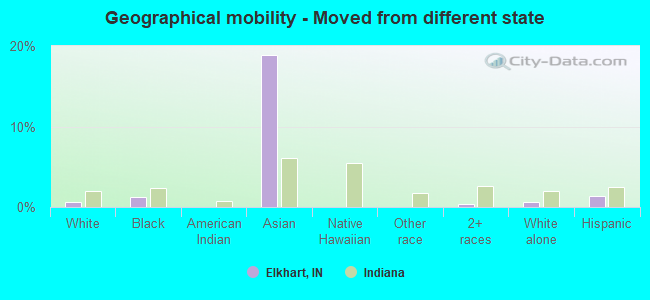
Geographical mobility - Moved from different state (%)
Geographical mobility - Moved from different state (%) - White
Geographical mobility - Moved from different state (%) - Black or African American
Geographical mobility - Moved from different state (%) - Asian
Geographical mobility - Moved from different state (%) - Hispanic or Latino
Geographical mobility - Moved from different state (%) - American Indian and Alaska Native
Geographical mobility - Moved from different state (%) - Multirace
Geographical mobility - Moved from different state (%) - Other Race
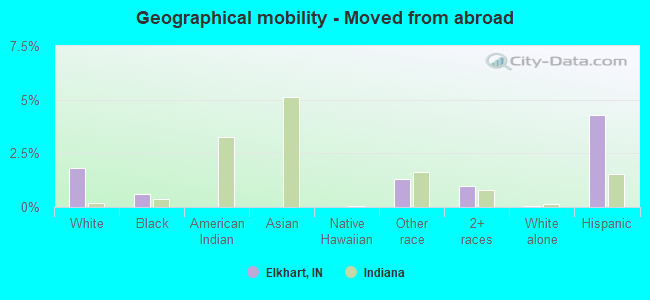
Geographical mobility - Moved from abroad (%)
Geographical mobility - Moved from abroad (%) - White
Geographical mobility - Moved from abroad (%) - Black or African American
Geographical mobility - Moved from abroad (%) - Asian
Geographical mobility - Moved from abroad (%) - Hispanic or Latino
Geographical mobility - Moved from abroad (%) - American Indian and Alaska Native
Geographical mobility - Moved from abroad (%) - Multirace
Geographical mobility - Moved from abroad (%) - Other Race
Place of birth for the foreign-born population - Ireland (%)
Place of birth for the foreign-born population - Denmark (%)
Place of birth for the foreign-born population - Norway (%)
Place of birth for the foreign-born population - Sweden (%)
Place of birth for the foreign-born population - United Kingdom (%)
Place of birth for the foreign-born population - England (%)
Place of birth for the foreign-born population - Scotland (%)
Place of birth for the foreign-born population - Other Northern Europe (%)
Place of birth for the foreign-born population - Austria (%)
Place of birth for the foreign-born population - Belgium (%)
Place of birth for the foreign-born population - France (%)
Place of birth for the foreign-born population - Germany (%)
Place of birth for the foreign-born population - Netherlands (%)
Place of birth for the foreign-born population - Switzerland (%)
Place of birth for the foreign-born population - Other Western Europe (%)
Place of birth for the foreign-born population - Greece (%)
Place of birth for the foreign-born population - Italy (%)
Place of birth for the foreign-born population - Portugal (%)
Place of birth for the foreign-born population - Spain (%)
Place of birth for the foreign-born population - Other Southern Europe (%)
Place of birth for the foreign-born population - Albania (%)
Place of birth for the foreign-born population - Belarus (%)
Place of birth for the foreign-born population - Bosnia and Herzegovina (%)
Place of birth for the foreign-born population - Bulgaria (%)
Place of birth for the foreign-born population - Croatia (%)
Place of birth for the foreign-born population - Czechoslovakia (%)
Place of birth for the foreign-born population - Hungary (%)
Place of birth for the foreign-born population - Latvia (%)
Place of birth for the foreign-born population - Lithuania (%)
Place of birth for the foreign-born population - North Macedonia (Macedonia) (%)
Place of birth for the foreign-born population - Moldova (%)
Place of birth for the foreign-born population - Poland (%)
Place of birth for the foreign-born population - Romania (%)
Place of birth for the foreign-born population - Russia (%)
Place of birth for the foreign-born population - Serbia (%)
Place of birth for the foreign-born population - Ukraine (%)
Place of birth for the foreign-born population - Other Eastern Europe (%)
Place of birth for the foreign-born population - China (%)
Place of birth for the foreign-born population - Hong Kong (%)
Place of birth for the foreign-born population - Taiwan (%)
Place of birth for the foreign-born population - Japan (%)
Place of birth for the foreign-born population - Korea (%)
Place of birth for the foreign-born population - Other Eastern Asia (%)
Place of birth for the foreign-born population - Afghanistan (%)
Place of birth for the foreign-born population - Bangladesh (%)
Place of birth for the foreign-born population - India (%)
Place of birth for the foreign-born population - Iran (%)
Place of birth for the foreign-born population - Kazakhstan (%)
Place of birth for the foreign-born population - Nepal (%)
Place of birth for the foreign-born population - Pakistan (%)
Place of birth for the foreign-born population - Sri Lanka (%)
Place of birth for the foreign-born population - Uzbekistan (%)
Place of birth for the foreign-born population - Other South Central Asia (%)
Place of birth for the foreign-born population - Burma (%)
Place of birth for the foreign-born population - Cambodia (%)
Place of birth for the foreign-born population - Indonesia (%)
Place of birth for the foreign-born population - Laos (%)
Place of birth for the foreign-born population - Malaysia (%)
Place of birth for the foreign-born population - Philippines (%)
Place of birth for the foreign-born population - Singapore (%)
Place of birth for the foreign-born population - Thailand (%)
Place of birth for the foreign-born population - Vietnam (%)
Place of birth for the foreign-born population - Other South Eastern Asia (%)
Place of birth for the foreign-born population - Armenia (%)
Place of birth for the foreign-born population - Iraq (%)
Place of birth for the foreign-born population - Israel (%)
Place of birth for the foreign-born population - Jordan (%)
Place of birth for the foreign-born population - Kuwait (%)
Place of birth for the foreign-born population - Lebanon (%)
Place of birth for the foreign-born population - Saudi Arabia (%)
Place of birth for the foreign-born population - Syria (%)
Place of birth for the foreign-born population - Turkey (%)
Place of birth for the foreign-born population - Yemen (%)
Place of birth for the foreign-born population - Other Western Asia (%)
Place of birth for the foreign-born population - Eritrea (%)
Place of birth for the foreign-born population - Ethiopia (%)
Place of birth for the foreign-born population - Kenya (%)
Place of birth for the foreign-born population - Somalia (%)
Place of birth for the foreign-born population - Uganda (%)
Place of birth for the foreign-born population - Zimbabwe (%)
Place of birth for the foreign-born population - Other Eastern Africa (%)
Place of birth for the foreign-born population - Cameroon (%)
Place of birth for the foreign-born population - Congo (%)
Place of birth for the foreign-born population - Democratic Republic of Congo (Zaire) (%)
Place of birth for the foreign-born population - Other Middle Africa (%)
Place of birth for the foreign-born population - Egypt (%)
Place of birth for the foreign-born population - Morocco (%)
Place of birth for the foreign-born population - Sudan (%)
Place of birth for the foreign-born population - Other Northern Africa (%)
Place of birth for the foreign-born population - South Africa (%)
Place of birth for the foreign-born population - Other Southern Africa (%)
Place of birth for the foreign-born population - Cabo Verde (%)
Place of birth for the foreign-born population - Ghana (%)
Place of birth for the foreign-born population - Liberia (%)
Place of birth for the foreign-born population - Nigeria (%)
Place of birth for the foreign-born population - Senegal (%)
Place of birth for the foreign-born population - Sierra Leone (%)
Place of birth for the foreign-born population - Other Western Africa (%)
Place of birth for the foreign-born population - Australia (%)
Place of birth for the foreign-born population - New Zealand (%)
Place of birth for the foreign-born population - Fiji (%)
Place of birth for the foreign-born population - Micronesia (%)
Place of birth for the foreign-born population - Bahamas (%)
Place of birth for the foreign-born population - Barbados (%)
Place of birth for the foreign-born population - Cuba (%)
Place of birth for the foreign-born population - Dominica (%)
Place of birth for the foreign-born population - Dominican Republic (%)
Place of birth for the foreign-born population - Grenada (%)
Place of birth for the foreign-born population - Haiti (%)
Place of birth for the foreign-born population - Jamaica (%)
Place of birth for the foreign-born population - St. Vincent and the Grenadines (%)
Place of birth for the foreign-born population - Trinidad and Tobago (%)
Place of birth for the foreign-born population - West Indies (%)
Place of birth for the foreign-born population - Other Caribbean (%)
Place of birth for the foreign-born population - Belize (%)
Place of birth for the foreign-born population - Costa Rica (%)
Place of birth for the foreign-born population - El Salvador (%)
Place of birth for the foreign-born population - Guatemala (%)
Place of birth for the foreign-born population - Honduras (%)
Place of birth for the foreign-born population - Mexico (%)
Place of birth for the foreign-born population - Nicaragua (%)
Place of birth for the foreign-born population - Panama (%)
Place of birth for the foreign-born population - Other Central America (%)
Place of birth for the foreign-born population - Argentina (%)
Place of birth for the foreign-born population - Bolivia (%)
Place of birth for the foreign-born population - Brazil (%)
Place of birth for the foreign-born population - Chile (%)
Place of birth for the foreign-born population - Colombia (%)
Place of birth for the foreign-born population - Ecuador (%)
Place of birth for the foreign-born population - Guyana (%)
Place of birth for the foreign-born population - Peru (%)
Place of birth for the foreign-born population - Uruguay (%)
Place of birth for the foreign-born population - Venezuela (%)
Place of birth for the foreign-born population - Other South America (%)
Place of birth for the foreign-born population - Canada (%)
Place of birth for the foreign-born population - Other Northern America (%)
Place of birth for the foreign-born population - Other (%)
Latest news about races in Elkhart, IN collected exclusively by city-data.com from local newspapers, TV, and radio stations
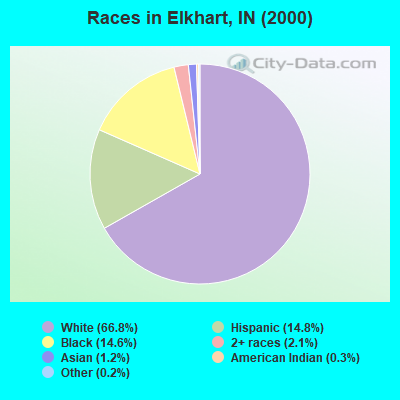
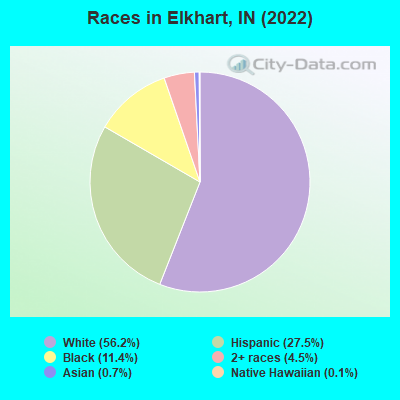
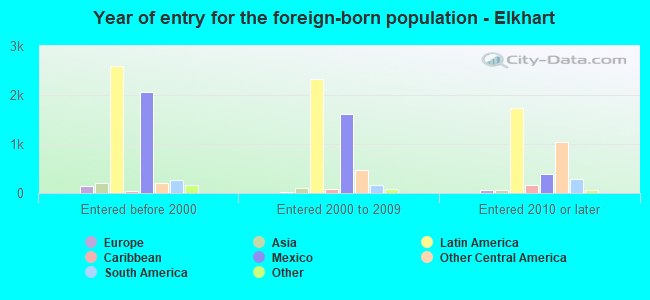
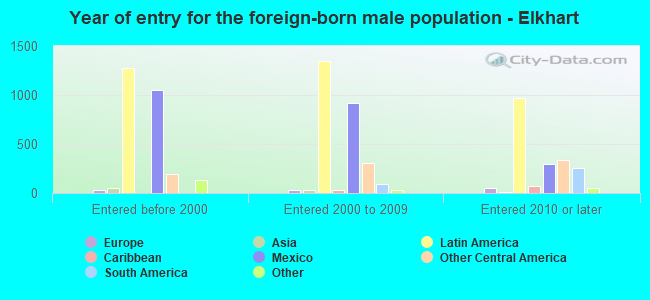
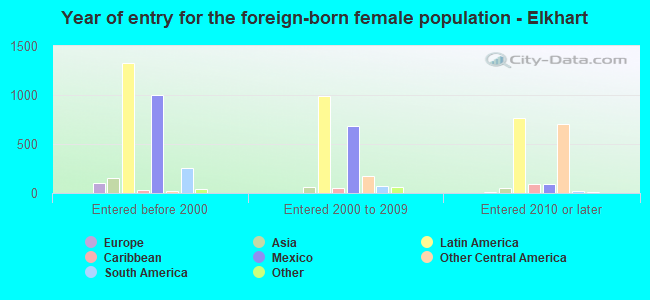
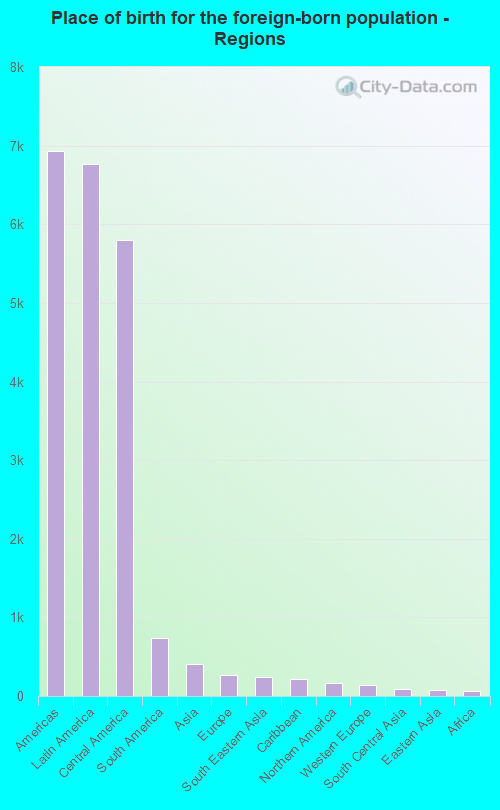
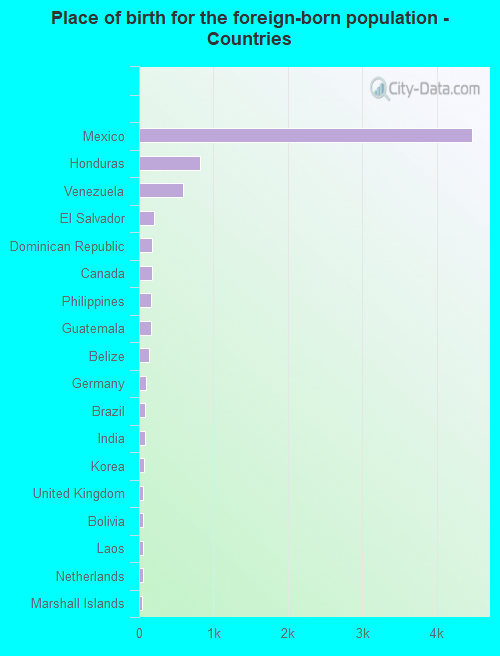
According to 2022 data, the most numerous races in Elkhart, IN are White alone (30,234 residents), Black alone (6,140 residents), and Hispanic (14,816 residents). 77.6% of Elkhart residents speak English at home. 14.4% of Elkhart, IN residents are foreign-born (11.5% born in Latin America), which is 58.2% greater than the foreign-born rate of 6.0% across the entire state of Indiana.
Race distribution in Elkhart
2000 2022
5,219,373 85.8% White alone 505,462 8.3% Black alone 214,536 3.5% Hispanic 61,115 1.0% Two or more races 58,424 1.0% Asian alone 13,654 0.2% American Indian alone 6,348 0.1% Other race alone 1,573 0.03% Native Hawaiian and Other
5,192,455 76.0% White alone 628,054 9.2% Black alone 534,528 7.8% Hispanic 263,242 3.9% Two or more races 172,880 2.5% Asian alone 33,467 0.5% Other race alone 5,866 0.09% American Indian alone 2,545 0.04% Native Hawaiian and Other
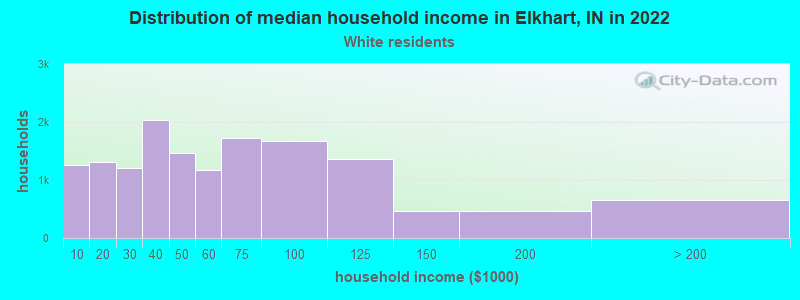
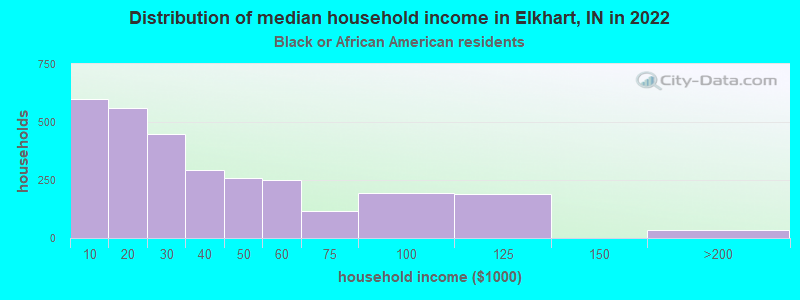
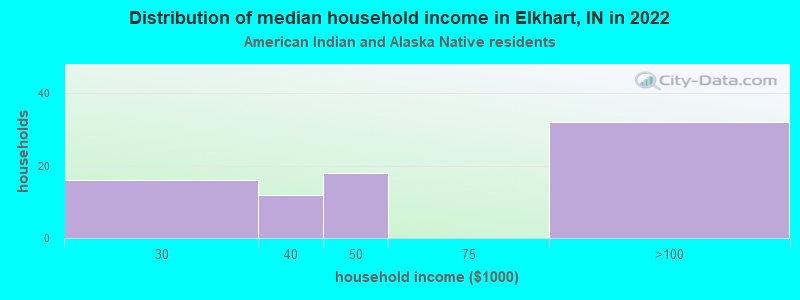
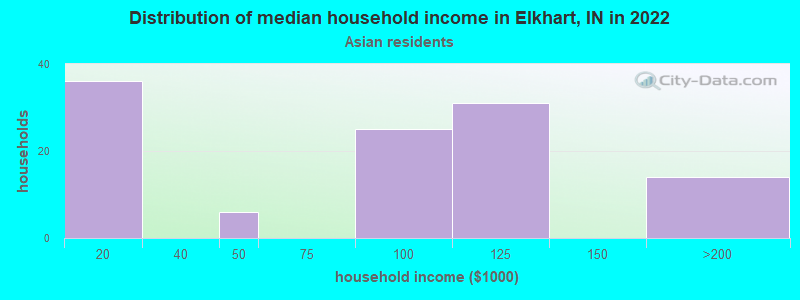
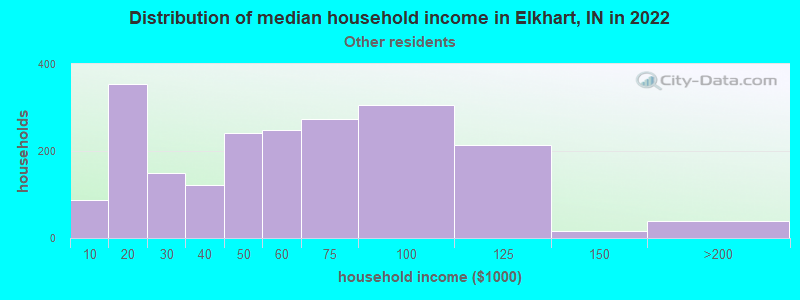
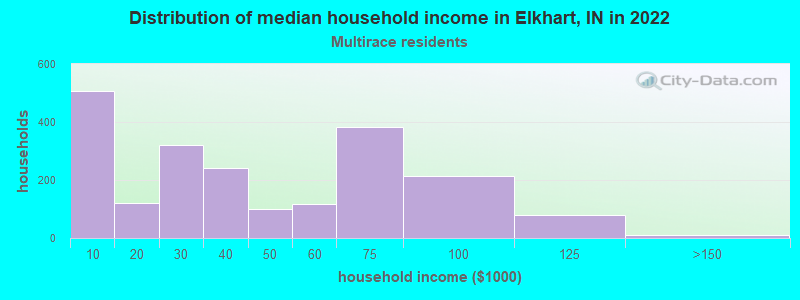
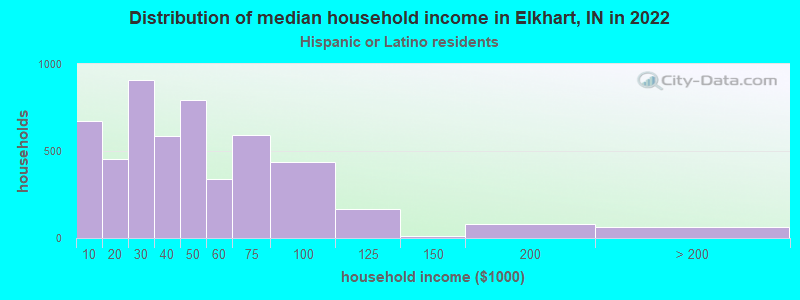
Income and house value in Elkhart Median household income in 2022 $52,970 White non-Hispanic householders$21,238 Black householders$39,211 American Indian and Alaska Native householders$75,962 Asian householders$44,759 Some other race householders$36,812 Two or more races householders$42,289 Hispanic or Latino race householdersMedian 2022 house value $140,898 White Non-Hispanic householders$121,226 Black or African American householders$144,443 American Indian or Alaska Native householders $153,659 Asian householders$119,631 Some other race householders$149,583 Two or more races householders$122,644 Hispanic or Latino householders
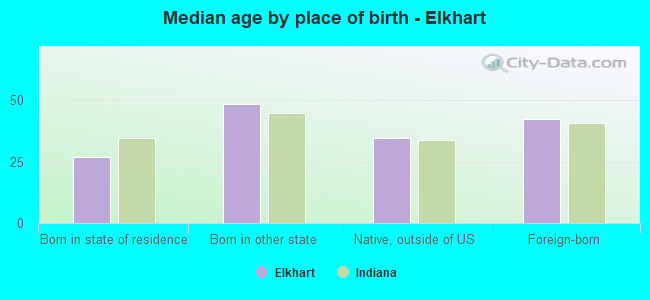
Median age by race in Elkhart
37.9 Median age for White residents35.9 40.1 33.2 Median age for Black or African American residents32.8 35.9 41.1 Median age for American Indian / Alaska Native residents29.3 30.0 44.8 Median age for Asian residents39.5 51.2 36.4 Median age for Native Hawaiian / Pacific Islander residents-644,025,156.6 -664,437,011.6 23.8 Median age for Other race residents25.3 22.8 21.9 Median age for Two or more races residents15.5 23.3 42.7 Median age for White alone residents40.2 45.8 23.9 Median age for Hispanic or Latino residents25.8 22.6
Owner/renter occupied households by race in Elkhart
House owners and renters - White residents 9,038 60.3% Owner occupied5,941 39.7% Renter occupiedHouse owners and renters - Black or African American residents 572 15.9% Owner occupied3,014 84.1% Renter occupiedHouse owners and renters - American Indian / Alaska Native residents 81 86.3% Owner occupied13 13.7% Renter occupiedHouse owners and renters - Asian residents 23 13.7% Owner occupied142 86.3% Renter occupiedHouse owners and renters - Native Hawaiian / Pacific Islander residents 23 100.0% Owner occupiedHouse owners and renters - Other race residents 1,062 40.0% Owner occupied1,591 60.0% Renter occupiedHouse owners and renters - Two or more races residents 548 28.8% Owner occupied1,352 71.2% Renter occupiedHouse owners and renters - White alone residents 8,514 61.3% Owner occupied5,375 38.7% Renter occupiedHouse owners and renters - Hispanic or Latino residents 1,541 34.6% Owner occupied2,907 65.4% Renter occupied
Language usage in Elkhart
English speakers - Total 77.6% of residents of Elkhart speak English at home.
22.2% of residents speak Spanish at home 5,979 54.3% Speak English very well5,032 45.7% Speak English less than very well1.0% of residents speak other language at home 394 81.1% Speak English very well92 18.9% Speak English less than very well
English speakers - Born in the United States 93.6% of residents of Elkhart speak English at home.
6.1% of residents speak Spanish at home 667 87.2% Speak English very well98 12.8% Speak English less than very well0.6% of residents speak other language at home 48 62.3% Speak English very well29 37.7% Speak English less than very well
English speakers - Native, born elsewhere 34.9% of residents of Elkhart speak English at home.
93.1% of residents speak Spanish at home 399 67.4% Speak English very well193 32.6% Speak English less than very well
English speakers - Foreign-born 12.9% of residents of Elkhart speak English at home.
85.9% of residents speak Spanish at home 2,501 36.0% Speak English very well4,439 64.0% Speak English less than very well2.4% of residents speak other language at home 145 75.5% Speak English very well47 24.5% Speak English less than very well
White (Caucasian) - Speak only English Native:
94.8% (28,797)Foreign-born:
28.4% (526)
White (Caucasian) - Speak another language Native:
5.9% (1,791)Foreign-born:
64.3% (1,191)
Black or African American - Speak only English Native:
98.0% (5,368)Foreign-born:
8.9% (21)
Black or African American - Speak another language Native:
1.9% (102)Foreign-born:
99.1% (231)
American Indian / Alaska Native - Speak another language Native:
100.0% (73)Foreign-born:
100.0% (159)
Asian - Speak only English Native:
100.0% (36)Foreign-born:
78.0% (230)
Native Hawaiian / Pacific Islander - Speak another language Native:
100.0% (27)Foreign-born:
100.0% (44)
Other race - Speak only English Native:
19.5% (703)Foreign-born:
2.3% (81)
Other race - Speak another language Native:
79.5% (2,870)Foreign-born:
90.6% (3,203)
Two or more races - Speak only English Native:
95.2% (2,727)Foreign-born:
1.8% (29)
Two or more races - Speak another language Native:
10.5% (300)Foreign-born:
100.0% (1,633)
White alone - Speak only English Native:
98.6% (27,654)Foreign-born:
74.8% (363)
White alone - Speak another language Native:
1.5% (429)Foreign-born:
28.9% (140)
Hispanic or Latino - Speak only English Native:
37.5% (2,367)Foreign-born:
5.8% (410)
Hispanic or Latino - Speak another language Native:
62.7% (3,961)Foreign-born:
90.7% (6,397)
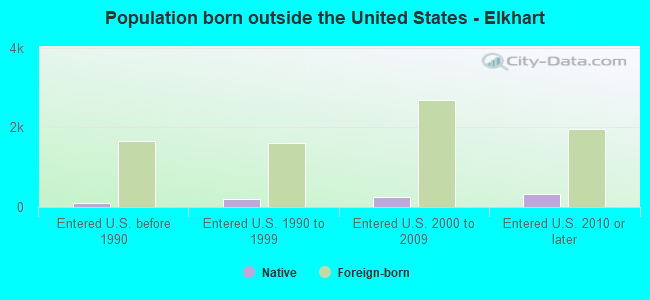
Foreign-born residents in Elkhart 7,726 residents are foreign born (11.5% Latin America ).
This city:
14.4%Indiana:
5.6%
Marital status for residents in Elkhart Marital status - White (Caucasian) population 15 years and over
Males 39.0% Never married39.1% Now married1.7% Separated3.4% Widowed16.8% DivorcedFemales 30.4% Never married34.2% Now married2.1% Separated12.6% Widowed20.8% DivorcedWomen who gave birth in the past 12 months Now married:
53.1% (237)Unmarried:
46.9% (209)
Women who did not give birth in the past 12 months Now married:
33.0% (2,250)Unmarried:
67.0% (4,576)
Marital status - Black or African American population 15 years and over
Males 58.2% Never married23.0% Now married2.3% Separated4.0% Widowed12.5% DivorcedFemales 53.1% Never married15.7% Now married6.4% Separated12.3% Widowed12.5% DivorcedWomen who gave birth in the past 12 months Now married:
0.0% (0)Unmarried:
100.0% (27)
Women who did not give birth in the past 12 months Now married:
23.4% (386)Unmarried:
76.6% (1,259)
Marital status - American Indian / Alaska Native population 15 years and over
Males 35.8% Never married17.3% Now married28.4% Separated0.0% Widowed18.5% DivorcedFemales 26.6% Never married73.4% Now married0.0% Separated0.0% Widowed0.0% DivorcedWomen who did not give birth in the past 12 months Now married:
0.0% (0)Unmarried:
100.0% (40)
Marital status - Asian population 15 years and over
Males 46.6% Never married53.4% Now married0.0% Separated0.0% Widowed0.0% DivorcedFemales 14.6% Never married62.5% Now married0.0% Separated10.9% Widowed12.0% DivorcedWomen who did not give birth in the past 12 months Now married:
59.9% (110)Unmarried:
40.1% (74)
Marital status - Native Hawaiian / Pacific Islander population 15 years and over
Males 0.0% Never married100.0% Now married0.0% Separated0.0% Widowed0.0% DivorcedFemales 0.0% Never married100.0% Now married0.0% Separated0.0% Widowed0.0% DivorcedWomen who did not give birth in the past 12 months Now married:
100.0% (24)Unmarried:
0.0% (0)
Marital status - Other race population 15 years and over
Males 34.2% Never married46.5% Now married1.6% Separated0.0% Widowed17.8% DivorcedFemales 36.9% Never married36.4% Now married0.5% Separated3.3% Widowed22.9% DivorcedWomen who gave birth in the past 12 months Now married:
48.4% (57)Unmarried:
51.6% (60)
Women who did not give birth in the past 12 months Now married:
35.5% (844)Unmarried:
64.5% (1,531)
Marital status - Two or more races population 15 years and over
Males 30.1% Never married56.9% Now married0.3% Separated0.0% Widowed12.6% DivorcedFemales 53.2% Never married31.5% Now married1.6% Separated3.5% Widowed10.2% DivorcedWomen who gave birth in the past 12 months Now married:
0.0% (0)Unmarried:
100.0% (21)
Women who did not give birth in the past 12 months Now married:
37.0% (402)Unmarried:
63.0% (685)
Marital status - White alone, not Hispanic / Latino population 15 years and over
Males 36.0% Never married41.3% Now married1.7% Separated4.0% Widowed16.9% DivorcedFemales 27.5% Never married34.6% Now married2.4% Separated13.5% Widowed22.1% DivorcedWomen who gave birth in the past 12 months Now married:
49.7% (214)Unmarried:
50.3% (217)
Women who did not give birth in the past 12 months Now married:
34.9% (2,039)Unmarried:
65.1% (3,808)
Marital status - Hispanic or Latino population 15 years and over
Males 40.6% Never married40.5% Now married2.0% Separated0.0% Widowed16.8% DivorcedFemales 46.6% Never married35.0% Now married0.3% Separated3.4% Widowed14.7% DivorcedWomen who gave birth in the past 12 months Now married:
52.9% (72)Unmarried:
47.1% (64)
Women who did not give birth in the past 12 months Now married:
32.4% (1,200)Unmarried:
67.6% (2,508)
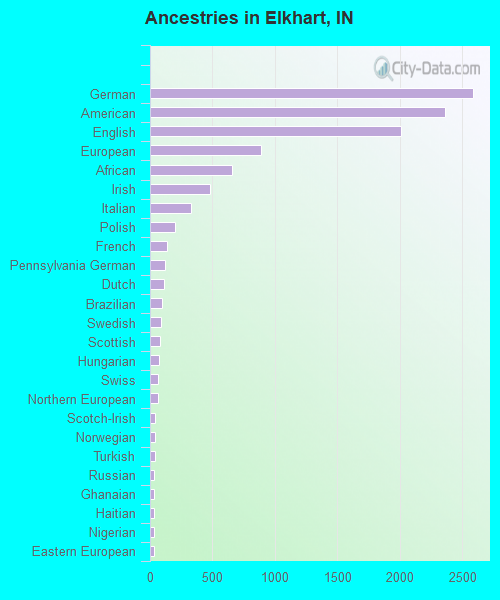
Ancestries in Elkhart
2,584 10.1% German2,359 9.2% American2,011 7.9% English891 3.5% European658 2.6% African478 1.9% Irish332 1.3% Italian199 0.8% Polish140 0.5% French120 0.5% Pennsylvania German112 0.4% Dutch93 0.4% Brazilian89 0.3% Swedish77 0.3% Scottish70 0.3% Hungarian66 0.3% Swiss64 0.3% Northern European39 0.2% Scotch-Irish38 0.1% Norwegian38 0.1% Turkish34 0.1% Russian32 0.1% Ghanaian31 0.1% Haitian30 0.1% Nigerian29 0.1% Eastern European29 0.1% British28 0.1% Lebanese21 0.08% Greek21 0.08% Welsh20 0.08% Danish13 0.05% Scandinavian13 0.05% French Canadian13 0.05% Ethiopian9 0.04% Latvian8 0.03% Slovak5 0.02% Belgian5 0.02% Ukrainian
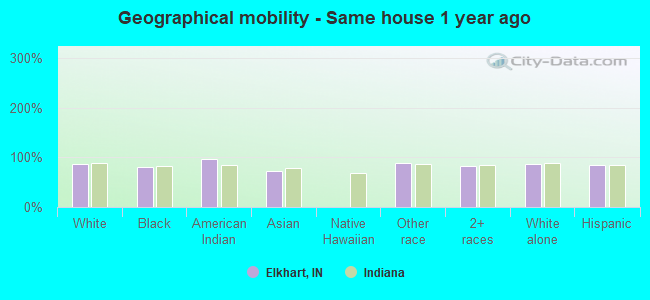
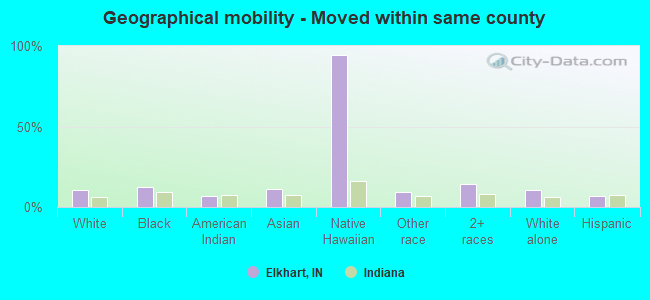
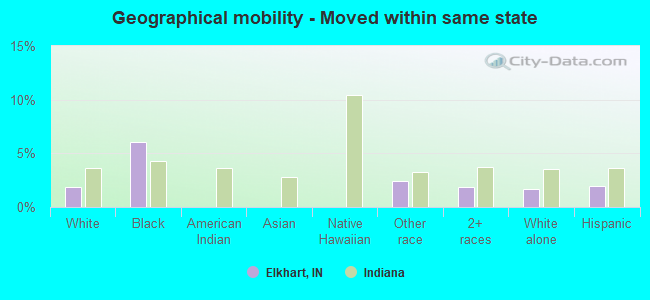
Geographical mobility in Elkhart Same house 1 year ago 29,692 86.0% White (Caucasian)5,202 79.7% Black or African American260 96.3% American Indian / Alaska Native293 71.8% Asian5,443 87.9% Other race3,826 82.2% Two or more races25,904 87.0% White alone, not Hispanic / Latino12,069 84.0% Hispanic or LatinoMoved within same county 3,547 10.3% White / Caucasian817 12.5% Black or African American18 6.7% American Indian / Alaska Native45 11.0% Asian68 94.6% Native Hawaiian / Pacific Islander561 9.1% Other race652 14.0% Two or more races3,130 10.5% White alone, not Hispanic / Latino984 6.8% Hispanic or LatinoMoved within same state 637 1.8% White / Caucasian393 6.0% Black or African American151 2.4% Other race85 1.8% Two or more races510 1.7% White alone, not Hispanic / Latino278 1.9% Hispanic or LatinoMoved from different state 215 0.6% White / Caucasian83 1.3% Black or African American77 18.8% Asian18 0.4% Two or more races185 0.6% White alone, not Hispanic / Latino200 1.4% Hispanic or LatinoMoved from abroad 621 1.8% White39 0.6% Black or African American80 1.3% Other race45 1.0% Two or more races10 0.0% White alone, not Hispanic / Latino618 4.3% Hispanic or Latino
Children Nativity (place of birth) in Elkhart
Children under 6 years - Living with two parents Both parents native 1,223 100.0% NativeBoth parents foreign-born 469 100.0% NativeOne native, one foreign-born parent 308 100.0% NativeChildren under 6 years - Living with one parent Native parent 1,997 100.0% NativeForeign-born parent 390 88.2% Native52 11.8% Foreign-bornChildren 6 to 17 years - Living with two parents Both parents native 1,618 99.7% Native4 0.3% Foreign-bornBoth parents foreign-born 1,647 97.3% Native47 2.7% Foreign-bornOne native, one foreign-born parent 327 100.0% NativeChildren 6 to 17 years - Living with one parent Native parent 3,571 100.0% NativeForeign-born parent 1,026 54.5% Native858 45.5% Foreign-born
Grandparents responsible for own grandchildren in Elkhart
Grandparents (30 to 59 years) White / Caucasian 107 36.8% Responsible for grandchildren183 63.2% Not responsible for grandchildrenBlack or African American 16 13.3% Responsible for grandchildren101 86.7% Not responsible for grandchildrenOther race 25 100.0% Not responsible for grandchildrenTwo or more races 91 88.3% Responsible for grandchildren12 11.7% Not responsible for grandchildrenWhite alone, not Hispanic / Latino 107 44.9% Responsible for grandchildren131 55.1% Not responsible for grandchildrenHispanic or Latino 14 11.3% Responsible for grandchildren110 88.7% Not responsible for grandchildrenGrandparents (60 years and over) White / Caucasian 161 31.9% Responsible for grandchildren344 68.1% Not responsible for grandchildrenBlack or African American 28 100.0% Not responsible for grandchildrenOther race 54 100.0% Not responsible for grandchildrenWhite alone, not Hispanic / Latino 161 31.5% Responsible for grandchildren351 68.5% Not responsible for grandchildrenHispanic or Latino 49 100.0% Not responsible for grandchildren