Races in Elmwood Park, Illinois (IL) Detailed Stats
Data:
Races - White alone (%)
Races - White alone (% change since 2000)
Races - Black alone (%)
Races - Black alone (% change since 2000)
Races - American Indian alone (%)
Races - American Indian alone (% change since 2000)
Races - Asian alone (%)
Races - Asian alone (% change since 2000)
Races - Hispanic (%)
Races - Hispanic (% change since 2000)
Races - Native Hawaiian and Other Pacific Islander alone (%)
Races - Native Hawaiian and Other Pacific Islander alone (% change since 2000)
Races - Two or more races(%)
Races - Two or more races(% change since 2000)
Races - Other race alone (%)
Races - Other race alone (% change since 2000)
Racial diversity
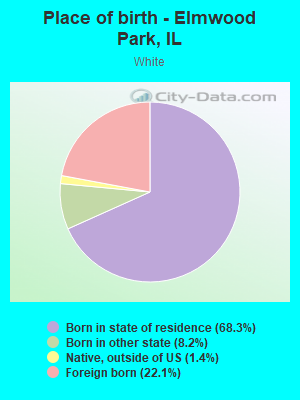
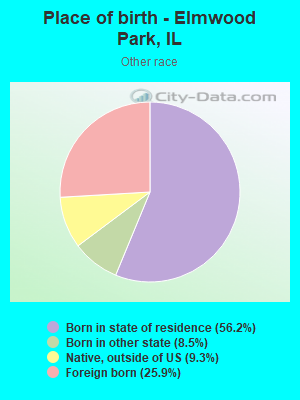
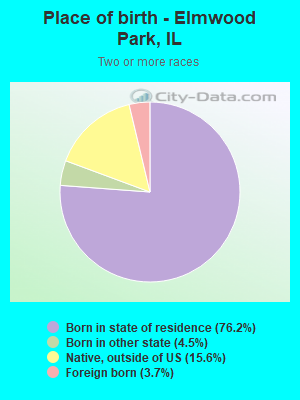
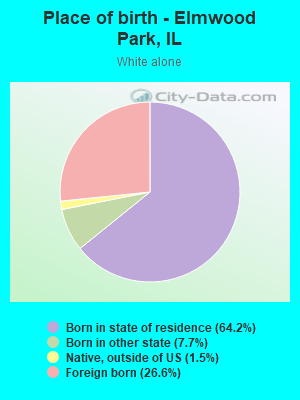
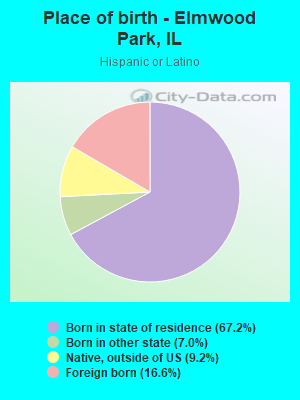
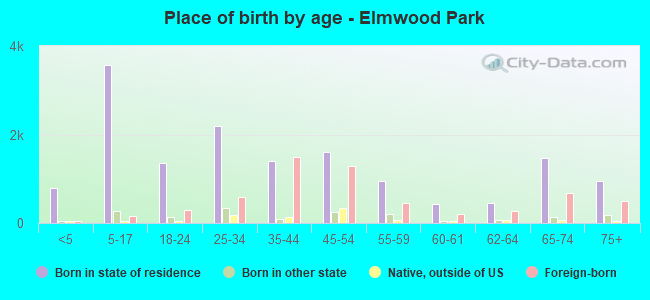
Place of birth - Born in state of residence (%)
Place of birth - Born in state of residence (%) - White
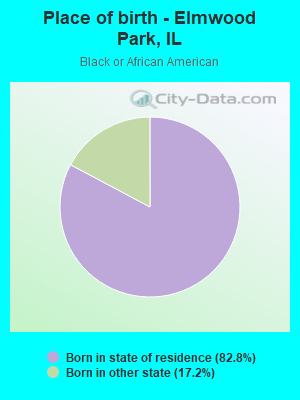
Place of birth - Born in state of residence (%) - Black or African American
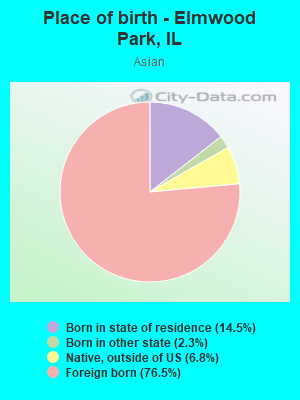
Place of birth - Born in state of residence (%) - Asian
Place of birth - Born in state of residence (%) - Hispanic or Latino
Place of birth - Born in state of residence (%) - American Indian and Alaska Native
Place of birth - Born in state of residence (%) - Multirace
Place of birth - Born in state of residence (%) - Other Race
Place of birth - Born in other state (%)
Place of birth - Born in other state (%) - White
Place of birth - Born in other state (%) - Black or African American
Place of birth - Born in other state (%) - Asian
Place of birth - Born in other state (%) - Hispanic or Latino
Place of birth - Born in other state (%) - American Indian and Alaska Native
Place of birth - Born in other state (%) - Multirace
Place of birth - Born in other state (%) - Other Race
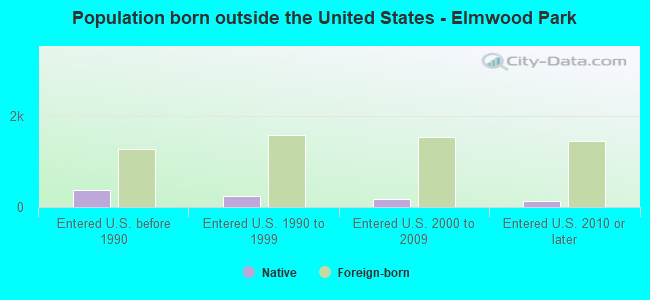
Place of birth - Native, outside of US (%)
Place of birth - Native, outside of US (%) - White
Place of birth - Native, outside of US (%) - Black or African American
Place of birth - Native, outside of US (%) - Asian
Place of birth - Native, outside of US (%) - Hispanic or Latino
Place of birth - Native, outside of US (%) - American Indian and Alaska Native
Place of birth - Native, outside of US (%) - Multirace
Place of birth - Native, outside of US (%) - Other Race
Place of birth - Foreign born (%)
Place of birth - Foreign born (%) - White
Place of birth - Foreign born (%) - Black or African American
Place of birth - Foreign born (%) - Asian
Place of birth - Foreign born (%) - Hispanic or Latino
Place of birth - Foreign born (%) - American Indian and Alaska Native
Place of birth - Foreign born (%) - Multirace
Place of birth - Foreign born (%) - Other Race
Residents speaking English at home (%)
Residents speaking English at home - Born in the United States (%)
Residents speaking English at home - Native, born elsewhere (%)
Residents speaking English at home - Foreign born (%)
Residents speaking Spanish at home (%)
Residents speaking Spanish at home - Born in the United States (%)
Residents speaking Spanish at home - Native, born elsewhere (%)
Residents speaking Spanish at home - Foreign born (%)
Residents speaking other language at home (%)
Residents speaking other language at home - Born in the United States (%)
Residents speaking other language at home - Native, born elsewhere (%)
Residents speaking other language at home - Foreign born (%)
Marital status - Never married (%)
Marital status - Now married (%)
Marital status - Separated (%)
Marital status - Widowed (%)
Marital status - Divorced (%)
Ancestries Reported - Arab (%)
Ancestries Reported - Czech (%)
Ancestries Reported - Danish (%)
Ancestries Reported - Dutch (%)
Ancestries Reported - English (%)
Ancestries Reported - French (%)
Ancestries Reported - French Canadian (%)
Ancestries Reported - German (%)
Ancestries Reported - Greek (%)
Ancestries Reported - Hungarian (%)
Ancestries Reported - Irish (%)
Ancestries Reported - Italian (%)
Ancestries Reported - Lithuanian (%)
Ancestries Reported - Norwegian (%)
Ancestries Reported - Polish (%)
Ancestries Reported - Portuguese (%)
Ancestries Reported - Russian (%)
Ancestries Reported - Scotch-Irish (%)
Ancestries Reported - Scottish (%)
Ancestries Reported - Slovak (%)
Ancestries Reported - Subsaharan African (%)
Ancestries Reported - Swedish (%)
Ancestries Reported - Swiss (%)
Ancestries Reported - Ukrainian (%)
Ancestries Reported - United States (%)
Ancestries Reported - Welsh (%)
Ancestries Reported - West Indian (%)
Ancestries Reported - Other (%)
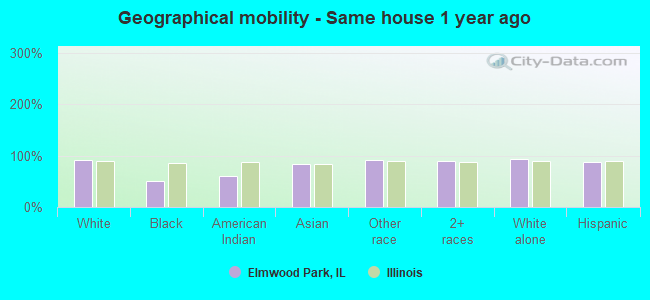
Geographical mobility - Same house 1 year ago (%)
Geographical mobility - Same house 1 year ago (%) - White
Geographical mobility - Same house 1 year ago (%) - Black or African American
Geographical mobility - Same house 1 year ago (%) - Asian
Geographical mobility - Same house 1 year ago (%) - Hispanic or Latino
Geographical mobility - Same house 1 year ago (%) - American Indian and Alaska Native
Geographical mobility - Same house 1 year ago (%) - Multirace
Geographical mobility - Same house 1 year ago (%) - Other Race
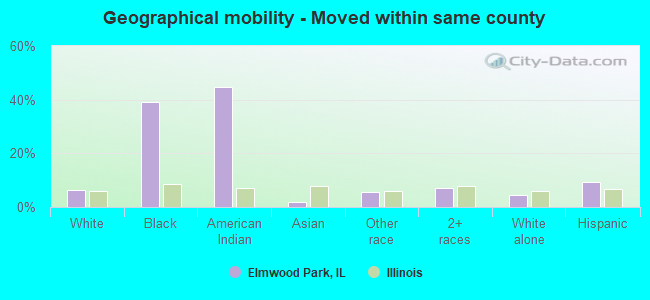
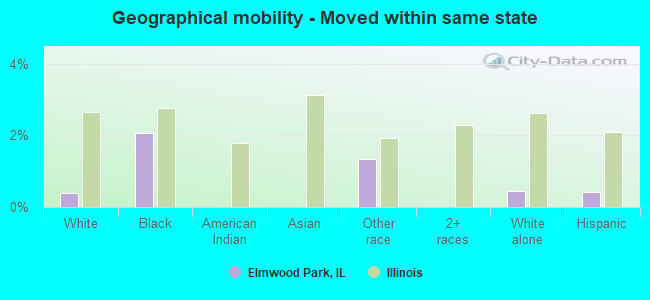
Geographical mobility - Moved within same county (%)
Geographical mobility - Moved within same county (%) - White
Geographical mobility - Moved within same county (%) - Black or African American
Geographical mobility - Moved within same county (%) - Asian
Geographical mobility - Moved within same county (%) - Hispanic or Latino
Geographical mobility - Moved within same county (%) - American Indian and Alaska Native
Geographical mobility - Moved within same county (%) - Multirace
Geographical mobility - Moved within same county (%) - Other Race
Geographical mobility - Moved from different county within same state (%)
Geographical mobility - Moved from different county within same state (%) - White
Geographical mobility - Moved from different county within same state (%) - Black or African American
Geographical mobility - Moved from different county within same state (%) - Asian
Geographical mobility - Moved from different county within same state (%) - Hispanic or Latino
Geographical mobility - Moved from different county within same state (%) - American Indian and Alaska Native
Geographical mobility - Moved from different county within same state (%) - Multirace
Geographical mobility - Moved from different county within same state (%) - Other Race
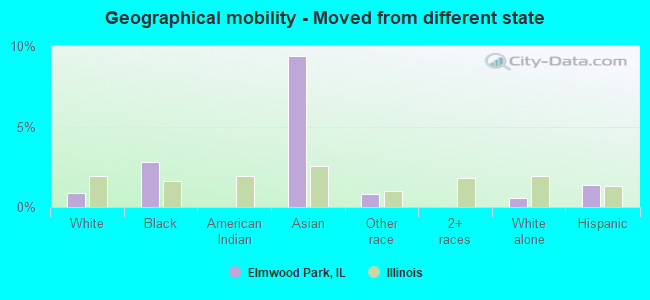
Geographical mobility - Moved from different state (%)
Geographical mobility - Moved from different state (%) - White
Geographical mobility - Moved from different state (%) - Black or African American
Geographical mobility - Moved from different state (%) - Asian
Geographical mobility - Moved from different state (%) - Hispanic or Latino
Geographical mobility - Moved from different state (%) - American Indian and Alaska Native
Geographical mobility - Moved from different state (%) - Multirace
Geographical mobility - Moved from different state (%) - Other Race
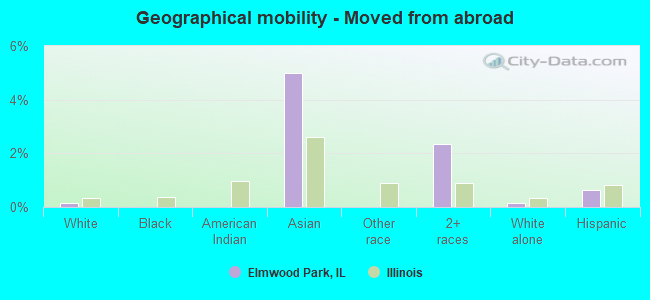
Geographical mobility - Moved from abroad (%)
Geographical mobility - Moved from abroad (%) - White
Geographical mobility - Moved from abroad (%) - Black or African American
Geographical mobility - Moved from abroad (%) - Asian
Geographical mobility - Moved from abroad (%) - Hispanic or Latino
Geographical mobility - Moved from abroad (%) - American Indian and Alaska Native
Geographical mobility - Moved from abroad (%) - Multirace
Geographical mobility - Moved from abroad (%) - Other Race
Place of birth for the foreign-born population - Ireland (%)
Place of birth for the foreign-born population - Denmark (%)
Place of birth for the foreign-born population - Norway (%)
Place of birth for the foreign-born population - Sweden (%)
Place of birth for the foreign-born population - United Kingdom (%)
Place of birth for the foreign-born population - England (%)
Place of birth for the foreign-born population - Scotland (%)
Place of birth for the foreign-born population - Other Northern Europe (%)
Place of birth for the foreign-born population - Austria (%)
Place of birth for the foreign-born population - Belgium (%)
Place of birth for the foreign-born population - France (%)
Place of birth for the foreign-born population - Germany (%)
Place of birth for the foreign-born population - Netherlands (%)
Place of birth for the foreign-born population - Switzerland (%)
Place of birth for the foreign-born population - Other Western Europe (%)
Place of birth for the foreign-born population - Greece (%)
Place of birth for the foreign-born population - Italy (%)
Place of birth for the foreign-born population - Portugal (%)
Place of birth for the foreign-born population - Spain (%)
Place of birth for the foreign-born population - Other Southern Europe (%)
Place of birth for the foreign-born population - Albania (%)
Place of birth for the foreign-born population - Belarus (%)
Place of birth for the foreign-born population - Bosnia and Herzegovina (%)
Place of birth for the foreign-born population - Bulgaria (%)
Place of birth for the foreign-born population - Croatia (%)
Place of birth for the foreign-born population - Czechoslovakia (%)
Place of birth for the foreign-born population - Hungary (%)
Place of birth for the foreign-born population - Latvia (%)
Place of birth for the foreign-born population - Lithuania (%)
Place of birth for the foreign-born population - North Macedonia (Macedonia) (%)
Place of birth for the foreign-born population - Moldova (%)
Place of birth for the foreign-born population - Poland (%)
Place of birth for the foreign-born population - Romania (%)
Place of birth for the foreign-born population - Russia (%)
Place of birth for the foreign-born population - Serbia (%)
Place of birth for the foreign-born population - Ukraine (%)
Place of birth for the foreign-born population - Other Eastern Europe (%)
Place of birth for the foreign-born population - China (%)
Place of birth for the foreign-born population - Hong Kong (%)
Place of birth for the foreign-born population - Taiwan (%)
Place of birth for the foreign-born population - Japan (%)
Place of birth for the foreign-born population - Korea (%)
Place of birth for the foreign-born population - Other Eastern Asia (%)
Place of birth for the foreign-born population - Afghanistan (%)
Place of birth for the foreign-born population - Bangladesh (%)
Place of birth for the foreign-born population - India (%)
Place of birth for the foreign-born population - Iran (%)
Place of birth for the foreign-born population - Kazakhstan (%)
Place of birth for the foreign-born population - Nepal (%)
Place of birth for the foreign-born population - Pakistan (%)
Place of birth for the foreign-born population - Sri Lanka (%)
Place of birth for the foreign-born population - Uzbekistan (%)
Place of birth for the foreign-born population - Other South Central Asia (%)
Place of birth for the foreign-born population - Burma (%)
Place of birth for the foreign-born population - Cambodia (%)
Place of birth for the foreign-born population - Indonesia (%)
Place of birth for the foreign-born population - Laos (%)
Place of birth for the foreign-born population - Malaysia (%)
Place of birth for the foreign-born population - Philippines (%)
Place of birth for the foreign-born population - Singapore (%)
Place of birth for the foreign-born population - Thailand (%)
Place of birth for the foreign-born population - Vietnam (%)
Place of birth for the foreign-born population - Other South Eastern Asia (%)
Place of birth for the foreign-born population - Armenia (%)
Place of birth for the foreign-born population - Iraq (%)
Place of birth for the foreign-born population - Israel (%)
Place of birth for the foreign-born population - Jordan (%)
Place of birth for the foreign-born population - Kuwait (%)
Place of birth for the foreign-born population - Lebanon (%)
Place of birth for the foreign-born population - Saudi Arabia (%)
Place of birth for the foreign-born population - Syria (%)
Place of birth for the foreign-born population - Turkey (%)
Place of birth for the foreign-born population - Yemen (%)
Place of birth for the foreign-born population - Other Western Asia (%)
Place of birth for the foreign-born population - Eritrea (%)
Place of birth for the foreign-born population - Ethiopia (%)
Place of birth for the foreign-born population - Kenya (%)
Place of birth for the foreign-born population - Somalia (%)
Place of birth for the foreign-born population - Uganda (%)
Place of birth for the foreign-born population - Zimbabwe (%)
Place of birth for the foreign-born population - Other Eastern Africa (%)
Place of birth for the foreign-born population - Cameroon (%)
Place of birth for the foreign-born population - Congo (%)
Place of birth for the foreign-born population - Democratic Republic of Congo (Zaire) (%)
Place of birth for the foreign-born population - Other Middle Africa (%)
Place of birth for the foreign-born population - Egypt (%)
Place of birth for the foreign-born population - Morocco (%)
Place of birth for the foreign-born population - Sudan (%)
Place of birth for the foreign-born population - Other Northern Africa (%)
Place of birth for the foreign-born population - South Africa (%)
Place of birth for the foreign-born population - Other Southern Africa (%)
Place of birth for the foreign-born population - Cabo Verde (%)
Place of birth for the foreign-born population - Ghana (%)
Place of birth for the foreign-born population - Liberia (%)
Place of birth for the foreign-born population - Nigeria (%)
Place of birth for the foreign-born population - Senegal (%)
Place of birth for the foreign-born population - Sierra Leone (%)
Place of birth for the foreign-born population - Other Western Africa (%)
Place of birth for the foreign-born population - Australia (%)
Place of birth for the foreign-born population - New Zealand (%)
Place of birth for the foreign-born population - Fiji (%)
Place of birth for the foreign-born population - Micronesia (%)
Place of birth for the foreign-born population - Bahamas (%)
Place of birth for the foreign-born population - Barbados (%)
Place of birth for the foreign-born population - Cuba (%)
Place of birth for the foreign-born population - Dominica (%)
Place of birth for the foreign-born population - Dominican Republic (%)
Place of birth for the foreign-born population - Grenada (%)
Place of birth for the foreign-born population - Haiti (%)
Place of birth for the foreign-born population - Jamaica (%)
Place of birth for the foreign-born population - St. Vincent and the Grenadines (%)
Place of birth for the foreign-born population - Trinidad and Tobago (%)
Place of birth for the foreign-born population - West Indies (%)
Place of birth for the foreign-born population - Other Caribbean (%)
Place of birth for the foreign-born population - Belize (%)
Place of birth for the foreign-born population - Costa Rica (%)
Place of birth for the foreign-born population - El Salvador (%)
Place of birth for the foreign-born population - Guatemala (%)
Place of birth for the foreign-born population - Honduras (%)
Place of birth for the foreign-born population - Mexico (%)
Place of birth for the foreign-born population - Nicaragua (%)
Place of birth for the foreign-born population - Panama (%)
Place of birth for the foreign-born population - Other Central America (%)
Place of birth for the foreign-born population - Argentina (%)
Place of birth for the foreign-born population - Bolivia (%)
Place of birth for the foreign-born population - Brazil (%)
Place of birth for the foreign-born population - Chile (%)
Place of birth for the foreign-born population - Colombia (%)
Place of birth for the foreign-born population - Ecuador (%)
Place of birth for the foreign-born population - Guyana (%)
Place of birth for the foreign-born population - Peru (%)
Place of birth for the foreign-born population - Uruguay (%)
Place of birth for the foreign-born population - Venezuela (%)
Place of birth for the foreign-born population - Other South America (%)
Place of birth for the foreign-born population - Canada (%)
Place of birth for the foreign-born population - Other Northern America (%)
Place of birth for the foreign-born population - Other (%)
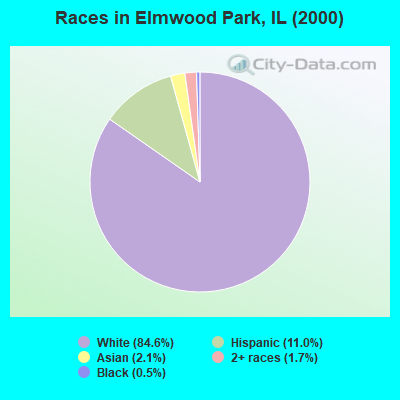
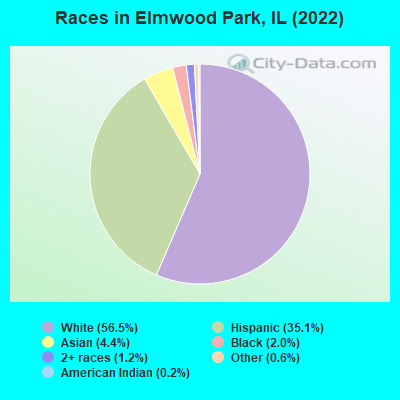
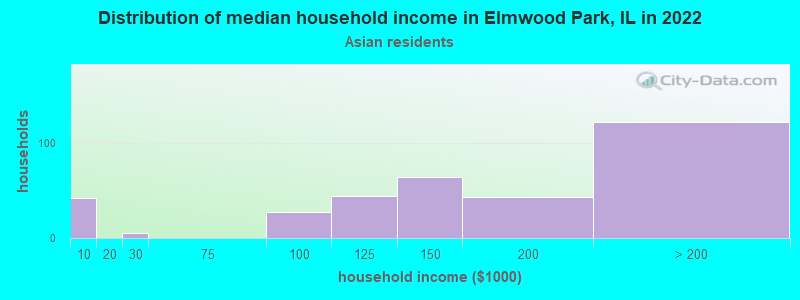
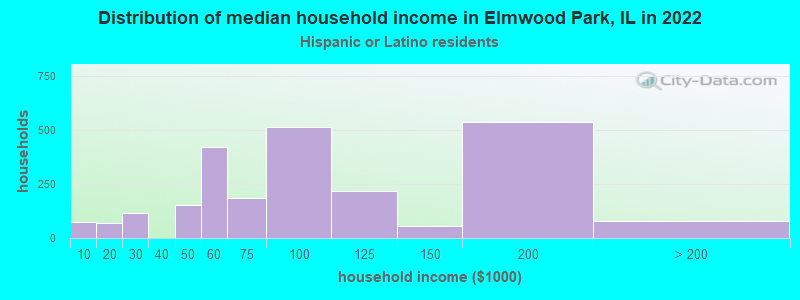
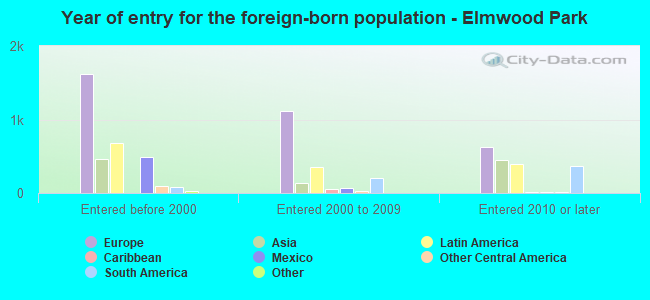
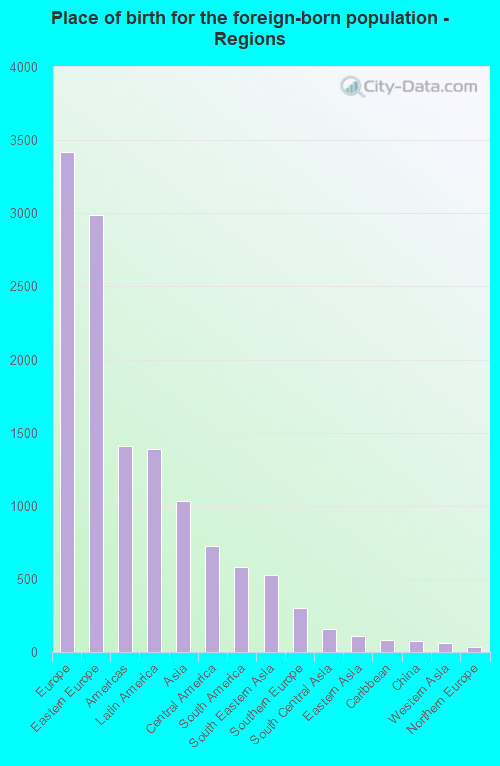
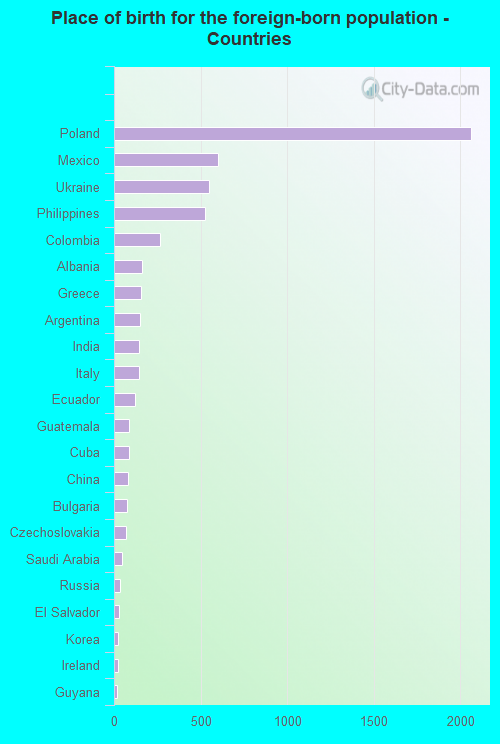
According to 2022 data, the most numerous races in Elmwood Park, IL are White alone (13,406 residents), Hispanic (8,325 residents), and Black alone (465 residents). 53.4% of Elmwood Park residents speak English at home. 24.8% of Elmwood Park, IL residents are foreign-born (14.2% born in Europe, 5.8% born in Latin America, 4.3% born in Asia), which is 43.5% greater than the foreign-born rate of 14.0% across the entire state of Illinois.
Race distribution in Elmwood Park
2000 2022
8,424,140 67.8% White alone 1,856,152 14.9% Black alone 1,530,262 12.3% Hispanic 419,916 3.4% Asian alone 153,996 1.2% Two or more races 13,479 0.1% Other race alone 18,232 0.1% American Indian alone 3,116 0.03% Native Hawaiian and Other
7,356,301 58.5% White alone 2,299,726 18.3% Hispanic 1,660,423 13.2% Black alone 747,296 5.9% Asian alone 458,599 3.6% Two or more races 45,386 0.4% Other race alone 10,405 0.08% American Indian alone 3,896 0.03% Native Hawaiian and Other
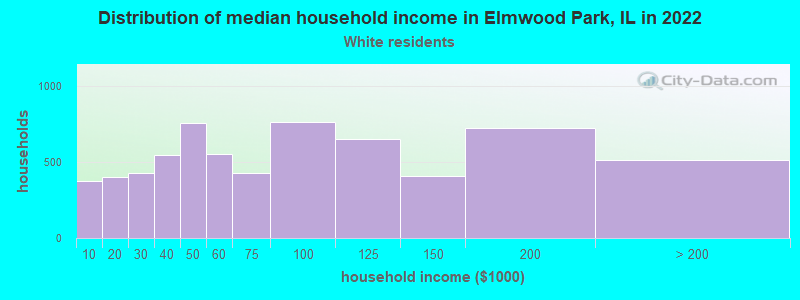
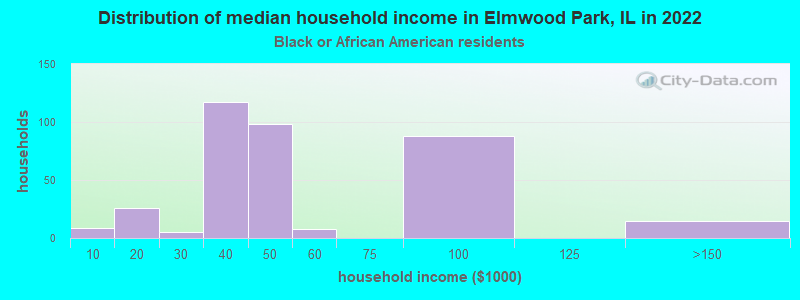
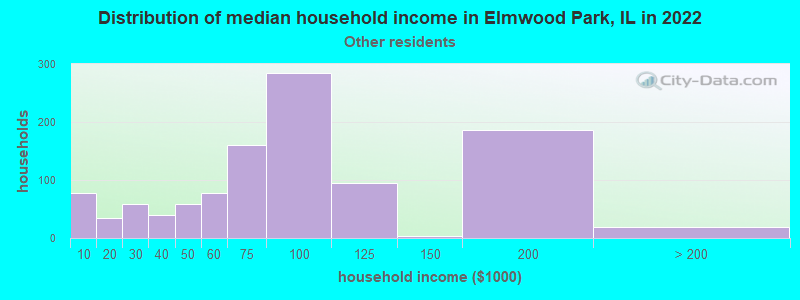
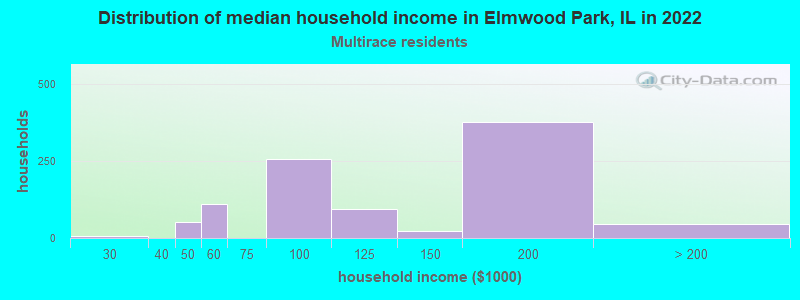
Income and house value in Elmwood Park Median household income in 2022 $67,689 White non-Hispanic householders$38,977 Black householders$134,785 Asian householders$72,786 Some other race householders$109,601 Two or more races householders$87,621 Hispanic or Latino race householdersMedian 2022 house value $320,412 White Non-Hispanic householders$256,442 Black or African American householders$375,990 American Indian or Alaska Native householders $344,658 Asian householders$346,523 Some other race householders$287,588 Two or more races householders$332,721 Hispanic or Latino householders
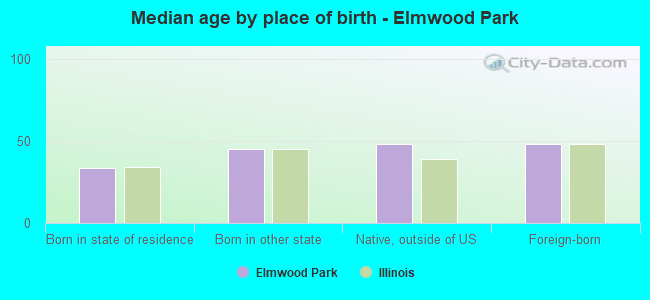
Median age by race in Elmwood Park
44.7 Median age for White residents42.4 46.7 26.2 Median age for Black or African American residents26.0 56.3 54.3 Median age for American Indian / Alaska Native residents-736,736,736.0 -641,399,416.3 49.3 Median age for Asian residents51.2 48.5 -687,999,999.3 Median age for Native Hawaiian / Pacific Islander residents-918,721,460.3 -610,229,276.3 30.9 Median age for Other race residents32.1 30.4 33.7 Median age for Two or more races residents28.0 35.2 49.7 Median age for White alone residents47.0 50.9 30.3 Median age for Hispanic or Latino residents30.8 30.0
Owner/renter occupied households by race in Elmwood Park
House owners and renters - White residents 4,381 66.6% Owner occupied2,196 33.4% Renter occupiedHouse owners and renters - Black or African American residents 84 22.1% Owner occupied295 77.9% Renter occupiedHouse owners and renters - American Indian / Alaska Native residents 19 100.0% Owner occupiedHouse owners and renters - Asian residents 310 81.9% Owner occupied69 18.1% Renter occupiedHouse owners and renters - Other race residents 490 44.5% Owner occupied612 55.5% Renter occupiedHouse owners and renters - Two or more races residents 480 48.2% Owner occupied517 51.8% Renter occupiedHouse owners and renters - White alone residents 4,303 68.2% Owner occupied2,007 31.8% Renter occupiedHouse owners and renters - Hispanic or Latino residents 1,097 46.3% Owner occupied1,274 53.7% Renter occupied
Language usage in Elmwood Park
English speakers - Total 53.4% of residents of Elmwood Park speak English at home.
21.6% of residents speak Spanish at home 3,755 75.8% Speak English very well1,202 24.2% Speak English less than very well25.1% of residents speak other language at home 2,924 50.8% Speak English very well2,830 49.2% Speak English less than very well
English speakers - Born in the United States 76.1% of residents of Elmwood Park speak English at home.
18.0% of residents speak Spanish at home 276 91.1% Speak English very well27 8.9% Speak English less than very well5.4% of residents speak other language at home 91 100.0% Speak English very well
English speakers - Native, born elsewhere 24.2% of residents of Elmwood Park speak English at home.
63.6% of residents speak Spanish at home 256 40.0% Speak English very well384 60.0% Speak English less than very well9.8% of residents speak other language at home 90 90.9% Speak English very well9 9.1% Speak English less than very well
English speakers - Foreign-born 6.6% of residents of Elmwood Park speak English at home.
22.2% of residents speak Spanish at home 634 48.6% Speak English very well670 51.4% Speak English less than very well71.1% of residents speak other language at home 1,426 34.1% Speak English very well2,752 65.9% Speak English less than very well
White (Caucasian) - Speak only English Native:
83.0% (9,017)Foreign-born:
6.5% (203)
White (Caucasian) - Speak another language Native:
15.3% (1,666)Foreign-born:
92.9% (2,912)
Asian - Speak only English Native:
39.2% (84)Foreign-born:
7.0% (56)
Asian - Speak another language Native:
60.7% (130)Foreign-born:
93.6% (743)
Other race - Speak only English Native:
31.9% (854)Foreign-born:
6.3% (65)
Other race - Speak another language Native:
68.7% (1,837)Foreign-born:
93.5% (955)
Two or more races - Speak only English Native:
52.7% (1,583)Foreign-born:
47.1% (58)
Two or more races - Speak another language Native:
47.3% (1,421)Foreign-born:
52.9% (65)
White alone - Speak only English Native:
86.1% (8,221)Foreign-born:
6.3% (225)
White alone - Speak another language Native:
14.5% (1,389)Foreign-born:
94.7% (3,374)
Hispanic or Latino - Speak only English Native:
43.3% (2,827)Foreign-born:
5.3% (73)
Hispanic or Latino - Speak another language Native:
57.3% (3,740)Foreign-born:
94.6% (1,309)
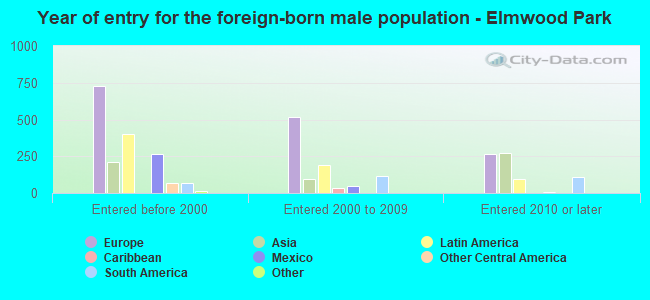
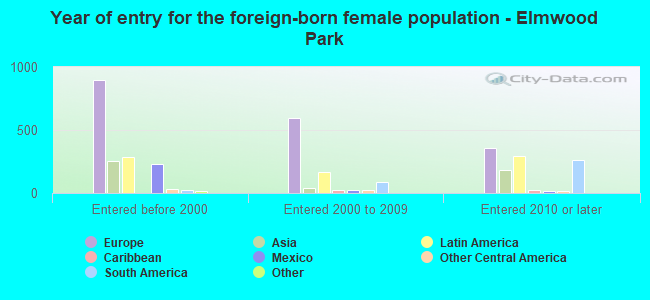
Foreign-born residents in Elmwood Park 5,879 residents are foreign born (14.2% Europe , 5.8% Latin America , 4.3% Asia ).
This city:
24.8%Illinois:
14.1%
Marital status for residents in Elmwood Park Marital status - White (Caucasian) population 15 years and over
Males 38.9% Never married46.9% Now married0.9% Separated4.5% Widowed8.7% DivorcedFemales 29.6% Never married43.6% Now married0.8% Separated12.1% Widowed13.8% DivorcedWomen who gave birth in the past 12 months Now married:
84.3% (50)Unmarried:
15.7% (9)
Women who did not give birth in the past 12 months Now married:
42.5% (1,274)Unmarried:
57.5% (1,720)
Marital status - Black or African American population 15 years and over
Males 90.8% Never married4.1% Now married0.0% Separated0.0% Widowed5.0% DivorcedFemales 64.9% Never married6.0% Now married4.6% Separated0.0% Widowed24.5% DivorcedWomen who gave birth in the past 12 months Now married:
45.0% (8)Unmarried:
55.0% (10)
Women who did not give birth in the past 12 months Now married:
0.0% (0)Unmarried:
100.0% (51)
Marital status - American Indian / Alaska Native population 15 years and over
Males 0.0% Never married100.0% Now married0.0% Separated0.0% Widowed0.0% DivorcedFemales 0.0% Never married100.0% Now married0.0% Separated0.0% Widowed0.0% DivorcedWomen who did not give birth in the past 12 months Now married:
100.0% (16)Unmarried:
0.0% (0)
Marital status - Asian population 15 years and over
Males 11.3% Never married76.1% Now married0.0% Separated1.6% Widowed11.0% DivorcedFemales 20.4% Never married73.3% Now married4.7% Separated1.6% Widowed0.0% DivorcedWomen who did not give birth in the past 12 months Now married:
61.3% (162)Unmarried:
38.7% (102)
Marital status - Other race population 15 years and over
Males 43.2% Never married54.2% Now married1.6% Separated0.0% Widowed1.0% DivorcedFemales 41.6% Never married38.5% Now married0.0% Separated9.2% Widowed10.7% DivorcedWomen who gave birth in the past 12 months Now married:
100.0% (10)Unmarried:
0.0% (0)
Women who did not give birth in the past 12 months Now married:
36.8% (392)Unmarried:
63.2% (674)
Marital status - Two or more races population 15 years and over
Males 42.2% Never married56.1% Now married0.0% Separated0.0% Widowed1.7% DivorcedFemales 51.7% Never married26.0% Now married12.5% Separated4.9% Widowed4.9% DivorcedWomen who gave birth in the past 12 months Now married:
100.0% (4)Unmarried:
0.0% (0)
Women who did not give birth in the past 12 months Now married:
37.0% (490)Unmarried:
63.0% (834)
Marital status - White alone, not Hispanic / Latino population 15 years and over
Males 38.0% Never married46.6% Now married0.9% Separated5.2% Widowed9.2% DivorcedFemales 28.1% Never married43.0% Now married0.8% Separated13.9% Widowed14.2% DivorcedWomen who gave birth in the past 12 months Now married:
76.1% (33)Unmarried:
23.9% (10)
Women who did not give birth in the past 12 months Now married:
42.1% (1,117)Unmarried:
57.9% (1,536)
Marital status - Hispanic or Latino population 15 years and over
Males 44.3% Never married51.8% Now married1.0% Separated0.0% Widowed2.9% DivorcedFemales 43.5% Never married37.4% Now married4.7% Separated5.5% Widowed8.9% DivorcedWomen who gave birth in the past 12 months Now married:
100.0% (36)Unmarried:
0.0% (0)
Women who did not give birth in the past 12 months Now married:
40.0% (1,003)Unmarried:
60.0% (1,502)
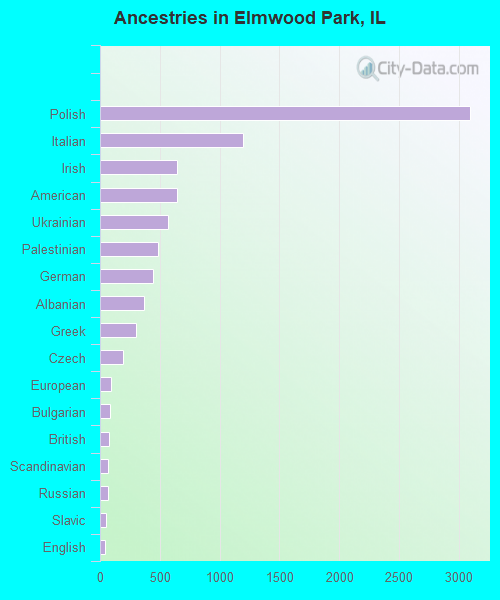
Ancestries in Elmwood Park
3,098 20.1% Polish1,193 7.7% Italian647 4.2% Irish642 4.2% American570 3.7% Ukrainian487 3.2% Palestinian444 2.9% German370 2.4% Albanian299 1.9% Greek190 1.2% Czech93 0.6% European82 0.5% Bulgarian75 0.5% British70 0.5% Scandinavian67 0.4% Russian47 0.3% Slavic45 0.3% English26 0.2% Guyanese21 0.1% Romanian16 0.1% Eastern European16 0.1% French Canadian14 0.09% Northern European14 0.09% Serbian13 0.08% Scotch-Irish12 0.08% French12 0.08% Yugoslavian9 0.06% Dutch8 0.05% Croatian8 0.05% West Indian7 0.05% Egyptian7 0.05% Lithuanian7 0.05% Scottish6 0.04% Jordanian6 0.04% Finnish5 0.03% Swedish
Geographical mobility in Elmwood Park Same house 1 year ago 13,333 91.6% White (Caucasian)233 49.9% Black or African American75 60.5% American Indian / Alaska Native870 84.5% Asian3,635 92.2% Other race3,012 90.4% Two or more races12,567 93.8% White alone, not Hispanic / Latino7,311 87.9% Hispanic or LatinoMoved within same county 924 6.3% White / Caucasian182 39.0% Black or African American55 44.8% American Indian / Alaska Native20 2.0% Asian227 5.8% Other race237 7.1% Two or more races596 4.5% White alone, not Hispanic / Latino786 9.4% Hispanic or LatinoMoved within same state 57 0.4% White / Caucasian10 2.1% Black or African American53 1.3% Other race60 0.4% White alone, not Hispanic / Latino35 0.4% Hispanic or LatinoMoved from different state 125 0.9% White / Caucasian13 2.8% Black or African American97 9.4% Asian32 0.8% Other race71 0.5% White alone, not Hispanic / Latino112 1.3% Hispanic or LatinoMoved from abroad 20 0.1% White51 5.0% Asian78 2.3% Two or more races21 0.2% White alone, not Hispanic / Latino53 0.6% Hispanic or Latino
Children Nativity (place of birth) in Elmwood Park
Children under 6 years - Living with two parents Both parents native 319 100.0% NativeBoth parents foreign-born 248 100.0% NativeOne native, one foreign-born parent 213 100.0% NativeChildren under 6 years - Living with one parent Native parent 279 100.0% NativeForeign-born parent 39 100.0% NativeChildren 6 to 17 years - Living with two parents Both parents native 1,023 100.0% NativeBoth parents foreign-born 550 80.5% Native133 19.5% Foreign-bornOne native, one foreign-born parent 619 100.0% NativeChildren 6 to 17 years - Living with one parent Native parent 1,101 100.0% NativeForeign-born parent 288 51.6% Native271 48.4% Foreign-born
Grandparents responsible for own grandchildren in Elmwood Park
Grandparents (30 to 59 years) White / Caucasian 17 100.0% Not responsible for grandchildrenAmerican Indian / Alaska Native 18 100.0% Responsible for grandchildrenOther race 176 61.5% Responsible for grandchildren110 38.5% Not responsible for grandchildrenTwo or more races 58 100.0% Responsible for grandchildrenHispanic or Latino 170 59.3% Responsible for grandchildren117 40.7% Not responsible for grandchildrenGrandparents (60 years and over) White / Caucasian 12 4.5% Responsible for grandchildren253 95.5% Not responsible for grandchildrenOther race 15 100.0% Responsible for grandchildrenHispanic or Latino 16 100.0% Responsible for grandchildren