Races in Elsmere, Delaware (DE) Detailed Stats
Data:
Races - White alone (%)
Races - White alone (% change since 2000)
Races - Black alone (%)
Races - Black alone (% change since 2000)
Races - American Indian alone (%)
Races - American Indian alone (% change since 2000)
Races - Asian alone (%)
Races - Asian alone (% change since 2000)
Races - Hispanic (%)
Races - Hispanic (% change since 2000)
Races - Native Hawaiian and Other Pacific Islander alone (%)
Races - Native Hawaiian and Other Pacific Islander alone (% change since 2000)
Races - Two or more races(%)
Races - Two or more races(% change since 2000)
Races - Other race alone (%)
Races - Other race alone (% change since 2000)
Racial diversity
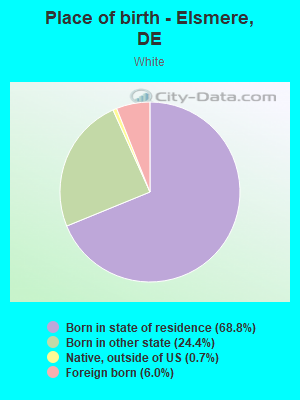
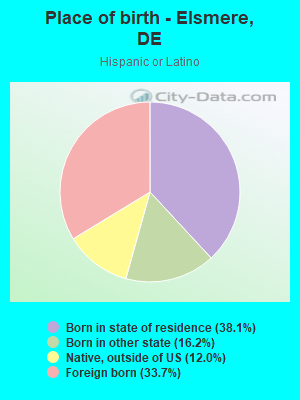
Place of birth - Born in state of residence (%)
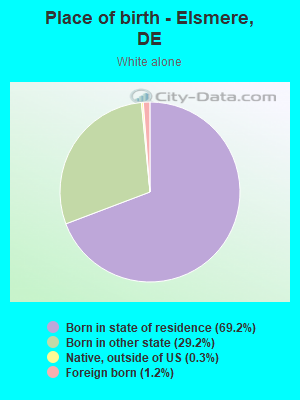
Place of birth - Born in state of residence (%) - White
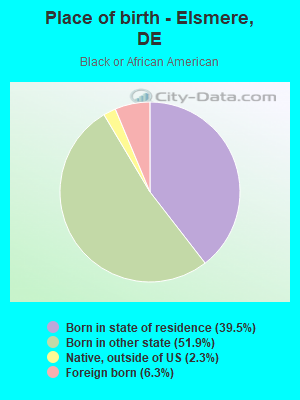
Place of birth - Born in state of residence (%) - Black or African American
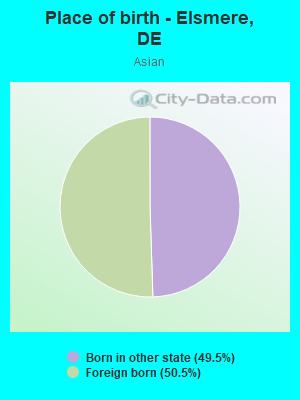
Place of birth - Born in state of residence (%) - Asian
Place of birth - Born in state of residence (%) - Hispanic or Latino
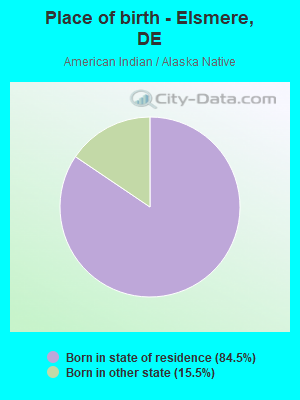
Place of birth - Born in state of residence (%) - American Indian and Alaska Native
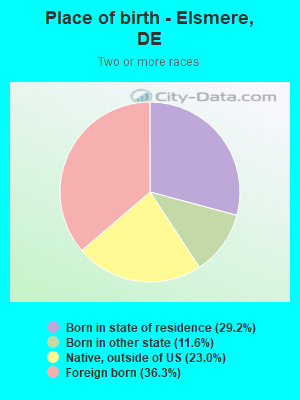
Place of birth - Born in state of residence (%) - Multirace
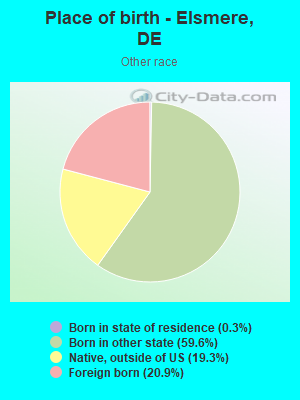
Place of birth - Born in state of residence (%) - Other Race
Place of birth - Born in other state (%)
Place of birth - Born in other state (%) - White
Place of birth - Born in other state (%) - Black or African American
Place of birth - Born in other state (%) - Asian
Place of birth - Born in other state (%) - Hispanic or Latino
Place of birth - Born in other state (%) - American Indian and Alaska Native
Place of birth - Born in other state (%) - Multirace
Place of birth - Born in other state (%) - Other Race
Place of birth - Native, outside of US (%)
Place of birth - Native, outside of US (%) - White
Place of birth - Native, outside of US (%) - Black or African American
Place of birth - Native, outside of US (%) - Asian
Place of birth - Native, outside of US (%) - Hispanic or Latino
Place of birth - Native, outside of US (%) - American Indian and Alaska Native
Place of birth - Native, outside of US (%) - Multirace
Place of birth - Native, outside of US (%) - Other Race
Place of birth - Foreign born (%)
Place of birth - Foreign born (%) - White
Place of birth - Foreign born (%) - Black or African American
Place of birth - Foreign born (%) - Asian
Place of birth - Foreign born (%) - Hispanic or Latino
Place of birth - Foreign born (%) - American Indian and Alaska Native
Place of birth - Foreign born (%) - Multirace
Place of birth - Foreign born (%) - Other Race
Residents speaking English at home (%)
Residents speaking English at home - Born in the United States (%)
Residents speaking English at home - Native, born elsewhere (%)
Residents speaking English at home - Foreign born (%)
Residents speaking Spanish at home (%)
Residents speaking Spanish at home - Born in the United States (%)
Residents speaking Spanish at home - Native, born elsewhere (%)
Residents speaking Spanish at home - Foreign born (%)
Residents speaking other language at home (%)
Residents speaking other language at home - Born in the United States (%)
Residents speaking other language at home - Native, born elsewhere (%)
Residents speaking other language at home - Foreign born (%)
Marital status - Never married (%)
Marital status - Now married (%)
Marital status - Separated (%)
Marital status - Widowed (%)
Marital status - Divorced (%)
Ancestries Reported - Arab (%)
Ancestries Reported - Czech (%)
Ancestries Reported - Danish (%)
Ancestries Reported - Dutch (%)
Ancestries Reported - English (%)
Ancestries Reported - French (%)
Ancestries Reported - French Canadian (%)
Ancestries Reported - German (%)
Ancestries Reported - Greek (%)
Ancestries Reported - Hungarian (%)
Ancestries Reported - Irish (%)
Ancestries Reported - Italian (%)
Ancestries Reported - Lithuanian (%)
Ancestries Reported - Norwegian (%)
Ancestries Reported - Polish (%)
Ancestries Reported - Portuguese (%)
Ancestries Reported - Russian (%)
Ancestries Reported - Scotch-Irish (%)
Ancestries Reported - Scottish (%)
Ancestries Reported - Slovak (%)
Ancestries Reported - Subsaharan African (%)
Ancestries Reported - Swedish (%)
Ancestries Reported - Swiss (%)
Ancestries Reported - Ukrainian (%)
Ancestries Reported - United States (%)
Ancestries Reported - Welsh (%)
Ancestries Reported - West Indian (%)
Ancestries Reported - Other (%)
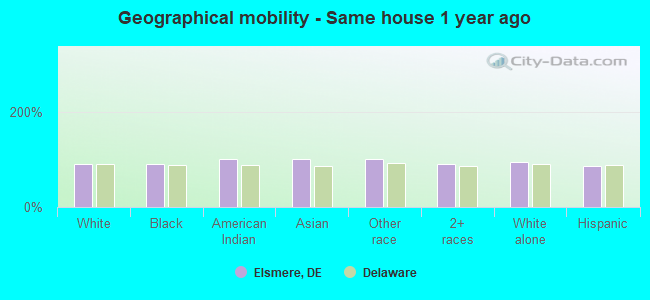
Geographical mobility - Same house 1 year ago (%)
Geographical mobility - Same house 1 year ago (%) - White
Geographical mobility - Same house 1 year ago (%) - Black or African American
Geographical mobility - Same house 1 year ago (%) - Asian
Geographical mobility - Same house 1 year ago (%) - Hispanic or Latino
Geographical mobility - Same house 1 year ago (%) - American Indian and Alaska Native
Geographical mobility - Same house 1 year ago (%) - Multirace
Geographical mobility - Same house 1 year ago (%) - Other Race
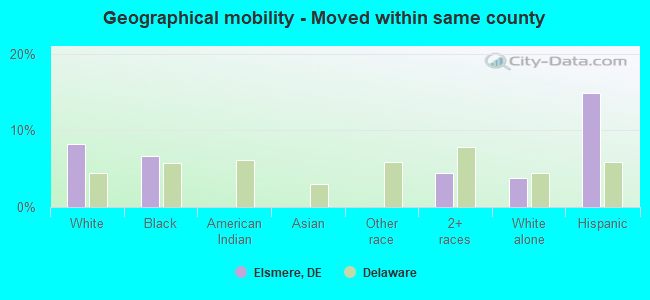
Geographical mobility - Moved within same county (%)
Geographical mobility - Moved within same county (%) - White
Geographical mobility - Moved within same county (%) - Black or African American
Geographical mobility - Moved within same county (%) - Asian
Geographical mobility - Moved within same county (%) - Hispanic or Latino
Geographical mobility - Moved within same county (%) - American Indian and Alaska Native
Geographical mobility - Moved within same county (%) - Multirace
Geographical mobility - Moved within same county (%) - Other Race
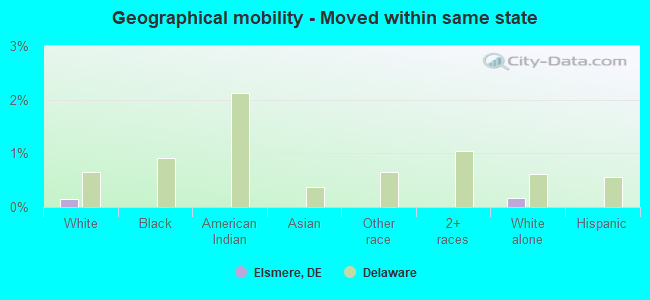
Geographical mobility - Moved from different county within same state (%)
Geographical mobility - Moved from different county within same state (%) - White
Geographical mobility - Moved from different county within same state (%) - Black or African American
Geographical mobility - Moved from different county within same state (%) - Asian
Geographical mobility - Moved from different county within same state (%) - Hispanic or Latino
Geographical mobility - Moved from different county within same state (%) - American Indian and Alaska Native
Geographical mobility - Moved from different county within same state (%) - Multirace
Geographical mobility - Moved from different county within same state (%) - Other Race
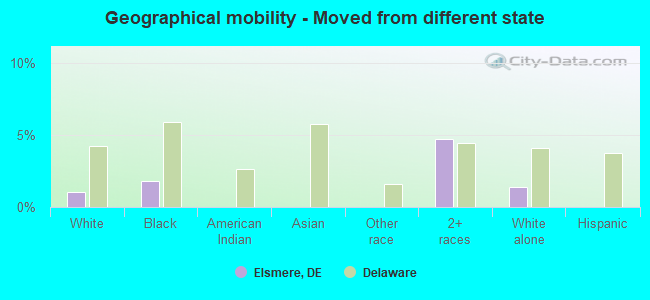
Geographical mobility - Moved from different state (%)
Geographical mobility - Moved from different state (%) - White
Geographical mobility - Moved from different state (%) - Black or African American
Geographical mobility - Moved from different state (%) - Asian
Geographical mobility - Moved from different state (%) - Hispanic or Latino
Geographical mobility - Moved from different state (%) - American Indian and Alaska Native
Geographical mobility - Moved from different state (%) - Multirace
Geographical mobility - Moved from different state (%) - Other Race
Geographical mobility - Moved from abroad (%)
Geographical mobility - Moved from abroad (%) - White
Geographical mobility - Moved from abroad (%) - Black or African American
Geographical mobility - Moved from abroad (%) - Asian
Geographical mobility - Moved from abroad (%) - Hispanic or Latino
Geographical mobility - Moved from abroad (%) - American Indian and Alaska Native
Geographical mobility - Moved from abroad (%) - Multirace
Geographical mobility - Moved from abroad (%) - Other Race
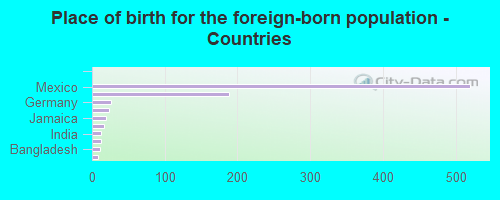
Place of birth for the foreign-born population - Ireland (%)
Place of birth for the foreign-born population - Denmark (%)
Place of birth for the foreign-born population - Norway (%)
Place of birth for the foreign-born population - Sweden (%)
Place of birth for the foreign-born population - United Kingdom (%)
Place of birth for the foreign-born population - England (%)
Place of birth for the foreign-born population - Scotland (%)
Place of birth for the foreign-born population - Other Northern Europe (%)
Place of birth for the foreign-born population - Austria (%)
Place of birth for the foreign-born population - Belgium (%)
Place of birth for the foreign-born population - France (%)
Place of birth for the foreign-born population - Germany (%)
Place of birth for the foreign-born population - Netherlands (%)
Place of birth for the foreign-born population - Switzerland (%)
Place of birth for the foreign-born population - Other Western Europe (%)
Place of birth for the foreign-born population - Greece (%)
Place of birth for the foreign-born population - Italy (%)
Place of birth for the foreign-born population - Portugal (%)
Place of birth for the foreign-born population - Spain (%)
Place of birth for the foreign-born population - Other Southern Europe (%)
Place of birth for the foreign-born population - Albania (%)
Place of birth for the foreign-born population - Belarus (%)
Place of birth for the foreign-born population - Bosnia and Herzegovina (%)
Place of birth for the foreign-born population - Bulgaria (%)
Place of birth for the foreign-born population - Croatia (%)
Place of birth for the foreign-born population - Czechoslovakia (%)
Place of birth for the foreign-born population - Hungary (%)
Place of birth for the foreign-born population - Latvia (%)
Place of birth for the foreign-born population - Lithuania (%)
Place of birth for the foreign-born population - North Macedonia (Macedonia) (%)
Place of birth for the foreign-born population - Moldova (%)
Place of birth for the foreign-born population - Poland (%)
Place of birth for the foreign-born population - Romania (%)
Place of birth for the foreign-born population - Russia (%)
Place of birth for the foreign-born population - Serbia (%)
Place of birth for the foreign-born population - Ukraine (%)
Place of birth for the foreign-born population - Other Eastern Europe (%)
Place of birth for the foreign-born population - China (%)
Place of birth for the foreign-born population - Hong Kong (%)
Place of birth for the foreign-born population - Taiwan (%)
Place of birth for the foreign-born population - Japan (%)
Place of birth for the foreign-born population - Korea (%)
Place of birth for the foreign-born population - Other Eastern Asia (%)
Place of birth for the foreign-born population - Afghanistan (%)
Place of birth for the foreign-born population - Bangladesh (%)
Place of birth for the foreign-born population - India (%)
Place of birth for the foreign-born population - Iran (%)
Place of birth for the foreign-born population - Kazakhstan (%)
Place of birth for the foreign-born population - Nepal (%)
Place of birth for the foreign-born population - Pakistan (%)
Place of birth for the foreign-born population - Sri Lanka (%)
Place of birth for the foreign-born population - Uzbekistan (%)
Place of birth for the foreign-born population - Other South Central Asia (%)
Place of birth for the foreign-born population - Burma (%)
Place of birth for the foreign-born population - Cambodia (%)
Place of birth for the foreign-born population - Indonesia (%)
Place of birth for the foreign-born population - Laos (%)
Place of birth for the foreign-born population - Malaysia (%)
Place of birth for the foreign-born population - Philippines (%)
Place of birth for the foreign-born population - Singapore (%)
Place of birth for the foreign-born population - Thailand (%)
Place of birth for the foreign-born population - Vietnam (%)
Place of birth for the foreign-born population - Other South Eastern Asia (%)
Place of birth for the foreign-born population - Armenia (%)
Place of birth for the foreign-born population - Iraq (%)
Place of birth for the foreign-born population - Israel (%)
Place of birth for the foreign-born population - Jordan (%)
Place of birth for the foreign-born population - Kuwait (%)
Place of birth for the foreign-born population - Lebanon (%)
Place of birth for the foreign-born population - Saudi Arabia (%)
Place of birth for the foreign-born population - Syria (%)
Place of birth for the foreign-born population - Turkey (%)
Place of birth for the foreign-born population - Yemen (%)
Place of birth for the foreign-born population - Other Western Asia (%)
Place of birth for the foreign-born population - Eritrea (%)
Place of birth for the foreign-born population - Ethiopia (%)
Place of birth for the foreign-born population - Kenya (%)
Place of birth for the foreign-born population - Somalia (%)
Place of birth for the foreign-born population - Uganda (%)
Place of birth for the foreign-born population - Zimbabwe (%)
Place of birth for the foreign-born population - Other Eastern Africa (%)
Place of birth for the foreign-born population - Cameroon (%)
Place of birth for the foreign-born population - Congo (%)
Place of birth for the foreign-born population - Democratic Republic of Congo (Zaire) (%)
Place of birth for the foreign-born population - Other Middle Africa (%)
Place of birth for the foreign-born population - Egypt (%)
Place of birth for the foreign-born population - Morocco (%)
Place of birth for the foreign-born population - Sudan (%)
Place of birth for the foreign-born population - Other Northern Africa (%)
Place of birth for the foreign-born population - South Africa (%)
Place of birth for the foreign-born population - Other Southern Africa (%)
Place of birth for the foreign-born population - Cabo Verde (%)
Place of birth for the foreign-born population - Ghana (%)
Place of birth for the foreign-born population - Liberia (%)
Place of birth for the foreign-born population - Nigeria (%)
Place of birth for the foreign-born population - Senegal (%)
Place of birth for the foreign-born population - Sierra Leone (%)
Place of birth for the foreign-born population - Other Western Africa (%)
Place of birth for the foreign-born population - Australia (%)
Place of birth for the foreign-born population - New Zealand (%)
Place of birth for the foreign-born population - Fiji (%)
Place of birth for the foreign-born population - Micronesia (%)
Place of birth for the foreign-born population - Bahamas (%)
Place of birth for the foreign-born population - Barbados (%)
Place of birth for the foreign-born population - Cuba (%)
Place of birth for the foreign-born population - Dominica (%)
Place of birth for the foreign-born population - Dominican Republic (%)
Place of birth for the foreign-born population - Grenada (%)
Place of birth for the foreign-born population - Haiti (%)
Place of birth for the foreign-born population - Jamaica (%)
Place of birth for the foreign-born population - St. Vincent and the Grenadines (%)
Place of birth for the foreign-born population - Trinidad and Tobago (%)
Place of birth for the foreign-born population - West Indies (%)
Place of birth for the foreign-born population - Other Caribbean (%)
Place of birth for the foreign-born population - Belize (%)
Place of birth for the foreign-born population - Costa Rica (%)
Place of birth for the foreign-born population - El Salvador (%)
Place of birth for the foreign-born population - Guatemala (%)
Place of birth for the foreign-born population - Honduras (%)
Place of birth for the foreign-born population - Mexico (%)
Place of birth for the foreign-born population - Nicaragua (%)
Place of birth for the foreign-born population - Panama (%)
Place of birth for the foreign-born population - Other Central America (%)
Place of birth for the foreign-born population - Argentina (%)
Place of birth for the foreign-born population - Bolivia (%)
Place of birth for the foreign-born population - Brazil (%)
Place of birth for the foreign-born population - Chile (%)
Place of birth for the foreign-born population - Colombia (%)
Place of birth for the foreign-born population - Ecuador (%)
Place of birth for the foreign-born population - Guyana (%)
Place of birth for the foreign-born population - Peru (%)
Place of birth for the foreign-born population - Uruguay (%)
Place of birth for the foreign-born population - Venezuela (%)
Place of birth for the foreign-born population - Other South America (%)
Place of birth for the foreign-born population - Canada (%)
Place of birth for the foreign-born population - Other Northern America (%)
Place of birth for the foreign-born population - Other (%)
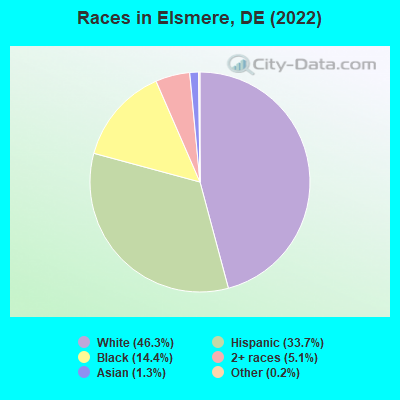
According to 2022 data, the most numerous races in Elsmere, DE are White alone (2,894 residents), Black alone (901 residents), and Hispanic (2,107 residents). 75.4% of Elsmere residents speak English at home. 13.4% of Elsmere, DE residents are foreign-born (12.1% born in Latin America), which is 33.1% greater than the foreign-born rate of 9.0% across the entire state of Delaware.
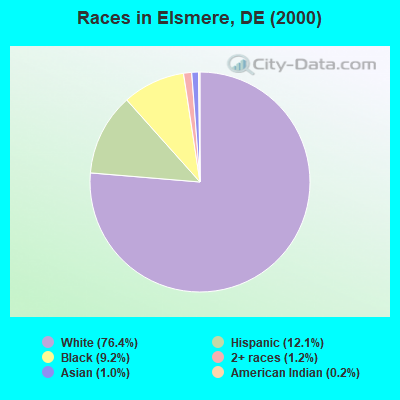
Race distribution in Elsmere
2000 2022
567,973 72.5% White alone 148,435 18.9% Black alone 37,277 4.8% Hispanic 16,110 2.1% Asian alone 10,222 1.3% Two or more races 2,324 0.3% American Indian alone 1,025 0.1% Other race alone 234 0.03% Native Hawaiian and Other
599,347 58.9% White alone 220,010 21.6% Black alone 105,300 10.3% Hispanic 46,016 4.5% Two or more races 41,350 4.1% Asian alone 5,097 0.5% Other race alone 1,276 0.1% American Indian alone
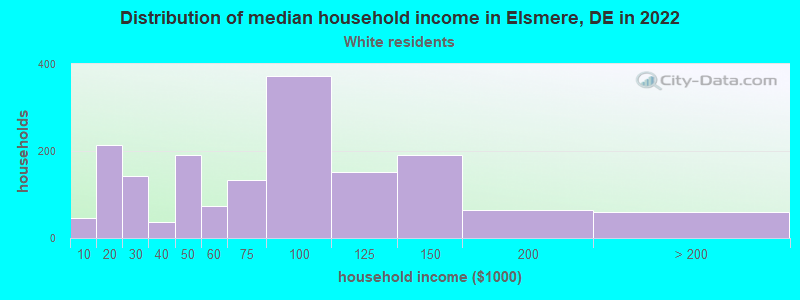
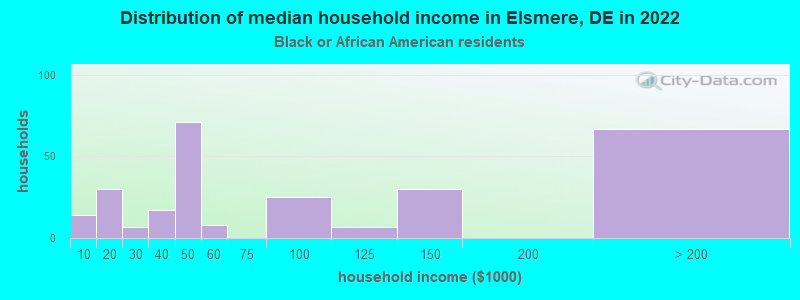
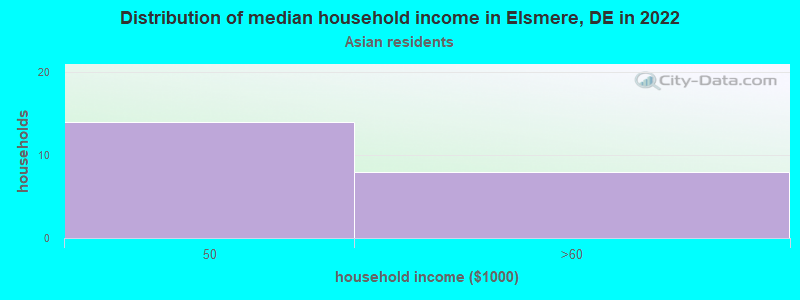
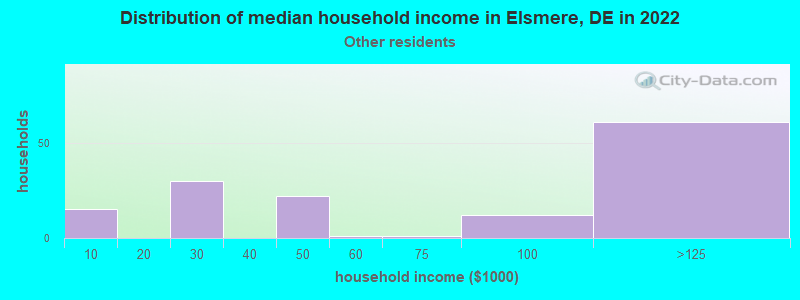
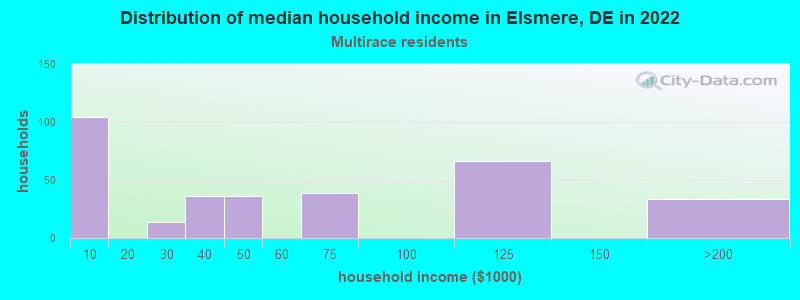
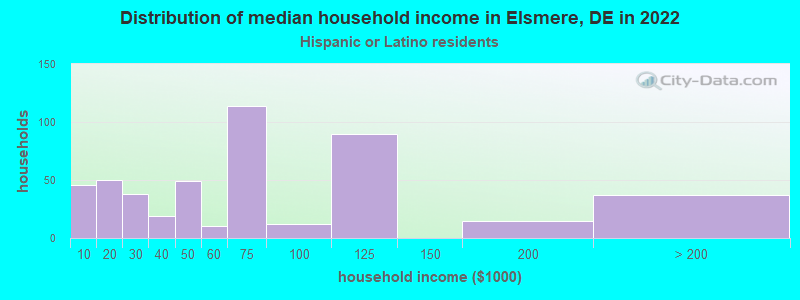
Income and house value in Elsmere Median household income in 2022 $72,854 White non-Hispanic householders$44,095 Two or more races householders$67,705 Hispanic or Latino race householdersMedian 2022 house value $212,137 White Non-Hispanic householders$179,981 Black or African American householders $449,953 Asian householders$226,056 Some other race householders$203,978 Two or more races householders$206,378 Hispanic or Latino householders
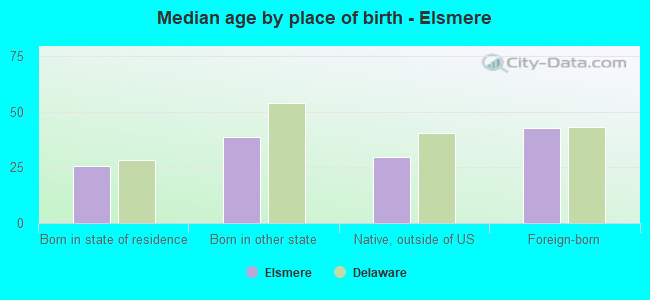
Median age by race in Elsmere
38.7 Median age for White residents34.7 41.1 25.7 Median age for Black or African American residents23.7 36.6 16.7 Median age for American Indian / Alaska Native residents-639,393,938.8 -659,673,659.0 20.5 Median age for Asian residents19.8 40.7 -666,666,666.0 Median age for Native Hawaiian / Pacific Islander residents-668,724,279.2 -670,599,802.7 24.0 Median age for Other race residents15.9 30.7 28.6 Median age for Two or more races residents36.4 24.2 46.0 Median age for White alone residents41.0 51.9 20.8 Median age for Hispanic or Latino residents22.4 20.6
Owner/renter occupied households by race in Elsmere
House owners and renters - White residents 1,121 70.3% Owner occupied473 29.7% Renter occupiedHouse owners and renters - Black or African American residents 163 59.0% Owner occupied114 41.0% Renter occupiedHouse owners and renters - American Indian / Alaska Native residents 22 100.0% Owner occupiedHouse owners and renters - Asian residents 21 100.0% Owner occupiedHouse owners and renters - Other race residents 89 75.4% Owner occupied29 24.6% Renter occupiedHouse owners and renters - Two or more races residents 217 61.3% Owner occupied137 38.7% Renter occupiedHouse owners and renters - White alone residents 1,087 73.4% Owner occupied394 26.6% Renter occupiedHouse owners and renters - Hispanic or Latino residents 262 52.2% Owner occupied239 47.8% Renter occupied
Language usage in Elsmere
English speakers - Total 75.4% of residents of Elsmere speak English at home.
20.8% of residents speak Spanish at home 751 60.2% Speak English very well497 39.8% Speak English less than very well2.9% of residents speak other language at home 122 70.9% Speak English very well50 29.1% Speak English less than very well
English speakers - Born in the United States 83.4% of residents of Elsmere speak English at home.
8.8% of residents speak Spanish at home 152 100.0% Speak English very well7.4% of residents speak other language at home 114 89.1% Speak English very well14 10.9% Speak English less than very well
English speakers - Native, born elsewhere 32.4% of residents of Elsmere speak English at home.
64.2% of residents speak Spanish at home 102 54.3% Speak English very well86 45.7% Speak English less than very well
English speakers - Foreign-born 20.0% of residents of Elsmere speak English at home.
70.0% of residents speak Spanish at home 239 40.1% Speak English very well357 59.9% Speak English less than very well4.3% of residents speak other language at home 37 100.0% Speak English less than very well
White (Caucasian) - Speak only English Native:
92.7% (3,041)Foreign-born:
14.2% (32)
White (Caucasian) - Speak another language Native:
4.5% (148)Foreign-born:
76.8% (171)
Black or African American - Speak only English Native:
91.3% (802)Foreign-born:
83.2% (49)
Asian - Speak another language Native:
100.0% (46)Foreign-born:
94.7% (38)
Other race - Speak another language Native:
73.2% (175)Foreign-born:
91.5% (71)
Two or more races - Speak only English Native:
64.2% (479)Foreign-born:
21.2% (114)
Two or more races - Speak another language Native:
39.0% (291)Foreign-born:
79.1% (427)
White alone - Speak only English Native:
98.8% (2,804)Foreign-born:
100.0% (35)
White alone - Speak another language Native:
1.3% (37)Foreign-born:
2.8% (1)
Hispanic or Latino - Speak only English Native:
40.8% (473)Foreign-born:
15.2% (107)
Hispanic or Latino - Speak another language Native:
59.1% (684)Foreign-born:
85.7% (602)
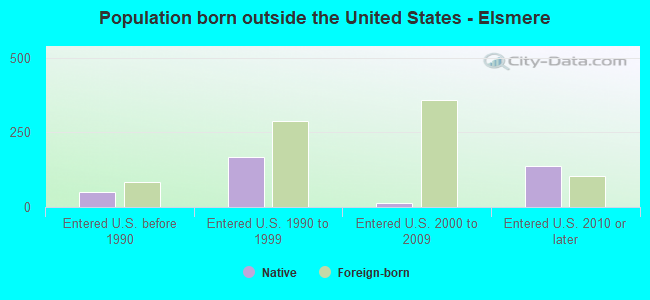
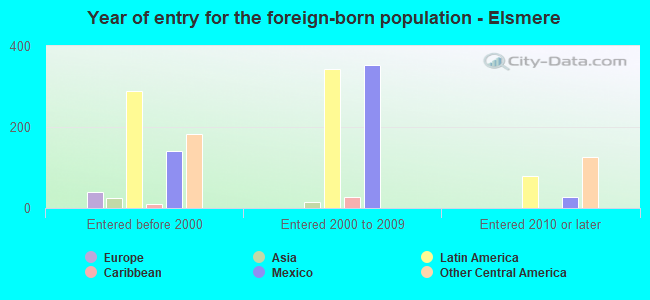
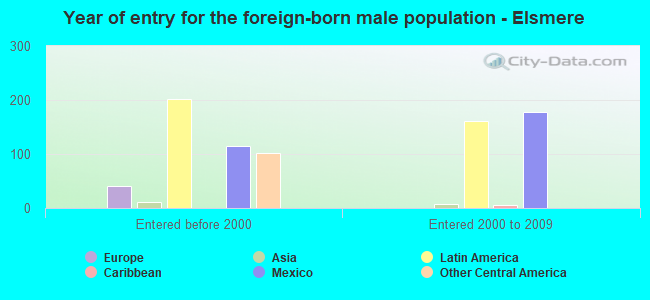
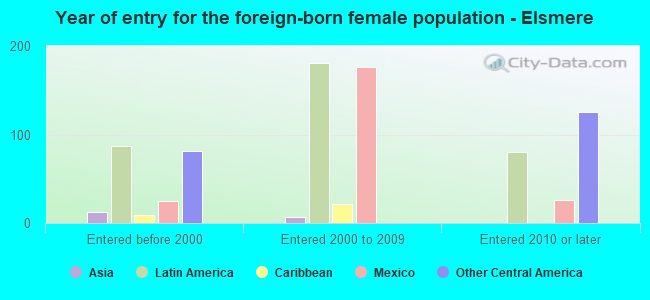
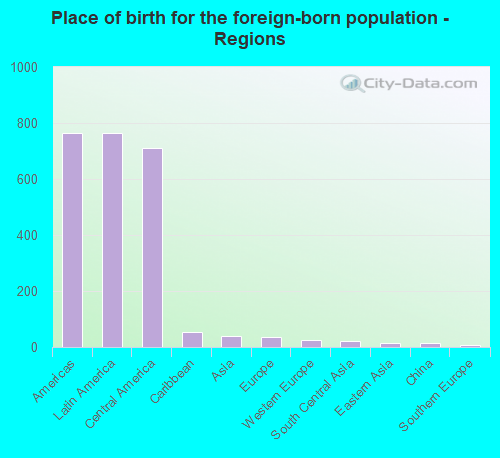
Foreign-born residents in Elsmere 840 residents are foreign born (12.1% Latin America ).
This city:
13.4%Delaware:
9.8%
Marital status for residents in Elsmere Marital status - White (Caucasian) population 15 years and over
Males 52.6% Never married29.8% Now married1.6% Separated3.7% Widowed12.3% DivorcedFemales 42.2% Never married29.8% Now married1.1% Separated6.8% Widowed20.0% DivorcedWomen who gave birth in the past 12 months Now married:
34.8% (22)Unmarried:
65.2% (41)
Women who did not give birth in the past 12 months Now married:
26.7% (170)Unmarried:
73.3% (466)
Marital status - Black or African American population 15 years and over
Males 75.1% Never married19.4% Now married2.9% Separated2.7% Widowed0.0% DivorcedFemales 52.2% Never married21.6% Now married4.9% Separated0.3% Widowed21.0% DivorcedWomen who gave birth in the past 12 months Now married:
100.0% (41)Unmarried:
0.0% (0)
Women who did not give birth in the past 12 months Now married:
13.4% (32)Unmarried:
86.6% (209)
Marital status - American Indian / Alaska Native population 15 years and over
Males 0.0% Never married100.0% Now married0.0% Separated0.0% Widowed0.0% DivorcedFemales 0.0% Never married100.0% Now married0.0% Separated0.0% Widowed0.0% DivorcedWomen who did not give birth in the past 12 months Now married:
100.0% (24)Unmarried:
0.0% (0)
Marital status - Asian population 15 years and over
Males 50.0% Never married50.0% Now married0.0% Separated0.0% Widowed0.0% DivorcedFemales 0.0% Never married100.0% Now married0.0% Separated0.0% Widowed0.0% DivorcedWomen who did not give birth in the past 12 months Now married:
100.0% (21)Unmarried:
0.0% (0)
Marital status - Other race population 15 years and over
Males 40.0% Never married58.9% Now married1.1% Separated0.0% Widowed0.0% DivorcedFemales 23.7% Never married64.9% Now married0.0% Separated11.3% Widowed0.0% DivorcedWomen who gave birth in the past 12 months Now married:
100.0% (8)Unmarried:
0.0% (0)
Women who did not give birth in the past 12 months Now married:
57.4% (40)Unmarried:
42.6% (30)
Marital status - Two or more races population 15 years and over
Males 83.7% Never married16.3% Now married0.0% Separated0.0% Widowed0.0% DivorcedFemales 65.9% Never married30.8% Now married0.0% Separated0.0% Widowed3.3% DivorcedWomen who did not give birth in the past 12 months Now married:
28.2% (105)Unmarried:
71.8% (268)
Marital status - White alone, not Hispanic / Latino population 15 years and over
Males 46.4% Never married31.1% Now married2.1% Separated4.7% Widowed15.7% DivorcedFemales 42.2% Never married27.1% Now married1.2% Separated7.5% Widowed22.0% DivorcedWomen who gave birth in the past 12 months Now married:
19.6% (11)Unmarried:
80.4% (43)
Women who did not give birth in the past 12 months Now married:
22.2% (125)Unmarried:
77.8% (439)
Marital status - Hispanic or Latino population 15 years and over
Males 73.4% Never married26.5% Now married0.1% Separated0.0% Widowed0.0% DivorcedFemales 50.0% Never married45.9% Now married0.0% Separated2.1% Widowed2.0% DivorcedWomen who gave birth in the past 12 months Now married:
100.0% (20)Unmarried:
0.0% (0)
Women who did not give birth in the past 12 months Now married:
40.9% (187)Unmarried:
59.1% (270)
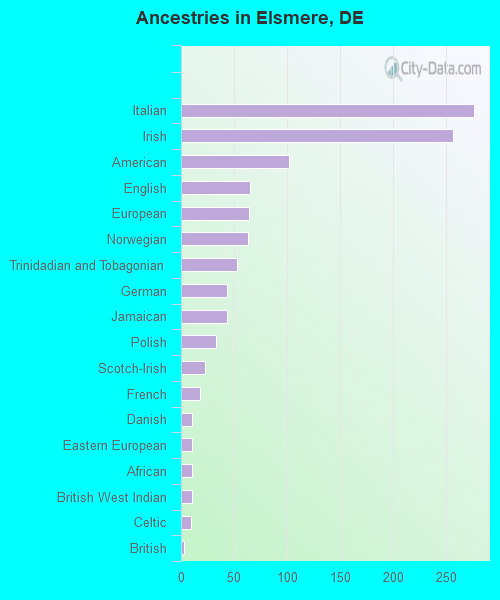
Ancestries in Elsmere
277 10.5% Italian257 9.7% Irish102 3.9% American65 2.5% English64 2.4% European63 2.4% Norwegian53 2.0% Trinidadian and Tobagonian43 1.6% German43 1.6% Jamaican33 1.2% Polish23 0.9% Scotch-Irish18 0.7% French10 0.4% Danish10 0.4% Eastern European10 0.4% African10 0.4% British West Indian9 0.3% Celtic3 0.1% British
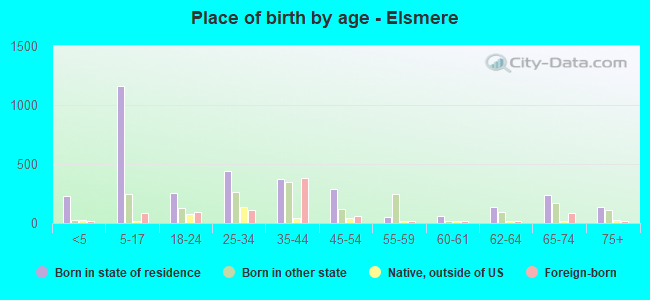
Children Nativity (place of birth) in Elsmere
Children under 6 years - Living with two parents Both parents native 65 100.0% NativeChildren under 6 years - Living with one parent Native parent 110 100.0% NativeForeign-born parent 87 47.7% Native95 52.3% Foreign-bornChildren 6 to 17 years - Living with two parents Both parents native 336 100.0% NativeBoth parents foreign-born 112 81.6% Native25 18.4% Foreign-bornOne native, one foreign-born parent 101 100.0% NativeChildren 6 to 17 years - Living with one parent Native parent 649 100.0% NativeForeign-born parent 162 53.6% Native140 46.4% Foreign-born
Grandparents responsible for own grandchildren in Elsmere
Grandparents (30 to 59 years) White / Caucasian 53 95.2% Responsible for grandchildren3 4.8% Not responsible for grandchildrenBlack or African American 7 100.0% Responsible for grandchildrenTwo or more races 104 100.0% Responsible for grandchildrenWhite alone, not Hispanic / Latino 61 100.0% Responsible for grandchildrenHispanic or Latino 52 93.8% Responsible for grandchildren3 6.2% Not responsible for grandchildrenGrandparents (60 years and over) White / Caucasian 11 100.0% Responsible for grandchildrenBlack or African American 80 100.0% Not responsible for grandchildrenTwo or more races 18 47.9% Responsible for grandchildren20 52.1% Not responsible for grandchildrenWhite alone, not Hispanic / Latino 11 100.0% Responsible for grandchildrenHispanic or Latino 8 48.6% Responsible for grandchildren9 51.4% Not responsible for grandchildren