Races in Elwood-Magnolia, New Jersey (NJ) Detailed Stats
Ancestries, Foreign-born residents, place of birth

Recent posts about races in Elwood-Magnolia, New Jersey on our local forum with over 2,400,000 registered users:
 | Atlantic/Cumberland/Cape May towns "missing" from City Data (0 replies) |
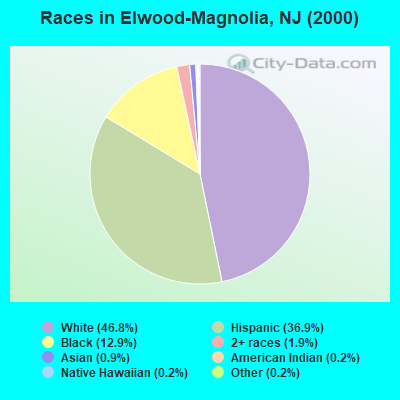
Race distribution in Elwood-Magnolia

- 65146.8%White alone
- 51336.9%Hispanic
- 18012.9%Black alone
- 271.9%Two or more races
- 120.9%Asian alone
- 30.2%Other race alone
- 30.2%American Indian alone
- 30.2%Native Hawaiian and Other
Pacific Islander alone
2000
2022
-
- 5,557,20966.0%White alone
- 1,117,19113.3%Hispanic
- 1,096,17113.0%Black alone
- 477,0125.7%Asian alone
- 133,6891.6%Two or more races
- 19,5650.2%Other race alone
- 11,3380.1%American Indian alone
- 2,1750.03%Native Hawaiian and Other
Pacific Islander alone

-
- 4,766,47651.5%White alone
- 2,028,47021.9%Hispanic
- 1,111,63212.0%Black alone
- 923,54610.0%Asian alone
- 332,2373.6%Two or more races
- 89,8471.0%Other race alone
- 8,5570.09%American Indian alone
- 9340.01%Native Hawaiian and Other
Pacific Islander alone

Income and house value in Elwood-Magnolia
- Median household income in 2022
- $84,408White non-Hispanic householders
- $87,272Black householders
- $73,591American Indian and Alaska Native householders
- $58,815Some other race householders
- $92,289Two or more races householders
- $62,503Hispanic or Latino race householders
- Median 2022 house value
- $195,570White Non-Hispanic householders
- $188,970Black or African American householders
- $158,901American Indian or Alaska Native householders
- $192,392Some other race householders
- $207,793Two or more races householders
- $198,015Hispanic or Latino householders
Household income for White non-Hispanic householders

Household income for Black householders

Household income for American Indian and Alaska Native householders

Household income for Two or more races householders

Household income for Hispanic or Latino race householders

Ancestries in Elwood-Magnolia

- 74445.1%Other
- 24614.9%Irish
- 21212.9%Italian
- 19912.1%German
- 754.5%United States
- 633.8%English
- 342.1%Dutch
- 332.0%Polish
- 201.2%French
- 120.7%Russian
- 110.7%Scotch-Irish

Zip codes: 08217.