Races in Endicott, New York (NY) Detailed Stats
Data:
Races - White alone (%)
Races - White alone (% change since 2000)
Races - Black alone (%)
Races - Black alone (% change since 2000)
Races - American Indian alone (%)
Races - American Indian alone (% change since 2000)
Races - Asian alone (%)
Races - Asian alone (% change since 2000)
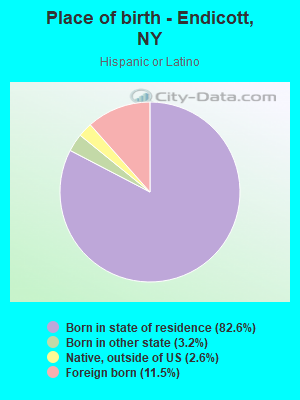
Races - Hispanic (%)
Races - Hispanic (% change since 2000)
Races - Native Hawaiian and Other Pacific Islander alone (%)
Races - Native Hawaiian and Other Pacific Islander alone (% change since 2000)
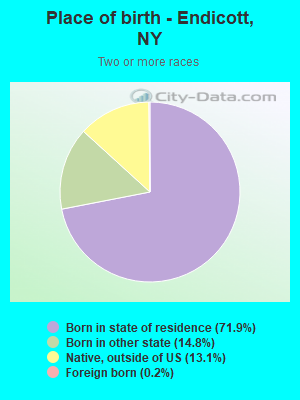
Races - Two or more races(%)
Races - Two or more races(% change since 2000)
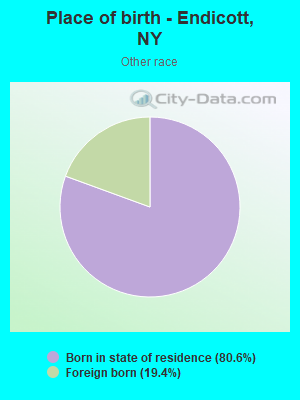
Races - Other race alone (%)
Races - Other race alone (% change since 2000)
Racial diversity
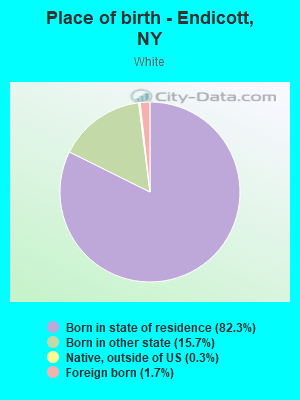
Place of birth - Born in state of residence (%)
Place of birth - Born in state of residence (%) - White
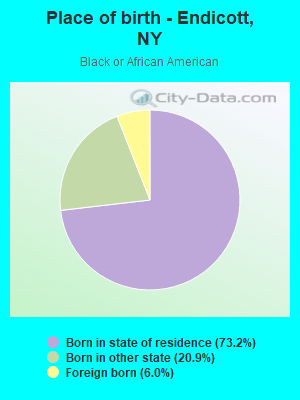
Place of birth - Born in state of residence (%) - Black or African American
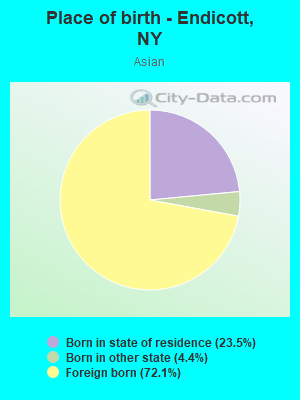
Place of birth - Born in state of residence (%) - Asian
Place of birth - Born in state of residence (%) - Hispanic or Latino
Place of birth - Born in state of residence (%) - American Indian and Alaska Native
Place of birth - Born in state of residence (%) - Multirace
Place of birth - Born in state of residence (%) - Other Race
Place of birth - Born in other state (%)
Place of birth - Born in other state (%) - White
Place of birth - Born in other state (%) - Black or African American
Place of birth - Born in other state (%) - Asian
Place of birth - Born in other state (%) - Hispanic or Latino
Place of birth - Born in other state (%) - American Indian and Alaska Native
Place of birth - Born in other state (%) - Multirace
Place of birth - Born in other state (%) - Other Race
Place of birth - Native, outside of US (%)
Place of birth - Native, outside of US (%) - White
Place of birth - Native, outside of US (%) - Black or African American
Place of birth - Native, outside of US (%) - Asian
Place of birth - Native, outside of US (%) - Hispanic or Latino
Place of birth - Native, outside of US (%) - American Indian and Alaska Native
Place of birth - Native, outside of US (%) - Multirace
Place of birth - Native, outside of US (%) - Other Race
Place of birth - Foreign born (%)
Place of birth - Foreign born (%) - White
Place of birth - Foreign born (%) - Black or African American
Place of birth - Foreign born (%) - Asian
Place of birth - Foreign born (%) - Hispanic or Latino
Place of birth - Foreign born (%) - American Indian and Alaska Native
Place of birth - Foreign born (%) - Multirace
Place of birth - Foreign born (%) - Other Race
Residents speaking English at home (%)
Residents speaking English at home - Born in the United States (%)
Residents speaking English at home - Native, born elsewhere (%)
Residents speaking English at home - Foreign born (%)
Residents speaking Spanish at home (%)
Residents speaking Spanish at home - Born in the United States (%)
Residents speaking Spanish at home - Native, born elsewhere (%)
Residents speaking Spanish at home - Foreign born (%)
Residents speaking other language at home (%)
Residents speaking other language at home - Born in the United States (%)
Residents speaking other language at home - Native, born elsewhere (%)
Residents speaking other language at home - Foreign born (%)
Marital status - Never married (%)
Marital status - Now married (%)
Marital status - Separated (%)
Marital status - Widowed (%)
Marital status - Divorced (%)
Ancestries Reported - Arab (%)
Ancestries Reported - Czech (%)
Ancestries Reported - Danish (%)
Ancestries Reported - Dutch (%)
Ancestries Reported - English (%)
Ancestries Reported - French (%)
Ancestries Reported - French Canadian (%)
Ancestries Reported - German (%)
Ancestries Reported - Greek (%)
Ancestries Reported - Hungarian (%)
Ancestries Reported - Irish (%)
Ancestries Reported - Italian (%)
Ancestries Reported - Lithuanian (%)
Ancestries Reported - Norwegian (%)
Ancestries Reported - Polish (%)
Ancestries Reported - Portuguese (%)
Ancestries Reported - Russian (%)
Ancestries Reported - Scotch-Irish (%)
Ancestries Reported - Scottish (%)
Ancestries Reported - Slovak (%)
Ancestries Reported - Subsaharan African (%)
Ancestries Reported - Swedish (%)
Ancestries Reported - Swiss (%)
Ancestries Reported - Ukrainian (%)
Ancestries Reported - United States (%)
Ancestries Reported - Welsh (%)
Ancestries Reported - West Indian (%)
Ancestries Reported - Other (%)
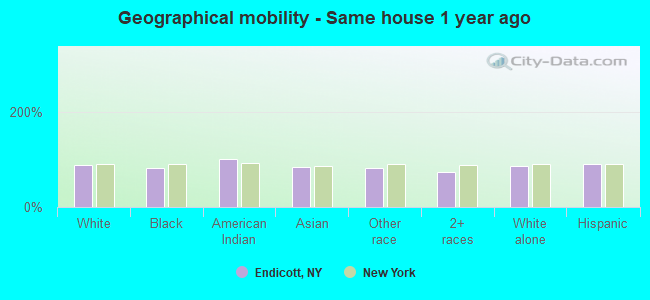
Geographical mobility - Same house 1 year ago (%)
Geographical mobility - Same house 1 year ago (%) - White
Geographical mobility - Same house 1 year ago (%) - Black or African American
Geographical mobility - Same house 1 year ago (%) - Asian
Geographical mobility - Same house 1 year ago (%) - Hispanic or Latino
Geographical mobility - Same house 1 year ago (%) - American Indian and Alaska Native
Geographical mobility - Same house 1 year ago (%) - Multirace
Geographical mobility - Same house 1 year ago (%) - Other Race
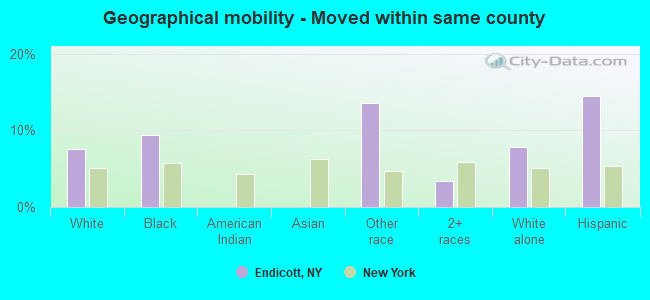
Geographical mobility - Moved within same county (%)
Geographical mobility - Moved within same county (%) - White
Geographical mobility - Moved within same county (%) - Black or African American
Geographical mobility - Moved within same county (%) - Asian
Geographical mobility - Moved within same county (%) - Hispanic or Latino
Geographical mobility - Moved within same county (%) - American Indian and Alaska Native
Geographical mobility - Moved within same county (%) - Multirace
Geographical mobility - Moved within same county (%) - Other Race
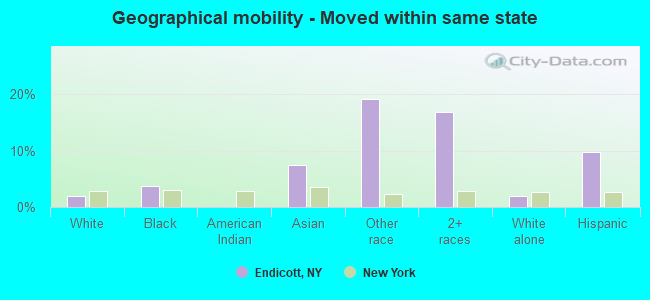
Geographical mobility - Moved from different county within same state (%)
Geographical mobility - Moved from different county within same state (%) - White
Geographical mobility - Moved from different county within same state (%) - Black or African American
Geographical mobility - Moved from different county within same state (%) - Asian
Geographical mobility - Moved from different county within same state (%) - Hispanic or Latino
Geographical mobility - Moved from different county within same state (%) - American Indian and Alaska Native
Geographical mobility - Moved from different county within same state (%) - Multirace
Geographical mobility - Moved from different county within same state (%) - Other Race
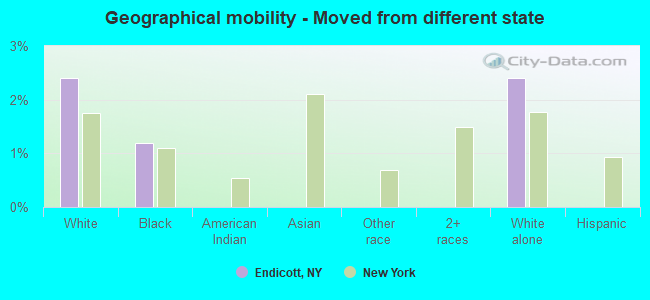
Geographical mobility - Moved from different state (%)
Geographical mobility - Moved from different state (%) - White
Geographical mobility - Moved from different state (%) - Black or African American
Geographical mobility - Moved from different state (%) - Asian
Geographical mobility - Moved from different state (%) - Hispanic or Latino
Geographical mobility - Moved from different state (%) - American Indian and Alaska Native
Geographical mobility - Moved from different state (%) - Multirace
Geographical mobility - Moved from different state (%) - Other Race
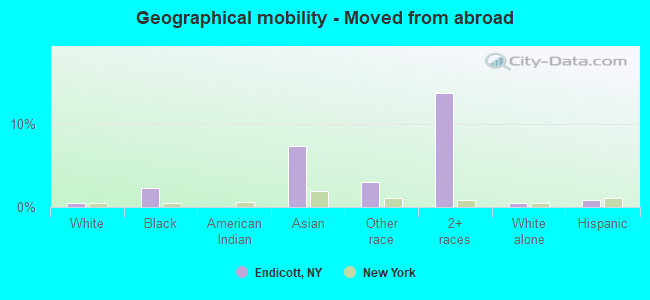
Geographical mobility - Moved from abroad (%)
Geographical mobility - Moved from abroad (%) - White
Geographical mobility - Moved from abroad (%) - Black or African American
Geographical mobility - Moved from abroad (%) - Asian
Geographical mobility - Moved from abroad (%) - Hispanic or Latino
Geographical mobility - Moved from abroad (%) - American Indian and Alaska Native
Geographical mobility - Moved from abroad (%) - Multirace
Geographical mobility - Moved from abroad (%) - Other Race
Place of birth for the foreign-born population - Ireland (%)
Place of birth for the foreign-born population - Denmark (%)
Place of birth for the foreign-born population - Norway (%)
Place of birth for the foreign-born population - Sweden (%)
Place of birth for the foreign-born population - United Kingdom (%)
Place of birth for the foreign-born population - England (%)
Place of birth for the foreign-born population - Scotland (%)
Place of birth for the foreign-born population - Other Northern Europe (%)
Place of birth for the foreign-born population - Austria (%)
Place of birth for the foreign-born population - Belgium (%)
Place of birth for the foreign-born population - France (%)
Place of birth for the foreign-born population - Germany (%)
Place of birth for the foreign-born population - Netherlands (%)
Place of birth for the foreign-born population - Switzerland (%)
Place of birth for the foreign-born population - Other Western Europe (%)
Place of birth for the foreign-born population - Greece (%)
Place of birth for the foreign-born population - Italy (%)
Place of birth for the foreign-born population - Portugal (%)
Place of birth for the foreign-born population - Spain (%)
Place of birth for the foreign-born population - Other Southern Europe (%)
Place of birth for the foreign-born population - Albania (%)
Place of birth for the foreign-born population - Belarus (%)
Place of birth for the foreign-born population - Bosnia and Herzegovina (%)
Place of birth for the foreign-born population - Bulgaria (%)
Place of birth for the foreign-born population - Croatia (%)
Place of birth for the foreign-born population - Czechoslovakia (%)
Place of birth for the foreign-born population - Hungary (%)
Place of birth for the foreign-born population - Latvia (%)
Place of birth for the foreign-born population - Lithuania (%)
Place of birth for the foreign-born population - North Macedonia (Macedonia) (%)
Place of birth for the foreign-born population - Moldova (%)
Place of birth for the foreign-born population - Poland (%)
Place of birth for the foreign-born population - Romania (%)
Place of birth for the foreign-born population - Russia (%)
Place of birth for the foreign-born population - Serbia (%)
Place of birth for the foreign-born population - Ukraine (%)
Place of birth for the foreign-born population - Other Eastern Europe (%)
Place of birth for the foreign-born population - China (%)
Place of birth for the foreign-born population - Hong Kong (%)
Place of birth for the foreign-born population - Taiwan (%)
Place of birth for the foreign-born population - Japan (%)
Place of birth for the foreign-born population - Korea (%)
Place of birth for the foreign-born population - Other Eastern Asia (%)
Place of birth for the foreign-born population - Afghanistan (%)
Place of birth for the foreign-born population - Bangladesh (%)
Place of birth for the foreign-born population - India (%)
Place of birth for the foreign-born population - Iran (%)
Place of birth for the foreign-born population - Kazakhstan (%)
Place of birth for the foreign-born population - Nepal (%)
Place of birth for the foreign-born population - Pakistan (%)
Place of birth for the foreign-born population - Sri Lanka (%)
Place of birth for the foreign-born population - Uzbekistan (%)
Place of birth for the foreign-born population - Other South Central Asia (%)
Place of birth for the foreign-born population - Burma (%)
Place of birth for the foreign-born population - Cambodia (%)
Place of birth for the foreign-born population - Indonesia (%)
Place of birth for the foreign-born population - Laos (%)
Place of birth for the foreign-born population - Malaysia (%)
Place of birth for the foreign-born population - Philippines (%)
Place of birth for the foreign-born population - Singapore (%)
Place of birth for the foreign-born population - Thailand (%)
Place of birth for the foreign-born population - Vietnam (%)
Place of birth for the foreign-born population - Other South Eastern Asia (%)
Place of birth for the foreign-born population - Armenia (%)
Place of birth for the foreign-born population - Iraq (%)
Place of birth for the foreign-born population - Israel (%)
Place of birth for the foreign-born population - Jordan (%)
Place of birth for the foreign-born population - Kuwait (%)
Place of birth for the foreign-born population - Lebanon (%)
Place of birth for the foreign-born population - Saudi Arabia (%)
Place of birth for the foreign-born population - Syria (%)
Place of birth for the foreign-born population - Turkey (%)
Place of birth for the foreign-born population - Yemen (%)
Place of birth for the foreign-born population - Other Western Asia (%)
Place of birth for the foreign-born population - Eritrea (%)
Place of birth for the foreign-born population - Ethiopia (%)
Place of birth for the foreign-born population - Kenya (%)
Place of birth for the foreign-born population - Somalia (%)
Place of birth for the foreign-born population - Uganda (%)
Place of birth for the foreign-born population - Zimbabwe (%)
Place of birth for the foreign-born population - Other Eastern Africa (%)
Place of birth for the foreign-born population - Cameroon (%)
Place of birth for the foreign-born population - Congo (%)
Place of birth for the foreign-born population - Democratic Republic of Congo (Zaire) (%)
Place of birth for the foreign-born population - Other Middle Africa (%)
Place of birth for the foreign-born population - Egypt (%)
Place of birth for the foreign-born population - Morocco (%)
Place of birth for the foreign-born population - Sudan (%)
Place of birth for the foreign-born population - Other Northern Africa (%)
Place of birth for the foreign-born population - South Africa (%)
Place of birth for the foreign-born population - Other Southern Africa (%)
Place of birth for the foreign-born population - Cabo Verde (%)
Place of birth for the foreign-born population - Ghana (%)
Place of birth for the foreign-born population - Liberia (%)
Place of birth for the foreign-born population - Nigeria (%)
Place of birth for the foreign-born population - Senegal (%)
Place of birth for the foreign-born population - Sierra Leone (%)
Place of birth for the foreign-born population - Other Western Africa (%)
Place of birth for the foreign-born population - Australia (%)
Place of birth for the foreign-born population - New Zealand (%)
Place of birth for the foreign-born population - Fiji (%)
Place of birth for the foreign-born population - Micronesia (%)
Place of birth for the foreign-born population - Bahamas (%)
Place of birth for the foreign-born population - Barbados (%)
Place of birth for the foreign-born population - Cuba (%)
Place of birth for the foreign-born population - Dominica (%)
Place of birth for the foreign-born population - Dominican Republic (%)
Place of birth for the foreign-born population - Grenada (%)
Place of birth for the foreign-born population - Haiti (%)
Place of birth for the foreign-born population - Jamaica (%)
Place of birth for the foreign-born population - St. Vincent and the Grenadines (%)
Place of birth for the foreign-born population - Trinidad and Tobago (%)
Place of birth for the foreign-born population - West Indies (%)
Place of birth for the foreign-born population - Other Caribbean (%)
Place of birth for the foreign-born population - Belize (%)
Place of birth for the foreign-born population - Costa Rica (%)
Place of birth for the foreign-born population - El Salvador (%)
Place of birth for the foreign-born population - Guatemala (%)
Place of birth for the foreign-born population - Honduras (%)
Place of birth for the foreign-born population - Mexico (%)
Place of birth for the foreign-born population - Nicaragua (%)
Place of birth for the foreign-born population - Panama (%)
Place of birth for the foreign-born population - Other Central America (%)
Place of birth for the foreign-born population - Argentina (%)
Place of birth for the foreign-born population - Bolivia (%)
Place of birth for the foreign-born population - Brazil (%)
Place of birth for the foreign-born population - Chile (%)
Place of birth for the foreign-born population - Colombia (%)
Place of birth for the foreign-born population - Ecuador (%)
Place of birth for the foreign-born population - Guyana (%)
Place of birth for the foreign-born population - Peru (%)
Place of birth for the foreign-born population - Uruguay (%)
Place of birth for the foreign-born population - Venezuela (%)
Place of birth for the foreign-born population - Other South America (%)
Place of birth for the foreign-born population - Canada (%)
Place of birth for the foreign-born population - Other Northern America (%)
Place of birth for the foreign-born population - Other (%)
Latest news about races in Endicott, NY collected exclusively by city-data.com from local newspapers, TV, and radio stations
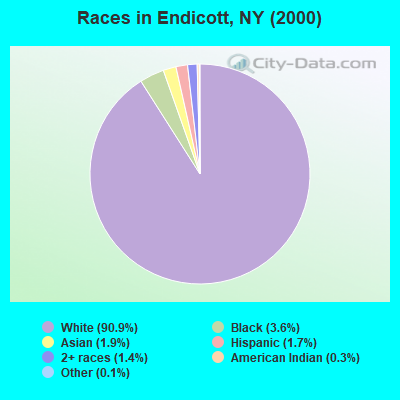
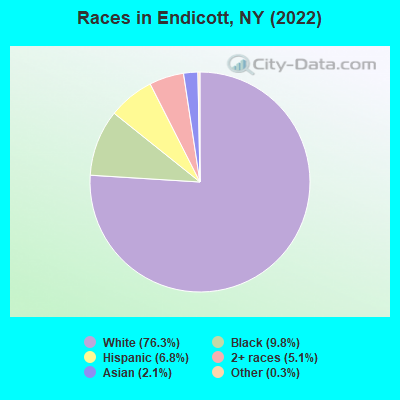
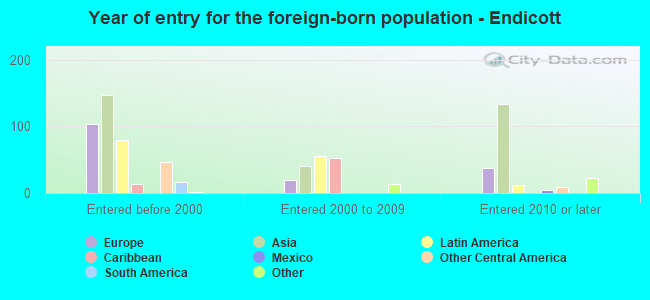
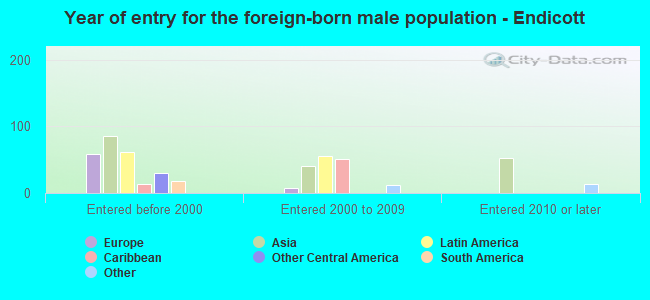
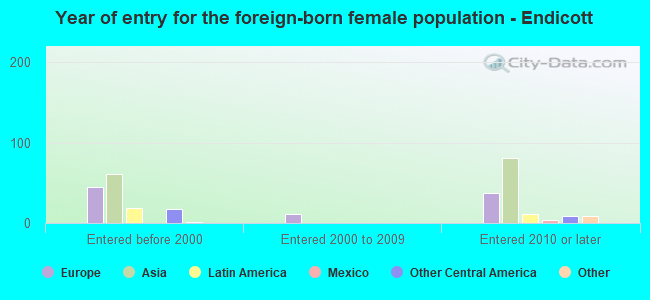
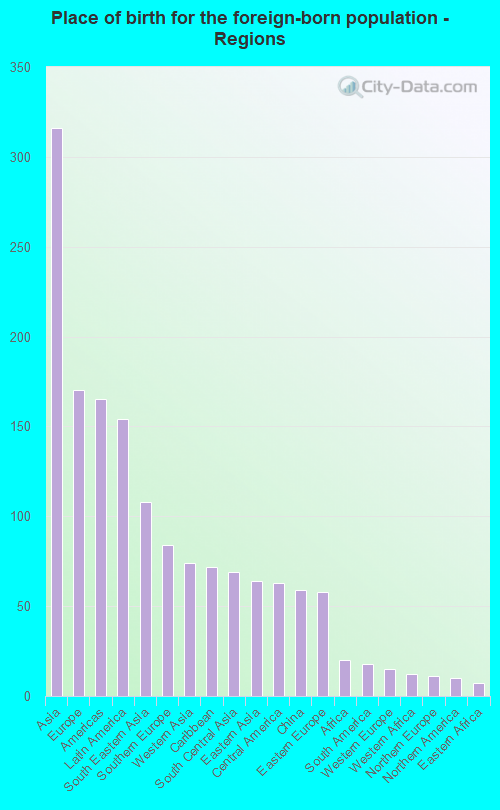
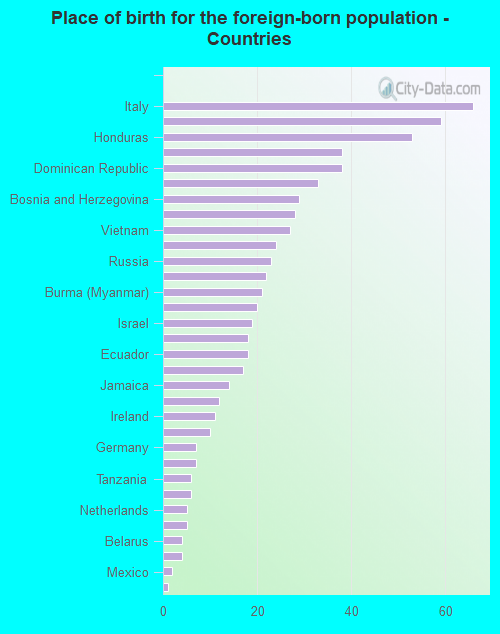
According to 2022 data, the most numerous races in Endicott, NY are White alone (10,265 residents), Hispanic (912 residents), and Black alone (1,320 residents). 95.4% of Endicott residents speak English at home. 5.0% of Endicott, NY residents are foreign-born (2.4% born in Asia, 1.3% born in Europe, 1.2% born in Latin America), which is 340.5% less than the foreign-born rate of 22.0% across the entire state of New York.
Race distribution in Endicott
2000 2022
11,760,981 62.0% White alone 2,867,583 15.1% Hispanic 2,812,623 14.8% Black alone 1,035,926 5.5% Asian alone 366,116 1.9% Two or more races 75,499 0.4% Other race alone 52,499 0.3% American Indian alone 5,230 0.03% Native Hawaiian and Other
10,408,933 52.9% White alone 3,867,299 19.7% Hispanic 2,633,840 13.4% Black alone 1,776,286 9.0% Asian alone 732,670 3.7% Two or more races 216,110 1.1% Other race alone 35,082 0.2% American Indian alone 6,931 0.04% Native Hawaiian and Other
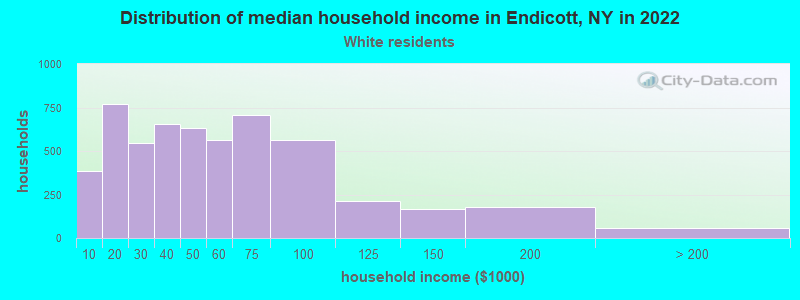
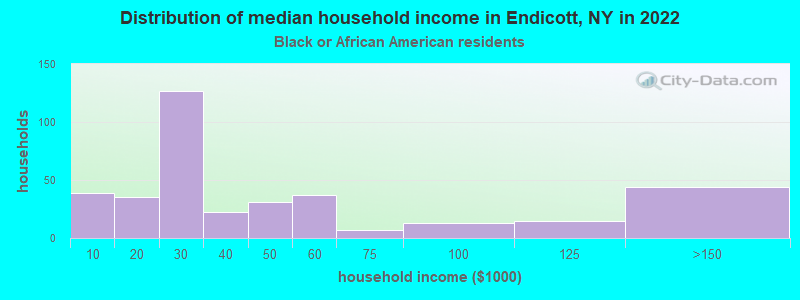
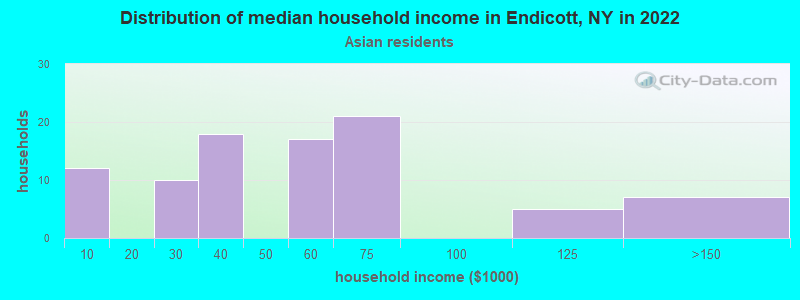
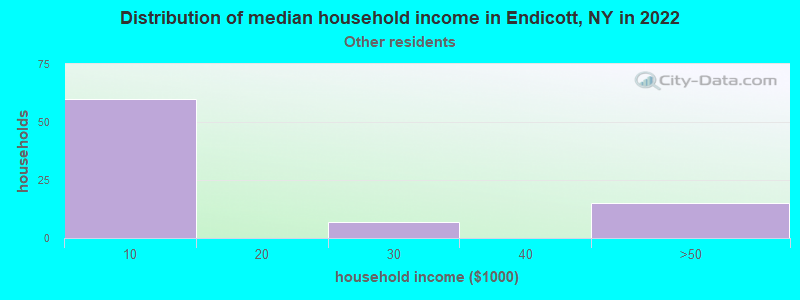
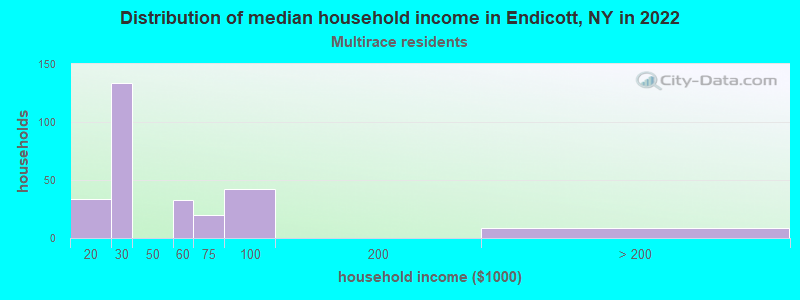
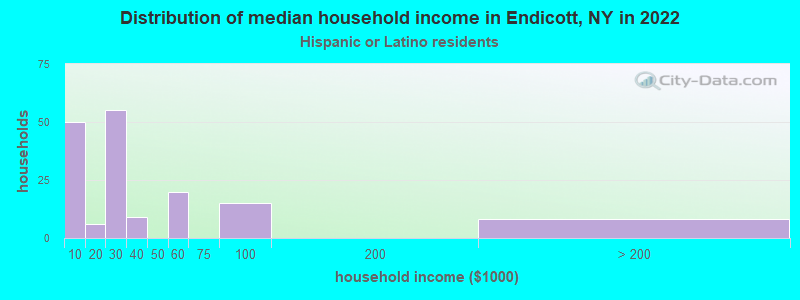
Income and house value in Endicott Median household income in 2022 $45,534 White non-Hispanic householders$23,064 Black householders$79,241 Asian householders$2,534 Some other race householders$36,312 Two or more races householders$12,909 Hispanic or Latino race householdersMedian 2022 house value $104,038 White Non-Hispanic householders$110,391 Black or African American householders $110,550 Asian householders$103,243 Some other race householders$96,413 Two or more races householders$103,243 Hispanic or Latino householders
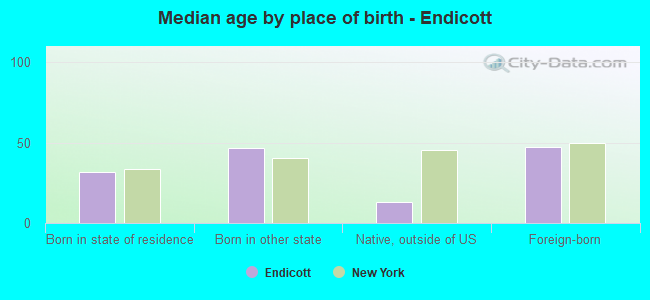
Median age by race in Endicott
41.3 Median age for White residents43.5 38.8 32.0 Median age for Black or African American residents32.0 29.4 65.0 Median age for American Indian / Alaska Native residents-665,450,121.0 -1,169,515,668.3 26.6 Median age for Asian residents28.1 19.4 -487,992,314.6 Median age for Native Hawaiian / Pacific Islander residents-477,502,295.2 -497,387,669.3 5.2 Median age for Other race residents21.9 0.0 21.9 Median age for Two or more races residents24.0 11.5 41.7 Median age for White alone residents43.2 39.2 23.7 Median age for Hispanic or Latino residents24.2 21.4
Owner/renter occupied households by race in Endicott
House owners and renters - White residents 2,311 41.4% Owner occupied3,267 58.6% Renter occupiedHouse owners and renters - Black or African American residents 14 3.7% Owner occupied376 96.3% Renter occupiedHouse owners and renters - American Indian / Alaska Native residents 27 100.0% Renter occupiedHouse owners and renters - Asian residents 44 47.3% Owner occupied49 52.7% Renter occupiedHouse owners and renters - Other race residents 12 13.6% Owner occupied75 86.4% Renter occupiedHouse owners and renters - Two or more races residents 65 27.8% Owner occupied169 72.2% Renter occupiedHouse owners and renters - White alone residents 2,313 41.2% Owner occupied3,297 58.8% Renter occupiedHouse owners and renters - Hispanic or Latino residents 27 14.4% Owner occupied162 85.6% Renter occupied
Language usage in Endicott
English speakers - Total 95.4% of residents of Endicott speak English at home.
1.7% of residents speak Spanish at home 148 66.7% Speak English very well74 33.3% Speak English less than very well3.2% of residents speak other language at home 260 64.7% Speak English very well142 35.3% Speak English less than very well
English speakers - Born in the United States 98.7% of residents of Endicott speak English at home.
1.5% of residents speak Spanish at home 29 100.0% Speak English very well1.3% of residents speak other language at home 14 56.0% Speak English very well11 44.0% Speak English less than very well
All residents speak only English at home
English speakers - Foreign-born 42.2% of residents of Endicott speak English at home.
8.8% of residents speak Spanish at home 11 19.6% Speak English very well45 80.4% Speak English less than very well47.8% of residents speak other language at home 167 54.6% Speak English very well139 45.4% Speak English less than very well
White (Caucasian) - Speak only English Native:
99.2% (9,566)Foreign-born:
50.0% (89)
White (Caucasian) - Speak another language Native:
0.9% (87)Foreign-born:
50.3% (89)
Black or African American - Speak only English Native:
92.9% (1,144)Foreign-born:
79.0% (65)
Black or African American - Speak another language Native:
5.6% (69)Foreign-born:
15.1% (13)
Asian - Speak another language Native:
72.2% (46)Foreign-born:
78.2% (163)
Other race - Speak only English Native:
100.0% (115)Foreign-born:
64.7% (44)
Other race - Speak another language Native:
5.8% (7)Foreign-born:
26.5% (18)
Two or more races - Speak another language Native:
6.4% (77)Foreign-born:
100.0% (4)
White alone - Speak only English Native:
99.2% (9,507)Foreign-born:
50.3% (92)
White alone - Speak another language Native:
0.9% (87)Foreign-born:
50.1% (92)
Hispanic or Latino - Speak only English Native:
89.7% (601)Foreign-born:
71.7% (79)
Hispanic or Latino - Speak another language Native:
15.0% (100)Foreign-born:
51.3% (56)
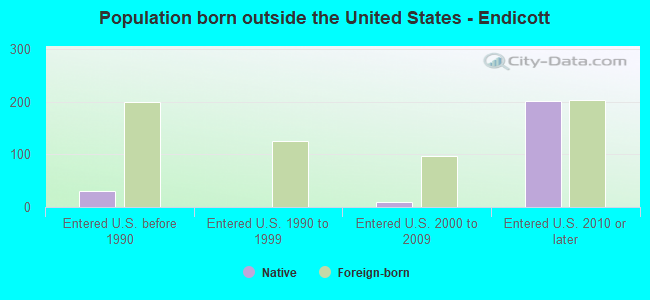
Foreign-born residents in Endicott 672 residents are foreign born (2.4% Asia , 1.3% Europe , 1.2% Latin America ).
This city:
5.0%New York:
22.6%
Marital status for residents in Endicott Marital status - White (Caucasian) population 15 years and over
Males 39.4% Never married35.2% Now married2.8% Separated4.2% Widowed18.4% DivorcedFemales 41.0% Never married31.6% Now married3.9% Separated8.3% Widowed15.2% DivorcedWomen who gave birth in the past 12 months Now married:
72.6% (82)Unmarried:
27.4% (31)
Women who did not give birth in the past 12 months Now married:
33.1% (922)Unmarried:
66.9% (1,862)
Marital status - Black or African American population 15 years and over
Males 58.4% Never married33.0% Now married4.5% Separated0.0% Widowed4.1% DivorcedFemales 50.9% Never married28.0% Now married5.6% Separated5.2% Widowed10.3% DivorcedWomen who did not give birth in the past 12 months Now married:
27.7% (85)Unmarried:
72.3% (222)
Marital status - American Indian / Alaska Native population 15 years and over
Males 100.0% Never married0.0% Now married0.0% Separated0.0% Widowed0.0% DivorcedFemales 0.0% Never married0.0% Now married0.0% Separated100.0% Widowed0.0% DivorcedMarital status - Asian population 15 years and over
Males 66.7% Never married21.7% Now married0.0% Separated0.0% Widowed11.6% DivorcedFemales 35.1% Never married40.5% Now married12.2% Separated5.4% Widowed6.8% DivorcedWomen who did not give birth in the past 12 months Now married:
69.2% (27)Unmarried:
30.8% (12)
Marital status - Other race population 15 years and over
Males 81.2% Never married18.8% Now married0.0% Separated0.0% Widowed0.0% DivorcedFemales 78.8% Never married21.2% Now married0.0% Separated0.0% Widowed0.0% DivorcedWomen who gave birth in the past 12 months Now married:
100.0% (8)Unmarried:
0.0% (0)
Women who did not give birth in the past 12 months Now married:
0.0% (0)Unmarried:
100.0% (29)
Marital status - Two or more races population 15 years and over
Males 71.0% Never married6.8% Now married0.0% Separated2.3% Widowed20.0% DivorcedFemales 69.4% Never married10.8% Now married0.0% Separated18.5% Widowed1.3% DivorcedWomen who did not give birth in the past 12 months Now married:
9.0% (12)Unmarried:
91.0% (118)
Marital status - White alone, not Hispanic / Latino population 15 years and over
Males 39.2% Never married35.2% Now married2.8% Separated4.3% Widowed18.5% DivorcedFemales 41.0% Never married31.5% Now married3.9% Separated8.3% Widowed15.3% DivorcedWomen who gave birth in the past 12 months Now married:
72.6% (83)Unmarried:
27.4% (31)
Women who did not give birth in the past 12 months Now married:
33.2% (931)Unmarried:
66.8% (1,871)
Marital status - Hispanic or Latino population 15 years and over
Males 79.5% Never married15.0% Now married0.0% Separated2.3% Widowed3.2% DivorcedFemales 60.9% Never married14.9% Now married12.6% Separated11.5% Widowed0.0% DivorcedWomen who gave birth in the past 12 months Now married:
100.0% (7)Unmarried:
0.0% (0)
Women who did not give birth in the past 12 months Now married:
23.7% (32)Unmarried:
76.3% (104)
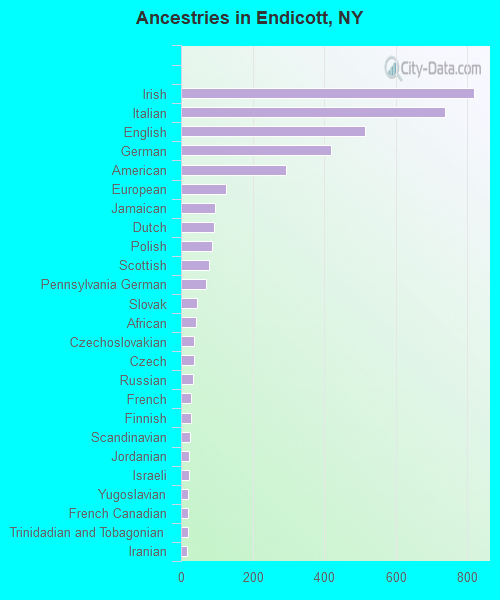
Ancestries in Endicott
820 16.2% Irish738 14.6% Italian513 10.1% English418 8.3% German293 5.8% American126 2.5% European94 1.9% Jamaican91 1.8% Dutch86 1.7% Polish77 1.5% Scottish71 1.4% Pennsylvania German46 0.9% Slovak41 0.8% African37 0.7% Czechoslovakian35 0.7% Czech33 0.7% Russian28 0.6% French27 0.5% Finnish25 0.5% Scandinavian23 0.5% Jordanian23 0.5% Israeli20 0.4% Yugoslavian20 0.4% French Canadian19 0.4% Trinidadian and Tobagonian16 0.3% Iranian15 0.3% Eastern European13 0.3% Slavic13 0.3% Nigerian12 0.2% Carpatho Rusyn10 0.2% Romanian10 0.2% Canadian7 0.1% Greek5 0.10% British5 0.10% Danish1 0.02% Kenyan
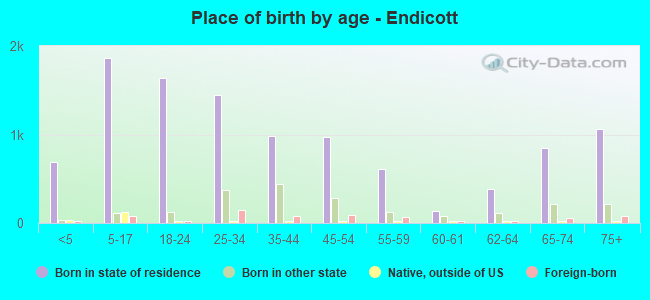
Children Nativity (place of birth) in Endicott
Children under 6 years - Living with two parents Both parents native 269 93.4% Native19 6.6% Foreign-bornBoth parents foreign-born 23 100.0% NativeOne native, one foreign-born parent 115 100.0% NativeChildren under 6 years - Living with one parent Native parent 369 100.0% NativeChildren 6 to 17 years - Living with two parents Both parents native 535 96.1% Native22 3.9% Foreign-bornBoth parents foreign-born 11 31.4% Native25 68.6% Foreign-bornOne native, one foreign-born parent 123 100.0% NativeChildren 6 to 17 years - Living with one parent Native parent 1,080 100.0% NativeForeign-born parent 27 50.4% Native27 49.6% Foreign-born
Grandparents responsible for own grandchildren in Endicott
Grandparents (30 to 59 years) White / Caucasian 23 32.8% Responsible for grandchildren48 67.2% Not responsible for grandchildrenWhite alone, not Hispanic / Latino 24 33.6% Responsible for grandchildren48 66.4% Not responsible for grandchildrenGrandparents (60 years and over) White / Caucasian 17 28.3% Responsible for grandchildren42 71.7% Not responsible for grandchildrenWhite alone, not Hispanic / Latino 17 27.5% Responsible for grandchildren44 72.5% Not responsible for grandchildren