Races in Endwell, New York (NY) Detailed Stats
Ancestries, Foreign-born residents, place of birth
Settings
X


Recent posts about races in Endwell, New York on our local forum with over 2,400,000 registered users:

Latest news about races in Endwell, NY collected exclusively by city-data.com from local newspapers, TV, and radio stations
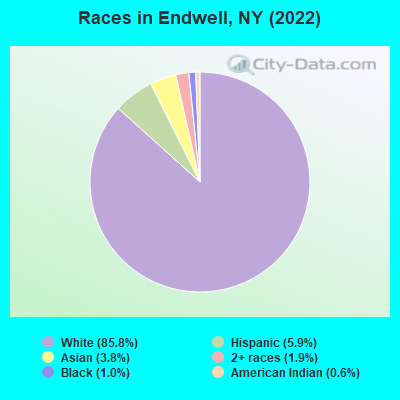
According to 2022 data, the most numerous races in Endwell, NY are White alone (10,082 residents), Hispanic (696 residents), and Black alone (121 residents). 96.4% of Endwell residents speak English at home. 4.3% of Endwell, NY residents are foreign-born (2.1% born in Asia, 1.2% born in Latin America, 0.9% born in Europe), which is 408.9% less than the foreign-born rate of 22.0% across the entire state of New York.
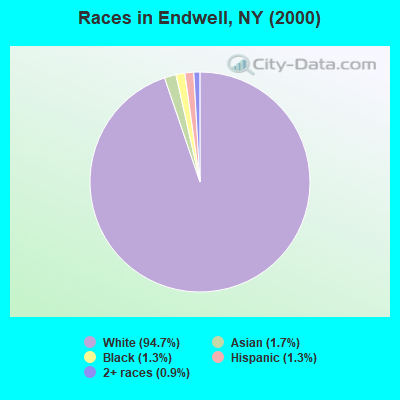
Race distribution in Endwell
2000
2022

- 11,08794.7%White alone
- 1981.7%Asian alone
- 1491.3%Hispanic
- 1531.3%Black alone
- 1010.9%Two or more races
- 90.08%American Indian alone
- 80.07%Other race alone
- 10.01%Native Hawaiian and Other
Pacific Islander alone
-
- 10,08285.8%White alone
- 6965.9%Hispanic
- 4493.8%Asian alone
- 2211.9%Two or more races
- 1211.0%Black alone
- 750.6%American Indian alone
2000
2022
-
- 11,760,98162.0%White alone
- 2,867,58315.1%Hispanic
- 2,812,62314.8%Black alone
- 1,035,9265.5%Asian alone
- 366,1161.9%Two or more races
- 75,4990.4%Other race alone
- 52,4990.3%American Indian alone
- 5,2300.03%Native Hawaiian and Other
Pacific Islander alone

-
- 10,408,93352.9%White alone
- 3,867,29919.7%Hispanic
- 2,633,84013.4%Black alone
- 1,776,2869.0%Asian alone
- 732,6703.7%Two or more races
- 216,1101.1%Other race alone
- 35,0820.2%American Indian alone
- 6,9310.04%Native Hawaiian and Other
Pacific Islander alone

Income and house value in Endwell
- Median household income in 2022
- $68,332White non-Hispanic householders
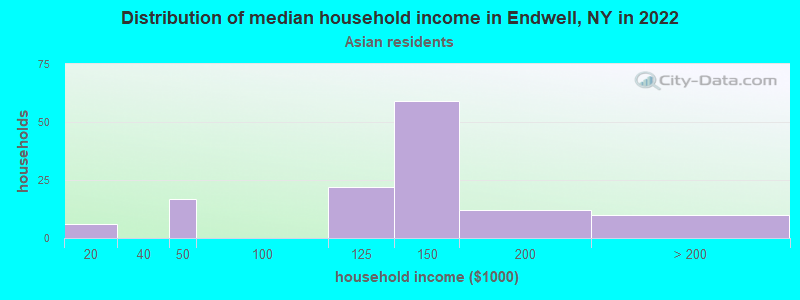
- $172,886Asian householders
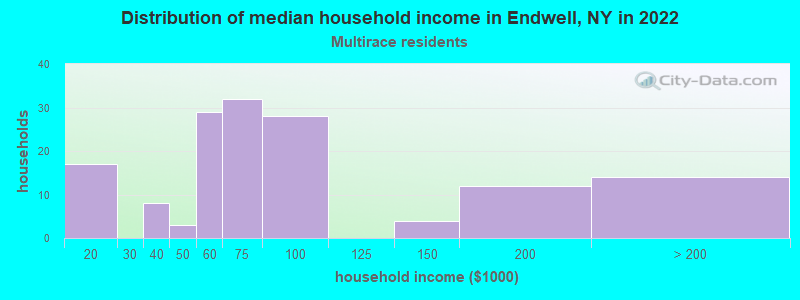
- $84,431Two or more races householders
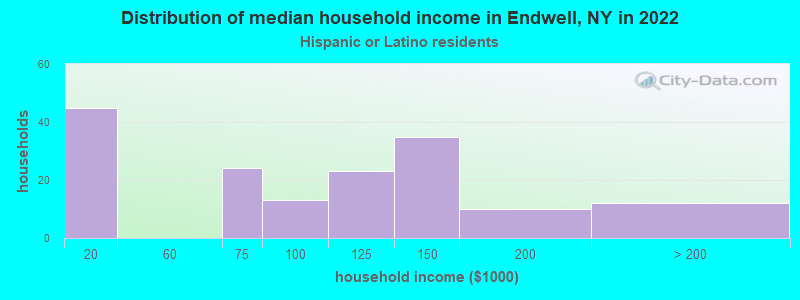
- $44,773Hispanic or Latino race householders
- Median 2022 house value
- $166,842White Non-Hispanic householders
- $161,635Black or African American householders
- $75,109American Indian or Alaska Native householders
- $279,206Asian householders
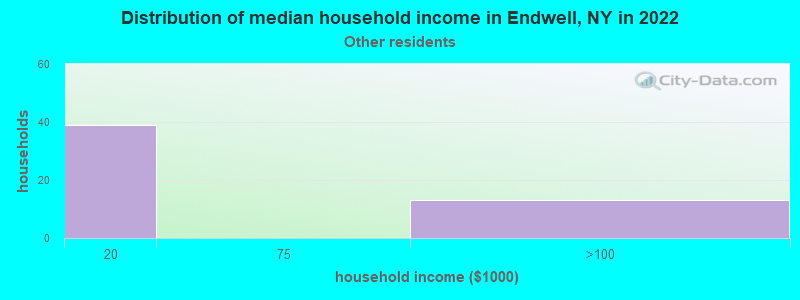
- $45,065Some other race householders
- $170,247Two or more races householders
- $148,616Hispanic or Latino householders
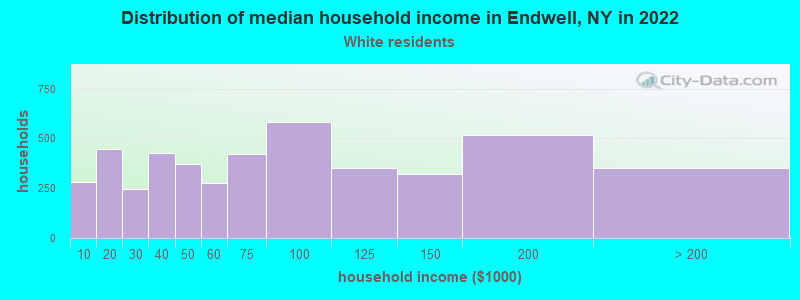
Household income for White non-Hispanic householders
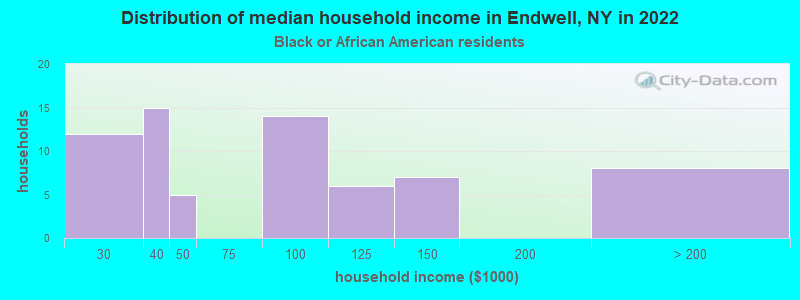
Household income for Black householders
Household income for Asian householders
Household income for Some other race householders
Household income for Two or more races householders
Household income for Hispanic or Latino race householders
Median age by race in Endwell
- 44.7Median age for White residents
- 39.6Males
- 48.7Females
- 45.0Median age for Black or African American residents
- 23.5Males
- 49.3Females
- 23.9Median age for American Indian / Alaska Native residents
- -665,450,121.0Males
- 15.6Females
- 33.4Median age for Asian residents
- 22.4Males
- 33.0Females
- -487,992,314.6Median age for Native Hawaiian / Pacific Islander residents
- -477,502,295.2Males
- -497,387,669.3Females
- -588,709,676.8Median age for Other race residents
- -580,645,160.7Males
- -780,423,279.6Females
- 40.5Median age for Two or more races residents
- 43.7Males
- 38.5Females
- 46.0Median age for White alone residents
- 40.9Males
- 48.7Females
- 29.8Median age for Hispanic or Latino residents
- 10.8Males
- 35.6Females
Owner/renter occupied households by race in Endwell
- House owners and renters - White residents
- 3,41174.2%Owner occupied
- 1,18725.8%Renter occupied
- House owners and renters - Black or African American residents
- 5372.0%Owner occupied
- 2128.0%Renter occupied
- House owners and renters - American Indian / Alaska Native residents
- 18100.0%Owner occupied
- House owners and renters - Asian residents
- 10579.5%Owner occupied
- 2720.5%Renter occupied
- House owners and renters - Other race residents
- 65100.0%Renter occupied
- House owners and renters - Two or more races residents
- 17887.0%Owner occupied
- 2713.0%Renter occupied
- House owners and renters - White alone residents
- 3,36174.0%Owner occupied
- 1,18226.0%Renter occupied
- House owners and renters - Hispanic or Latino residents
- 6438.0%Owner occupied
- 10462.0%Renter occupied
Language usage in Endwell
- English speakers - Total
- 96.4% of residents of Endwell speak English at home.
- 1.1% of residents speak Spanish at home
- 9979.8%Speak English very well
- 2520.2%Speak English less than very well
- 3.3% of residents speak other language at home
- 28980.3%Speak English very well
- 7119.7%Speak English less than very well
All residents speak only English at home
All residents speak only English at home
- English speakers - Foreign-born
- 26.2% of residents of Endwell speak English at home.
- 11.8% of residents speak Spanish at home
- 3968.4%Speak English very well
- 1831.6%Speak English less than very well
- 59.1% of residents speak other language at home
- 22076.9%Speak English very well
- 6623.1%Speak English less than very well
White (Caucasian) - Speak only English
| Native: | 100.0% (9,764) |
| Foreign-born: | 25.5% (29) |
White (Caucasian) - Speak another language
| Native: | 0.5% (44) |
| Foreign-born: | 74.4% (85) |
Black or African American - Speak only English
| Native: | 65.0% (63) |
| Foreign-born: | 22.2% (8) |
Black or African American - Speak another language
| Native: | 48.9% (47) |
| Foreign-born: | 79.1% (30) |
Asian - Speak only English
| Native: | 100.0% (217) |
| Foreign-born: | 32.0% (75) |
Asian - Speak another language
| Native: | 3.1% (7) |
| Foreign-born: | 68.4% (160) |
Two or more races - Speak only English
| Native: | 93.2% (370) |
| Foreign-born: | 6.9% (7) |
Two or more races - Speak another language
| Native: | 4.9% (20) |
| Foreign-born: | 94.1% (90) |
White alone - Speak only English
| Native: | 100.0% (9,547) |
| Foreign-born: | 31.9% (30) |
White alone - Speak another language
| Native: | 0.3% (32) |
| Foreign-born: | 68.1% (64) |
Hispanic or Latino - Speak another language
| Native: | 7.6% (36) |
| Foreign-born: | 75.5% (68) |
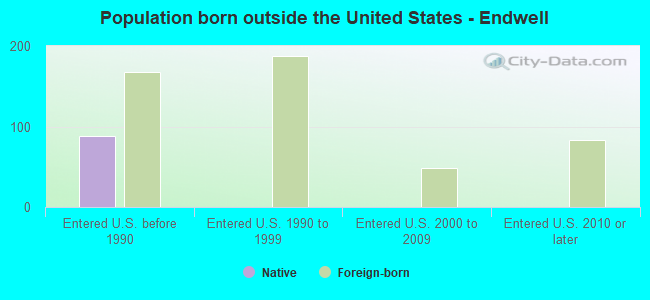
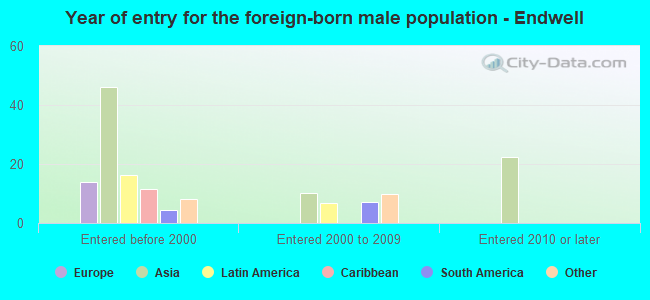
Foreign-born residents in Endwell
508 residents are foreign born (2.1% Asia, 1.2% Latin America, 0.9% Europe).
| This city: | 4.3% |
| New York: | 22.6% |


Marital status for residents in Endwell
Marital status - White (Caucasian) population 15 years and over
- Males
- 32.3%Never married
- 56.5%Now married
- 2.4%Separated
- 0.8%Widowed
- 8.1%Divorced
- Females
- 24.1%Never married
- 50.9%Now married
- 1.1%Separated
- 11.5%Widowed
- 12.5%Divorced
Women who gave birth in the past 12 months
| Now married: | 100.0% (146) |
| Unmarried: | 0.0% (0) |
Women who did not give birth in the past 12 months
| Now married: | 42.0% (733) |
| Unmarried: | 58.0% (1,011) |
Marital status - Black or African American population 15 years and over
- Males
- 49.1%Never married
- 50.9%Now married
- 0.0%Separated
- 0.0%Widowed
- 0.0%Divorced
- Females
- 16.4%Never married
- 16.4%Now married
- 0.0%Separated
- 47.3%Widowed
- 20.0%Divorced
Women who did not give birth in the past 12 months
| Now married: | 30.0% (8) |
| Unmarried: | 70.0% (19) |
Marital status - American Indian / Alaska Native population 15 years and over
- Males
- 0.0%Never married
- 100.0%Now married
- 0.0%Separated
- 0.0%Widowed
- 0.0%Divorced
- Females
- 58.8%Never married
- 41.2%Now married
- 0.0%Separated
- 0.0%Widowed
- 0.0%Divorced
Women who did not give birth in the past 12 months
| Now married: | 41.2% (10) |
| Unmarried: | 58.8% (14) |
Marital status - Asian population 15 years and over
- Males
- 66.4%Never married
- 33.6%Now married
- 0.0%Separated
- 0.0%Widowed
- 0.0%Divorced
- Females
- 53.7%Never married
- 40.7%Now married
- 0.0%Separated
- 3.2%Widowed
- 2.3%Divorced
Women who did not give birth in the past 12 months
| Now married: | 35.3% (60) |
| Unmarried: | 64.7% (109) |
Marital status - Other race population 15 years and over
- Males
- 0.0%Never married
- 0.0%Now married
- 100.0%Separated
- 0.0%Widowed
- 0.0%Divorced
- Females
- 0.0%Never married
- 0.0%Now married
- 100.0%Separated
- 0.0%Widowed
- 0.0%Divorced
Marital status - Two or more races population 15 years and over
- Males
- 56.8%Never married
- 25.2%Now married
- 0.0%Separated
- 10.8%Widowed
- 7.2%Divorced
- Females
- 71.8%Never married
- 22.1%Now married
- 0.0%Separated
- 0.0%Widowed
- 6.2%Divorced
Women who gave birth in the past 12 months
| Now married: | 0.0% (0) |
| Unmarried: | 100.0% (13) |
Women who did not give birth in the past 12 months
| Now married: | 23.5% (46) |
| Unmarried: | 76.5% (149) |
Marital status - White alone, not Hispanic / Latino population 15 years and over
- Males
- 32.2%Never married
- 56.5%Now married
- 2.4%Separated
- 0.8%Widowed
- 8.2%Divorced
- Females
- 24.3%Never married
- 50.7%Now married
- 1.1%Separated
- 11.5%Widowed
- 12.4%Divorced
Women who gave birth in the past 12 months
| Now married: | 100.0% (136) |
| Unmarried: | 0.0% (0) |
Women who did not give birth in the past 12 months
| Now married: | 42.3% (741) |
| Unmarried: | 57.7% (1,011) |
Marital status - Hispanic or Latino population 15 years and over
- Males
- 39.5%Never married
- 31.0%Now married
- 29.5%Separated
- 0.0%Widowed
- 0.0%Divorced
- Females
- 49.2%Never married
- 36.0%Now married
- 5.0%Separated
- 4.1%Widowed
- 5.8%Divorced
Women who gave birth in the past 12 months
| Now married: | 100.0% (12) |
| Unmarried: | 0.0% (0) |
Women who did not give birth in the past 12 months
| Now married: | 21.7% (32) |
| Unmarried: | 78.3% (116) |
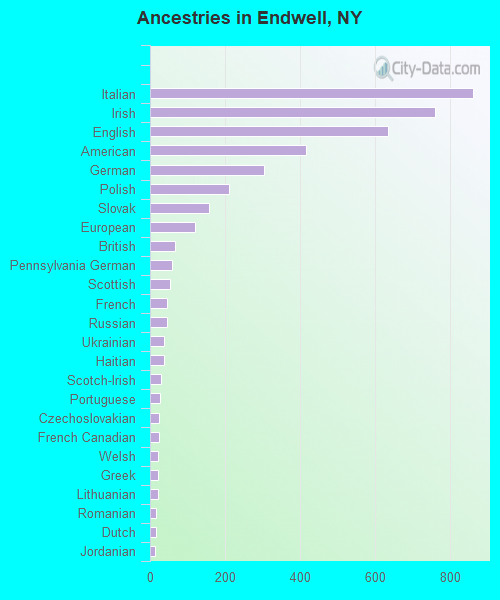
Ancestries in Endwell

- 86016.8%Italian
- 75914.8%Irish
- 63412.4%English
- 4168.1%American
- 3045.9%German
- 2104.1%Polish
- 1573.1%Slovak
- 1212.4%European
- 671.3%British
- 581.1%Pennsylvania German
- 541.1%Scottish
- 460.9%French
- 440.9%Russian
- 380.7%Ukrainian
- 370.7%Haitian
- 300.6%Scotch-Irish
- 270.5%Portuguese
- 250.5%Czechoslovakian
- 240.5%French Canadian
- 220.4%Welsh
- 210.4%Greek
- 200.4%Lithuanian
- 170.3%Romanian
- 160.3%Dutch
- 130.3%Jordanian
- 120.2%Egyptian
- 110.2%Slavic
- 100.2%Eastern European
- 100.2%Northern European
- 80.2%Slovene
- 70.1%Belgian
- 70.1%Scandinavian
- 50.10%Czech
- 50.10%Jamaican
- 40.08%Brazilian
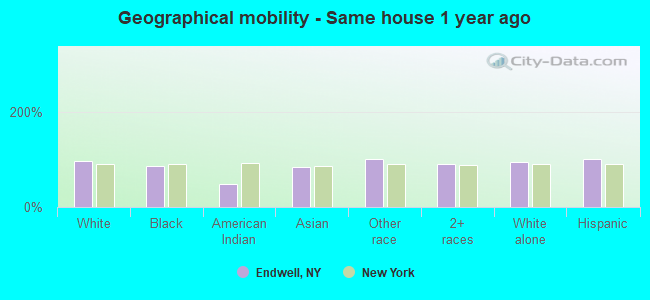
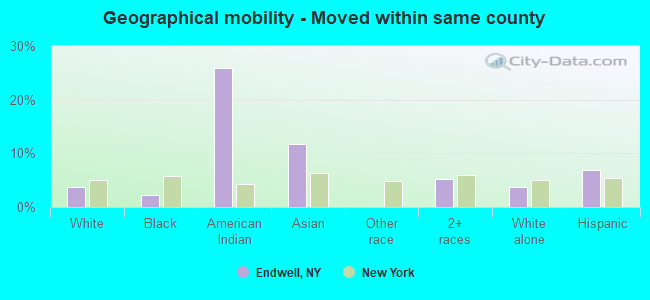
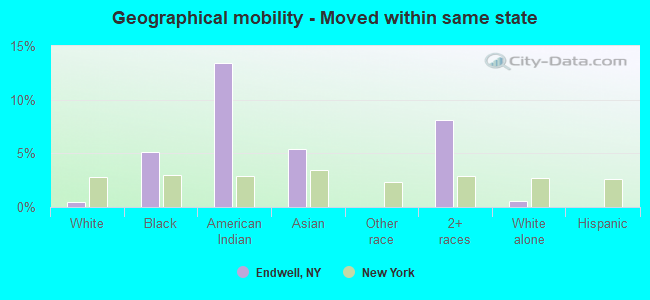
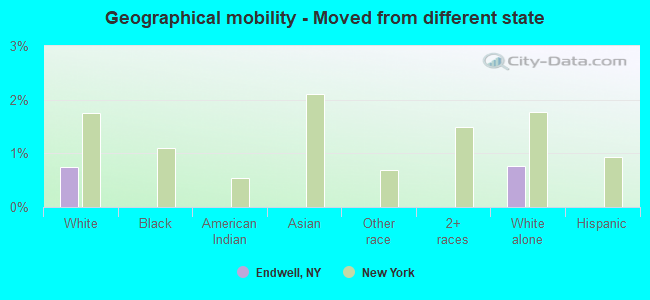
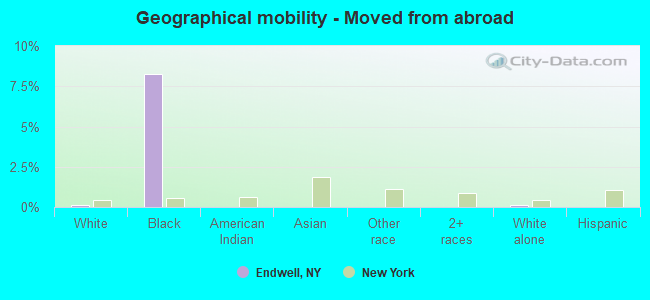
Geographical mobility in Endwell

- Same house 1 year ago
- 9,87295.8%White (Caucasian)
- 11384.9%Black or African American
- 3148.5%American Indian / Alaska Native
- 38384.1%Asian
- 76100.0%Other race
- 41191.1%Two or more races
- 9,52095.4%White alone, not Hispanic / Latino
- 770100.0%Hispanic or Latino
-
- Moved within same county
- 3833.7%White / Caucasian
- 32.2%Black or African American
- 1725.9%American Indian / Alaska Native
- 5411.8%Asian
- 235.2%Two or more races
- 3793.8%White alone, not Hispanic / Latino
- 456.8%Hispanic or Latino
-
- Moved within same state
- 490.5%White / Caucasian
- 75.1%Black or African American
- 913.4%American Indian / Alaska Native
- 255.4%Asian
- 378.1%Two or more races
- 510.5%White alone, not Hispanic / Latino
-
- Moved from different state
- 760.7%White / Caucasian
- 760.8%White alone, not Hispanic / Latino
-
- Moved from abroad
- 110.1%White
- 118.3%Black or African American
- 130.1%White alone, not Hispanic / Latino
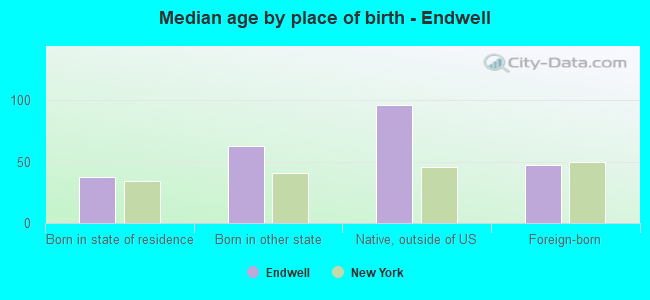
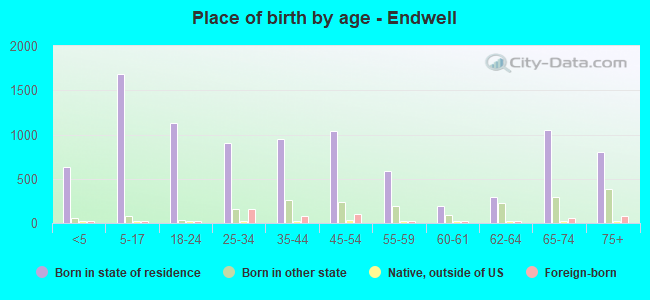
Children Nativity (place of birth) in Endwell
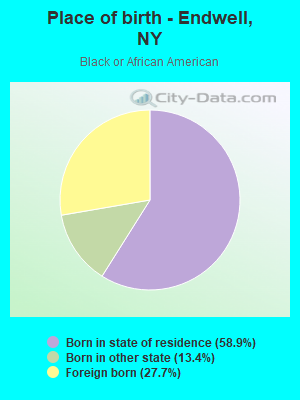
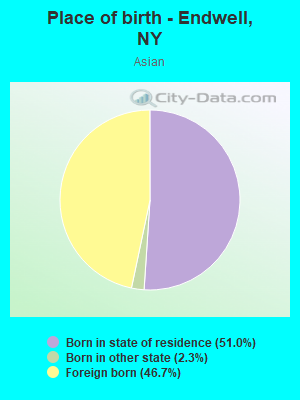
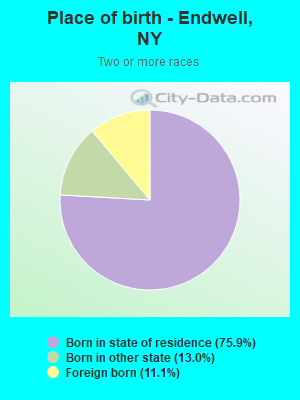
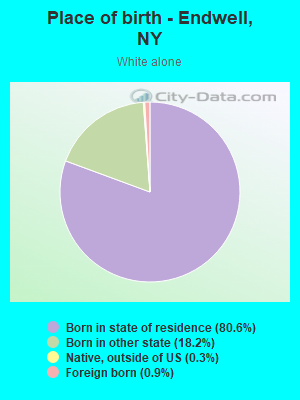
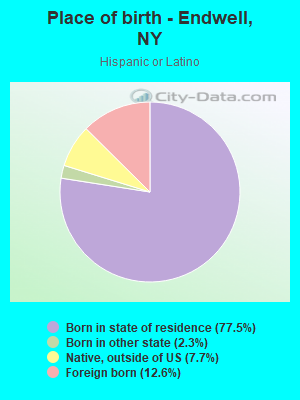
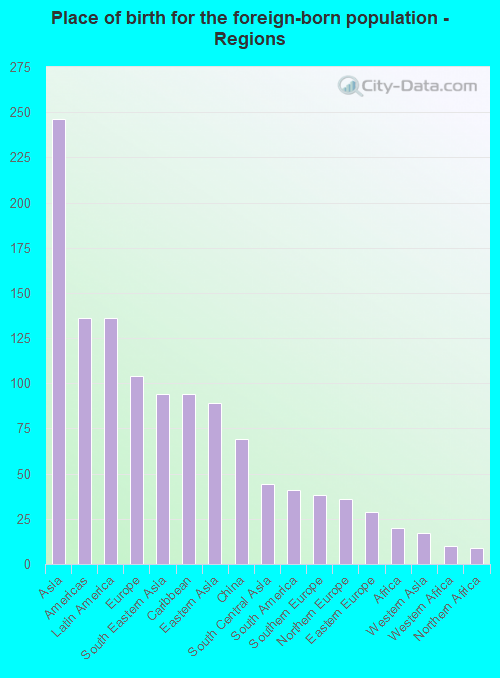
Place of birth for residents in Endwell
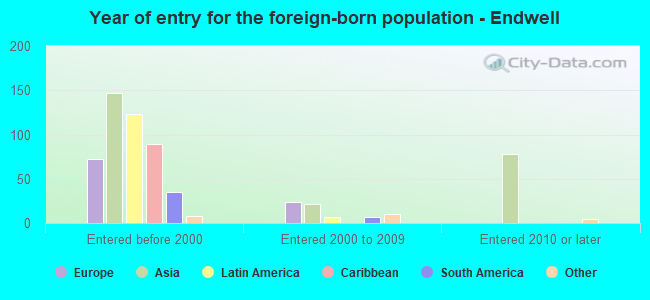
![Place of birth for the foreign-born population - Regions]()
- 246Asia
- 136Americas
- 136Latin America
- 104Europe
- 94South Eastern Asia
- 94Caribbean
- 89Eastern Asia
- 69China
- 44South Central Asia
- 41South America
- 38Southern Europe
- 36Northern Europe
- 29Eastern Europe
- 20Africa
- 17Western Asia
- 10Western Africa
- 9Northern Africa
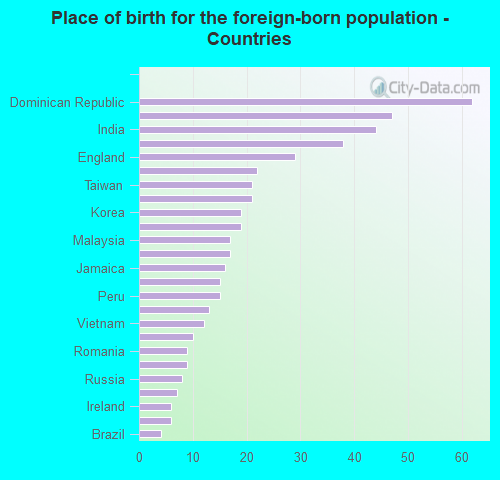
![Place of birth for the foreign-born population - Countries]()
- 62Dominican Republic
- 47China
- 44India
- 38Italy
- 29England
- 22Philippines
- 21Taiwan
- 21Thailand
- 19Korea
- 19Laos
- 17Malaysia
- 17Jordan
- 16Jamaica
- 15Haiti
- 15Peru
- 13Colombia
- 12Vietnam
- 10Ukraine
- 9Romania
- 9Egypt
- 8Russia
- 7Senegal
- 6Ireland
- 6Venezuela
- 4Brazil
Grandparents responsible for own grandchildren in Endwell
Zip codes: 13760.