Races in Ennis, Texas (TX) Detailed Stats
Data:
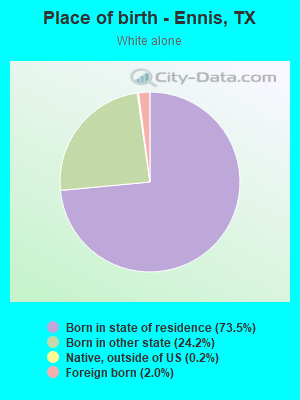
Races - White alone (%)
Races - White alone (% change since 2000)
Races - Black alone (%)
Races - Black alone (% change since 2000)
Races - American Indian alone (%)
Races - American Indian alone (% change since 2000)
Races - Asian alone (%)
Races - Asian alone (% change since 2000)
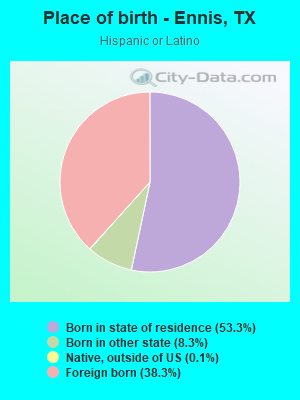
Races - Hispanic (%)
Races - Hispanic (% change since 2000)
Races - Native Hawaiian and Other Pacific Islander alone (%)
Races - Native Hawaiian and Other Pacific Islander alone (% change since 2000)
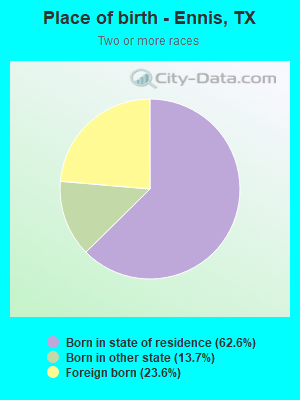
Races - Two or more races(%)
Races - Two or more races(% change since 2000)
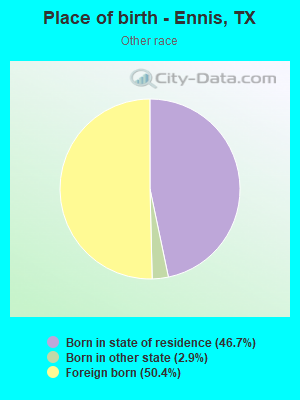
Races - Other race alone (%)
Races - Other race alone (% change since 2000)
Racial diversity
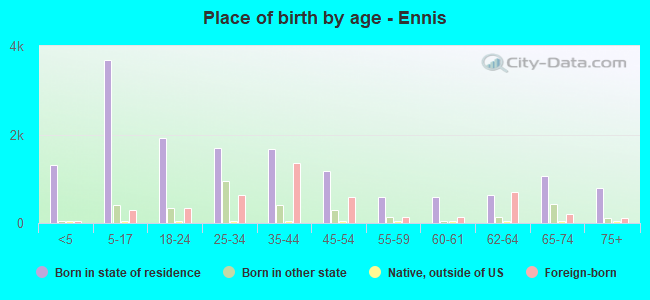
Place of birth - Born in state of residence (%)
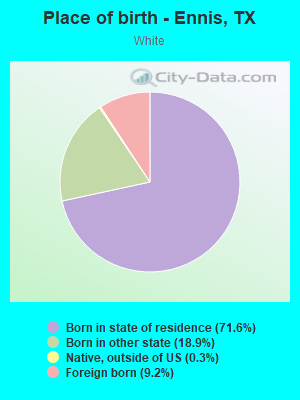
Place of birth - Born in state of residence (%) - White
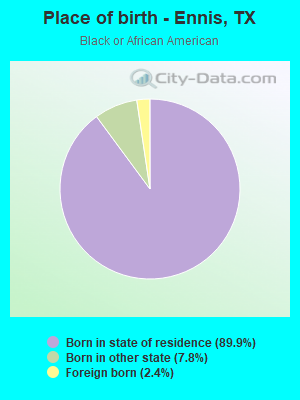
Place of birth - Born in state of residence (%) - Black or African American
Place of birth - Born in state of residence (%) - Asian
Place of birth - Born in state of residence (%) - Hispanic or Latino
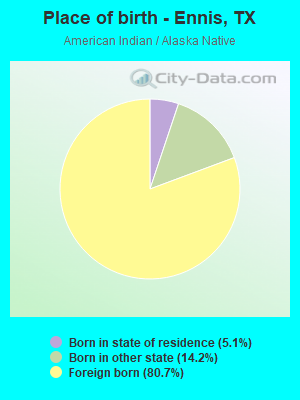
Place of birth - Born in state of residence (%) - American Indian and Alaska Native
Place of birth - Born in state of residence (%) - Multirace
Place of birth - Born in state of residence (%) - Other Race
Place of birth - Born in other state (%)
Place of birth - Born in other state (%) - White
Place of birth - Born in other state (%) - Black or African American
Place of birth - Born in other state (%) - Asian
Place of birth - Born in other state (%) - Hispanic or Latino
Place of birth - Born in other state (%) - American Indian and Alaska Native
Place of birth - Born in other state (%) - Multirace
Place of birth - Born in other state (%) - Other Race
Place of birth - Native, outside of US (%)
Place of birth - Native, outside of US (%) - White
Place of birth - Native, outside of US (%) - Black or African American
Place of birth - Native, outside of US (%) - Asian
Place of birth - Native, outside of US (%) - Hispanic or Latino
Place of birth - Native, outside of US (%) - American Indian and Alaska Native
Place of birth - Native, outside of US (%) - Multirace
Place of birth - Native, outside of US (%) - Other Race
Place of birth - Foreign born (%)
Place of birth - Foreign born (%) - White
Place of birth - Foreign born (%) - Black or African American
Place of birth - Foreign born (%) - Asian
Place of birth - Foreign born (%) - Hispanic or Latino
Place of birth - Foreign born (%) - American Indian and Alaska Native
Place of birth - Foreign born (%) - Multirace
Place of birth - Foreign born (%) - Other Race
Residents speaking English at home (%)
Residents speaking English at home - Born in the United States (%)
Residents speaking English at home - Native, born elsewhere (%)
Residents speaking English at home - Foreign born (%)
Residents speaking Spanish at home (%)
Residents speaking Spanish at home - Born in the United States (%)
Residents speaking Spanish at home - Native, born elsewhere (%)
Residents speaking Spanish at home - Foreign born (%)
Residents speaking other language at home (%)
Residents speaking other language at home - Born in the United States (%)
Residents speaking other language at home - Native, born elsewhere (%)
Residents speaking other language at home - Foreign born (%)
Marital status - Never married (%)
Marital status - Now married (%)
Marital status - Separated (%)
Marital status - Widowed (%)
Marital status - Divorced (%)
Ancestries Reported - Arab (%)
Ancestries Reported - Czech (%)
Ancestries Reported - Danish (%)
Ancestries Reported - Dutch (%)
Ancestries Reported - English (%)
Ancestries Reported - French (%)
Ancestries Reported - French Canadian (%)
Ancestries Reported - German (%)
Ancestries Reported - Greek (%)
Ancestries Reported - Hungarian (%)
Ancestries Reported - Irish (%)
Ancestries Reported - Italian (%)
Ancestries Reported - Lithuanian (%)
Ancestries Reported - Norwegian (%)
Ancestries Reported - Polish (%)
Ancestries Reported - Portuguese (%)
Ancestries Reported - Russian (%)
Ancestries Reported - Scotch-Irish (%)
Ancestries Reported - Scottish (%)
Ancestries Reported - Slovak (%)
Ancestries Reported - Subsaharan African (%)
Ancestries Reported - Swedish (%)
Ancestries Reported - Swiss (%)
Ancestries Reported - Ukrainian (%)
Ancestries Reported - United States (%)
Ancestries Reported - Welsh (%)
Ancestries Reported - West Indian (%)
Ancestries Reported - Other (%)
Geographical mobility - Same house 1 year ago (%)
Geographical mobility - Same house 1 year ago (%) - White
Geographical mobility - Same house 1 year ago (%) - Black or African American
Geographical mobility - Same house 1 year ago (%) - Asian
Geographical mobility - Same house 1 year ago (%) - Hispanic or Latino
Geographical mobility - Same house 1 year ago (%) - American Indian and Alaska Native
Geographical mobility - Same house 1 year ago (%) - Multirace
Geographical mobility - Same house 1 year ago (%) - Other Race
Geographical mobility - Moved within same county (%)
Geographical mobility - Moved within same county (%) - White
Geographical mobility - Moved within same county (%) - Black or African American
Geographical mobility - Moved within same county (%) - Asian
Geographical mobility - Moved within same county (%) - Hispanic or Latino
Geographical mobility - Moved within same county (%) - American Indian and Alaska Native
Geographical mobility - Moved within same county (%) - Multirace
Geographical mobility - Moved within same county (%) - Other Race
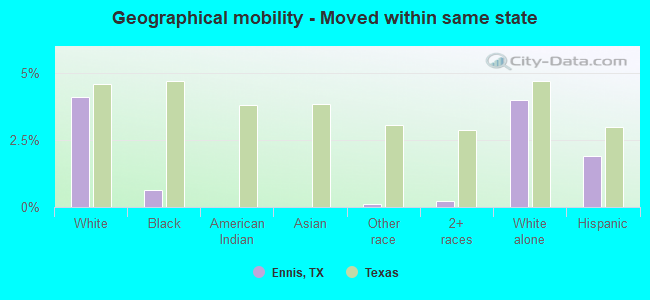
Geographical mobility - Moved from different county within same state (%)
Geographical mobility - Moved from different county within same state (%) - White
Geographical mobility - Moved from different county within same state (%) - Black or African American
Geographical mobility - Moved from different county within same state (%) - Asian
Geographical mobility - Moved from different county within same state (%) - Hispanic or Latino
Geographical mobility - Moved from different county within same state (%) - American Indian and Alaska Native
Geographical mobility - Moved from different county within same state (%) - Multirace
Geographical mobility - Moved from different county within same state (%) - Other Race
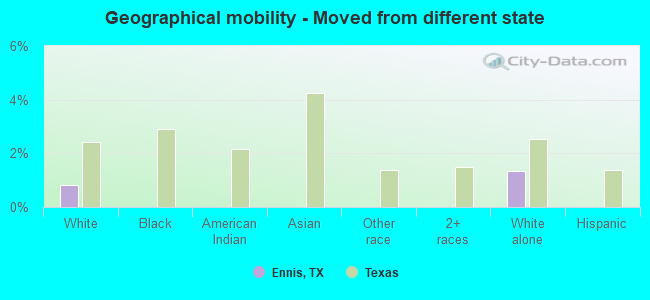
Geographical mobility - Moved from different state (%)
Geographical mobility - Moved from different state (%) - White
Geographical mobility - Moved from different state (%) - Black or African American
Geographical mobility - Moved from different state (%) - Asian
Geographical mobility - Moved from different state (%) - Hispanic or Latino
Geographical mobility - Moved from different state (%) - American Indian and Alaska Native
Geographical mobility - Moved from different state (%) - Multirace
Geographical mobility - Moved from different state (%) - Other Race
Geographical mobility - Moved from abroad (%)
Geographical mobility - Moved from abroad (%) - White
Geographical mobility - Moved from abroad (%) - Black or African American
Geographical mobility - Moved from abroad (%) - Asian
Geographical mobility - Moved from abroad (%) - Hispanic or Latino
Geographical mobility - Moved from abroad (%) - American Indian and Alaska Native
Geographical mobility - Moved from abroad (%) - Multirace
Geographical mobility - Moved from abroad (%) - Other Race
Place of birth for the foreign-born population - Ireland (%)
Place of birth for the foreign-born population - Denmark (%)
Place of birth for the foreign-born population - Norway (%)
Place of birth for the foreign-born population - Sweden (%)
Place of birth for the foreign-born population - United Kingdom (%)
Place of birth for the foreign-born population - England (%)
Place of birth for the foreign-born population - Scotland (%)
Place of birth for the foreign-born population - Other Northern Europe (%)
Place of birth for the foreign-born population - Austria (%)
Place of birth for the foreign-born population - Belgium (%)
Place of birth for the foreign-born population - France (%)
Place of birth for the foreign-born population - Germany (%)
Place of birth for the foreign-born population - Netherlands (%)
Place of birth for the foreign-born population - Switzerland (%)
Place of birth for the foreign-born population - Other Western Europe (%)
Place of birth for the foreign-born population - Greece (%)
Place of birth for the foreign-born population - Italy (%)
Place of birth for the foreign-born population - Portugal (%)
Place of birth for the foreign-born population - Spain (%)
Place of birth for the foreign-born population - Other Southern Europe (%)
Place of birth for the foreign-born population - Albania (%)
Place of birth for the foreign-born population - Belarus (%)
Place of birth for the foreign-born population - Bosnia and Herzegovina (%)
Place of birth for the foreign-born population - Bulgaria (%)
Place of birth for the foreign-born population - Croatia (%)
Place of birth for the foreign-born population - Czechoslovakia (%)
Place of birth for the foreign-born population - Hungary (%)
Place of birth for the foreign-born population - Latvia (%)
Place of birth for the foreign-born population - Lithuania (%)
Place of birth for the foreign-born population - North Macedonia (Macedonia) (%)
Place of birth for the foreign-born population - Moldova (%)
Place of birth for the foreign-born population - Poland (%)
Place of birth for the foreign-born population - Romania (%)
Place of birth for the foreign-born population - Russia (%)
Place of birth for the foreign-born population - Serbia (%)
Place of birth for the foreign-born population - Ukraine (%)
Place of birth for the foreign-born population - Other Eastern Europe (%)
Place of birth for the foreign-born population - China (%)
Place of birth for the foreign-born population - Hong Kong (%)
Place of birth for the foreign-born population - Taiwan (%)
Place of birth for the foreign-born population - Japan (%)
Place of birth for the foreign-born population - Korea (%)
Place of birth for the foreign-born population - Other Eastern Asia (%)
Place of birth for the foreign-born population - Afghanistan (%)
Place of birth for the foreign-born population - Bangladesh (%)
Place of birth for the foreign-born population - India (%)
Place of birth for the foreign-born population - Iran (%)
Place of birth for the foreign-born population - Kazakhstan (%)
Place of birth for the foreign-born population - Nepal (%)
Place of birth for the foreign-born population - Pakistan (%)
Place of birth for the foreign-born population - Sri Lanka (%)
Place of birth for the foreign-born population - Uzbekistan (%)
Place of birth for the foreign-born population - Other South Central Asia (%)
Place of birth for the foreign-born population - Burma (%)
Place of birth for the foreign-born population - Cambodia (%)
Place of birth for the foreign-born population - Indonesia (%)
Place of birth for the foreign-born population - Laos (%)
Place of birth for the foreign-born population - Malaysia (%)
Place of birth for the foreign-born population - Philippines (%)
Place of birth for the foreign-born population - Singapore (%)
Place of birth for the foreign-born population - Thailand (%)
Place of birth for the foreign-born population - Vietnam (%)
Place of birth for the foreign-born population - Other South Eastern Asia (%)
Place of birth for the foreign-born population - Armenia (%)
Place of birth for the foreign-born population - Iraq (%)
Place of birth for the foreign-born population - Israel (%)
Place of birth for the foreign-born population - Jordan (%)
Place of birth for the foreign-born population - Kuwait (%)
Place of birth for the foreign-born population - Lebanon (%)
Place of birth for the foreign-born population - Saudi Arabia (%)
Place of birth for the foreign-born population - Syria (%)
Place of birth for the foreign-born population - Turkey (%)
Place of birth for the foreign-born population - Yemen (%)
Place of birth for the foreign-born population - Other Western Asia (%)
Place of birth for the foreign-born population - Eritrea (%)
Place of birth for the foreign-born population - Ethiopia (%)
Place of birth for the foreign-born population - Kenya (%)
Place of birth for the foreign-born population - Somalia (%)
Place of birth for the foreign-born population - Uganda (%)
Place of birth for the foreign-born population - Zimbabwe (%)
Place of birth for the foreign-born population - Other Eastern Africa (%)
Place of birth for the foreign-born population - Cameroon (%)
Place of birth for the foreign-born population - Congo (%)
Place of birth for the foreign-born population - Democratic Republic of Congo (Zaire) (%)
Place of birth for the foreign-born population - Other Middle Africa (%)
Place of birth for the foreign-born population - Egypt (%)
Place of birth for the foreign-born population - Morocco (%)
Place of birth for the foreign-born population - Sudan (%)
Place of birth for the foreign-born population - Other Northern Africa (%)
Place of birth for the foreign-born population - South Africa (%)
Place of birth for the foreign-born population - Other Southern Africa (%)
Place of birth for the foreign-born population - Cabo Verde (%)
Place of birth for the foreign-born population - Ghana (%)
Place of birth for the foreign-born population - Liberia (%)
Place of birth for the foreign-born population - Nigeria (%)
Place of birth for the foreign-born population - Senegal (%)
Place of birth for the foreign-born population - Sierra Leone (%)
Place of birth for the foreign-born population - Other Western Africa (%)
Place of birth for the foreign-born population - Australia (%)
Place of birth for the foreign-born population - New Zealand (%)
Place of birth for the foreign-born population - Fiji (%)
Place of birth for the foreign-born population - Micronesia (%)
Place of birth for the foreign-born population - Bahamas (%)
Place of birth for the foreign-born population - Barbados (%)
Place of birth for the foreign-born population - Cuba (%)
Place of birth for the foreign-born population - Dominica (%)
Place of birth for the foreign-born population - Dominican Republic (%)
Place of birth for the foreign-born population - Grenada (%)
Place of birth for the foreign-born population - Haiti (%)
Place of birth for the foreign-born population - Jamaica (%)
Place of birth for the foreign-born population - St. Vincent and the Grenadines (%)
Place of birth for the foreign-born population - Trinidad and Tobago (%)
Place of birth for the foreign-born population - West Indies (%)
Place of birth for the foreign-born population - Other Caribbean (%)
Place of birth for the foreign-born population - Belize (%)
Place of birth for the foreign-born population - Costa Rica (%)
Place of birth for the foreign-born population - El Salvador (%)
Place of birth for the foreign-born population - Guatemala (%)
Place of birth for the foreign-born population - Honduras (%)
Place of birth for the foreign-born population - Mexico (%)
Place of birth for the foreign-born population - Nicaragua (%)
Place of birth for the foreign-born population - Panama (%)
Place of birth for the foreign-born population - Other Central America (%)
Place of birth for the foreign-born population - Argentina (%)
Place of birth for the foreign-born population - Bolivia (%)
Place of birth for the foreign-born population - Brazil (%)
Place of birth for the foreign-born population - Chile (%)
Place of birth for the foreign-born population - Colombia (%)
Place of birth for the foreign-born population - Ecuador (%)
Place of birth for the foreign-born population - Guyana (%)
Place of birth for the foreign-born population - Peru (%)
Place of birth for the foreign-born population - Uruguay (%)
Place of birth for the foreign-born population - Venezuela (%)
Place of birth for the foreign-born population - Other South America (%)
Place of birth for the foreign-born population - Canada (%)
Place of birth for the foreign-born population - Other Northern America (%)
Place of birth for the foreign-born population - Other (%)
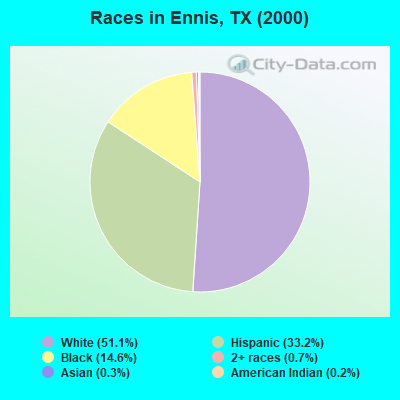
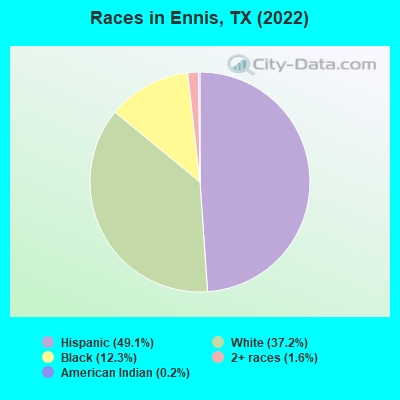
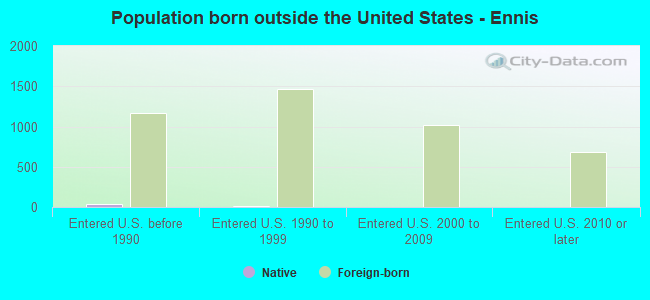
According to 2022 data, the most numerous races in Ennis, TX are Hispanic (11,044 residents), White alone (8,350 residents), and Black alone (2,772 residents). 63.5% of Ennis residents speak English at home. 15.7% of Ennis, TX residents are foreign-born (15.9% born in Latin America), which is 8.2% less than the foreign-born rate of 17.0% across the entire state of Texas.
Race distribution in Ennis
2000 2022
10,933,313 52.4% White alone 6,669,666 32.0% Hispanic 2,364,255 11.3% Black alone 554,445 2.7% Asian alone 230,567 1.1% Two or more races 68,859 0.3% American Indian alone 19,958 0.10% Other race alone 10,757 0.05% Native Hawaiian and Other
12,070,642 40.2% Hispanic 11,683,430 38.9% White alone 3,508,706 11.7% Black alone 1,608,173 5.4% Asian alone 956,560 3.2% Two or more races 125,763 0.4% Other race alone 47,023 0.2% American Indian alone 29,275 0.10% Native Hawaiian and Other
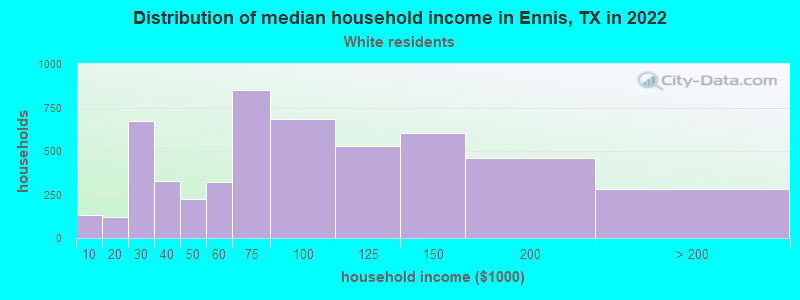
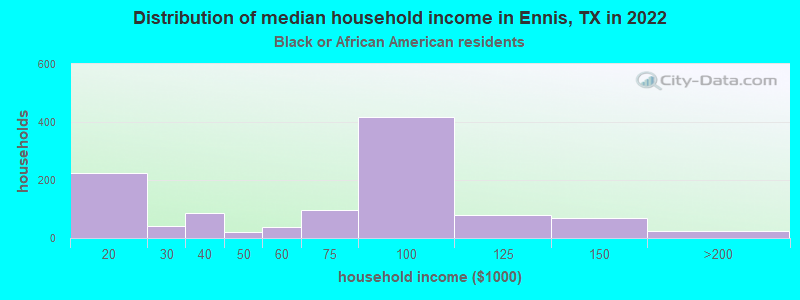
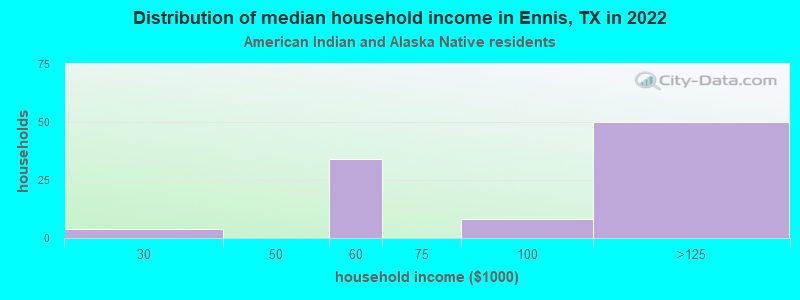
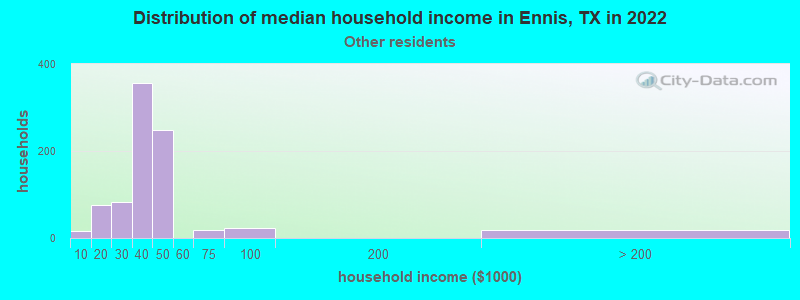
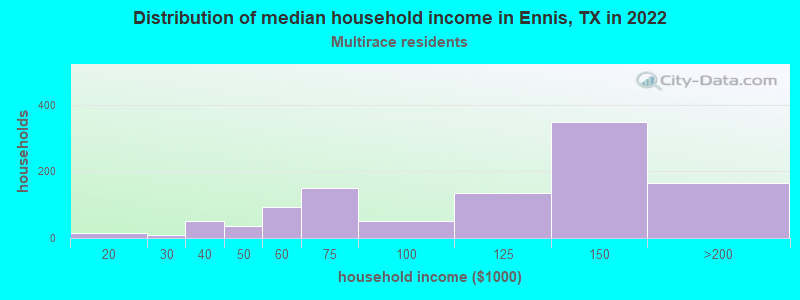
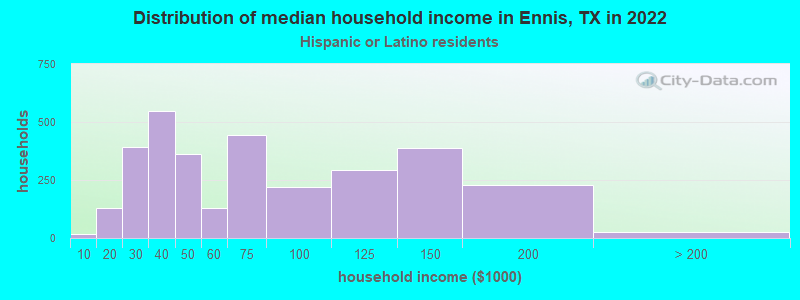
Income and house value in Ennis Median household income in 2022 $82,048 White non-Hispanic householders$63,315 Black householders$116,393 American Indian and Alaska Native householders$42,873 Some other race householders$100,290 Two or more races householders$64,290 Hispanic or Latino race householdersMedian 2022 house value $263,768 White Non-Hispanic householders$163,285 Black or African American householders$294,320 American Indian or Alaska Native householders $466,771 Asian householders$176,184 Some other race householders$183,992 Two or more races householders$182,634 Hispanic or Latino householders
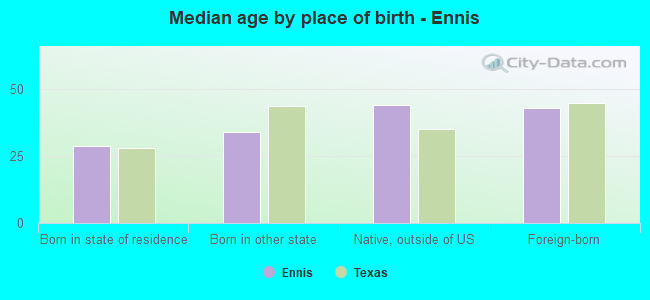
Median age by race in Ennis
35.4 Median age for White residents32.2 39.7 35.3 Median age for Black or African American residents33.7 38.4 58.0 Median age for American Indian / Alaska Native residents59.3 -663,374,484.9 -791,878,171.8 Median age for Asian residents-789,115,645.5 -862,447,256.5 -632,478,631.8 Median age for Native Hawaiian / Pacific Islander residents-666,666,666.0 -577,777,777.2 33.7 Median age for Other race residents32.1 33.4 24.7 Median age for Two or more races residents18.7 33.0 44.7 Median age for White alone residents42.3 47.9 29.0 Median age for Hispanic or Latino residents20.5 31.9
Owner/renter occupied households by race in Ennis
House owners and renters - White residents 3,226 62.5% Owner occupied1,932 37.5% Renter occupiedHouse owners and renters - Black or African American residents 523 54.3% Owner occupied440 45.7% Renter occupiedHouse owners and renters - American Indian / Alaska Native residents 61 53.4% Owner occupied53 46.6% Renter occupiedHouse owners and renters - Other race residents 753 85.7% Owner occupied125 14.3% Renter occupiedHouse owners and renters - Two or more races residents 988 90.5% Owner occupied104 9.5% Renter occupiedHouse owners and renters - White alone residents 2,480 65.7% Owner occupied1,294 34.3% Renter occupiedHouse owners and renters - Hispanic or Latino residents 2,354 75.8% Owner occupied753 24.2% Renter occupied
Language usage in Ennis
English speakers - Total 63.5% of residents of Ennis speak English at home.
36.4% of residents speak Spanish at home 4,823 62.5% Speak English very well2,894 37.5% Speak English less than very well1.3% of residents speak other language at home 236 88.1% Speak English very well32 11.9% Speak English less than very well
English speakers - Born in the United States 79.5% of residents of Ennis speak English at home.
23.6% of residents speak Spanish at home 724 94.8% Speak English very well40 5.2% Speak English less than very well
English speakers - Native, born elsewhere 17.8% of residents of Ennis speak English at home.
86.7% of residents speak Spanish at home 39 100.0% Speak English very well
English speakers - Foreign-born 4.7% of residents of Ennis speak English at home.
94.1% of residents speak Spanish at home 1,684 40.8% Speak English very well2,443 59.2% Speak English less than very well3.3% of residents speak other language at home 134 93.7% Speak English very well9 6.3% Speak English less than very well
White (Caucasian) - Speak only English Native:
83.2% (8,776)Foreign-born:
9.2% (105)
White (Caucasian) - Speak another language Native:
14.9% (1,576)Foreign-born:
85.5% (977)
Black or African American - Speak only English Native:
100.0% (2,105)Foreign-born:
80.0% (55)
Other race - Speak only English Native:
31.4% (347)Foreign-born:
3.0% (35)
Other race - Speak another language Native:
58.3% (645)Foreign-born:
90.2% (1,051)
Two or more races - Speak another language Native:
49.9% (1,510)Foreign-born:
100.0% (1,018)
White alone - Speak only English Native:
97.1% (7,504)Foreign-born:
33.7% (57)
White alone - Speak another language Native:
3.0% (235)Foreign-born:
71.9% (121)
Hispanic or Latino - Speak only English Native:
43.7% (2,776)Foreign-born:
0.8% (36)
Hispanic or Latino - Speak another language Native:
55.9% (3,548)Foreign-born:
94.1% (4,090)
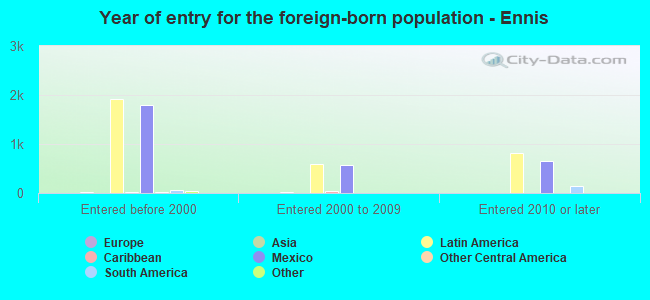
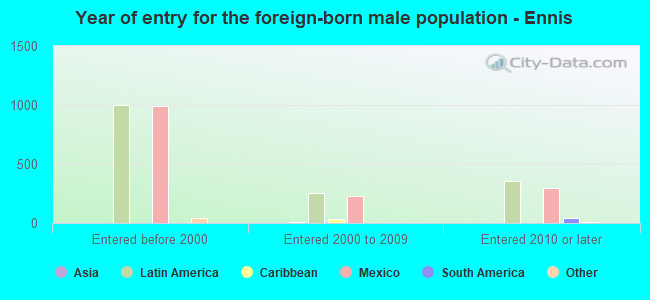
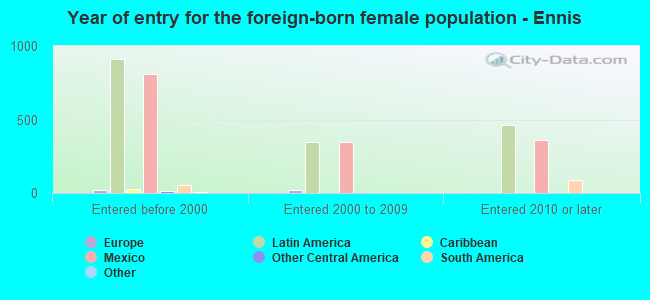
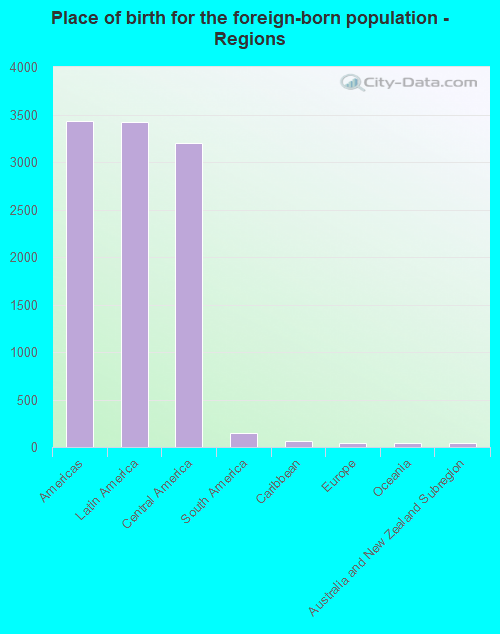
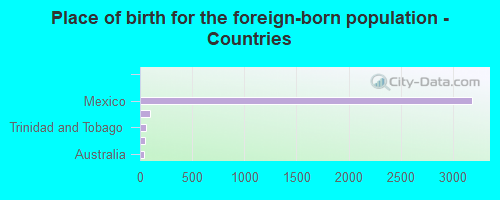
Foreign-born residents in Ennis 3,531 residents are foreign born (15.9% Latin America ).
This city:
15.7%Texas:
17.1%
Marital status for residents in Ennis Marital status - White (Caucasian) population 15 years and over
Males 35.3% Never married55.2% Now married0.0% Separated1.2% Widowed8.4% DivorcedFemales 21.0% Never married48.6% Now married2.5% Separated12.0% Widowed15.8% DivorcedWomen who gave birth in the past 12 months Now married:
85.6% (282)Unmarried:
14.4% (47)
Women who did not give birth in the past 12 months Now married:
41.3% (1,209)Unmarried:
58.7% (1,720)
Marital status - Black or African American population 15 years and over
Males 36.6% Never married41.1% Now married5.6% Separated9.7% Widowed7.1% DivorcedFemales 29.5% Never married35.8% Now married8.7% Separated7.9% Widowed18.1% DivorcedWomen who gave birth in the past 12 months Now married:
92.0% (92)Unmarried:
8.0% (8)
Women who did not give birth in the past 12 months Now married:
32.7% (133)Unmarried:
67.3% (274)
Marital status - American Indian / Alaska Native population 15 years and over
Males 7.9% Never married33.9% Now married0.0% Separated1.6% Widowed56.7% DivorcedFemales 0.0% Never married100.0% Now married0.0% Separated0.0% Widowed0.0% DivorcedMarital status - Other race population 15 years and over
Males 25.2% Never married47.2% Now married19.3% Separated8.3% Widowed0.0% DivorcedFemales 33.7% Never married45.1% Now married2.7% Separated12.3% Widowed6.2% DivorcedWomen who did not give birth in the past 12 months Now married:
29.4% (170)Unmarried:
70.6% (408)
Marital status - Two or more races population 15 years and over
Males 50.6% Never married44.9% Now married0.0% Separated0.0% Widowed4.5% DivorcedFemales 41.5% Never married56.2% Now married0.0% Separated2.2% Widowed0.0% DivorcedWomen who gave birth in the past 12 months Now married:
100.0% (26)Unmarried:
0.0% (0)
Women who did not give birth in the past 12 months Now married:
47.1% (535)Unmarried:
52.9% (602)
Marital status - White alone, not Hispanic / Latino population 15 years and over
Males 28.2% Never married58.3% Now married0.0% Separated1.9% Widowed11.6% DivorcedFemales 11.4% Never married55.4% Now married3.7% Separated14.3% Widowed15.2% DivorcedWomen who gave birth in the past 12 months Now married:
94.0% (243)Unmarried:
6.0% (15)
Women who did not give birth in the past 12 months Now married:
55.7% (934)Unmarried:
44.3% (742)
Marital status - Hispanic or Latino population 15 years and over
Males 43.1% Never married47.6% Now married3.4% Separated1.5% Widowed4.3% DivorcedFemales 38.3% Never married43.7% Now married0.6% Separated6.8% Widowed10.6% DivorcedWomen who gave birth in the past 12 months Now married:
68.2% (83)Unmarried:
31.8% (39)
Women who did not give birth in the past 12 months Now married:
32.5% (941)Unmarried:
67.5% (1,958)
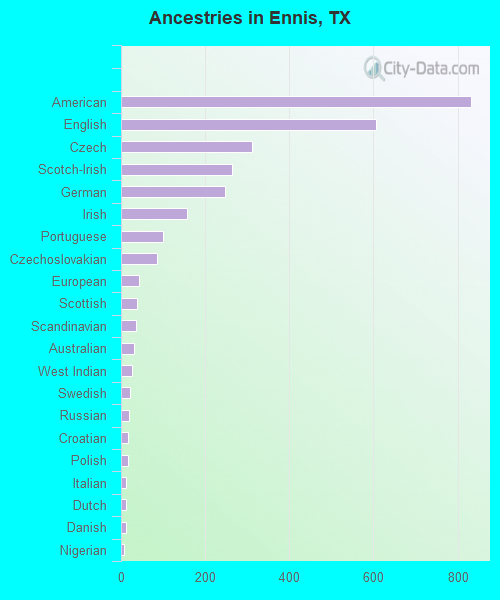
Ancestries in Ennis
833 6.9% American607 5.0% English312 2.6% Czech265 2.2% Scotch-Irish247 2.0% German158 1.3% Irish99 0.8% Portuguese85 0.7% Czechoslovakian43 0.4% European39 0.3% Scottish35 0.3% Scandinavian32 0.3% Australian25 0.2% West Indian22 0.2% Swedish18 0.1% Russian16 0.1% Croatian16 0.1% Polish13 0.1% Italian12 0.10% Dutch11 0.09% Danish8 0.07% Nigerian4 0.03% Cajun
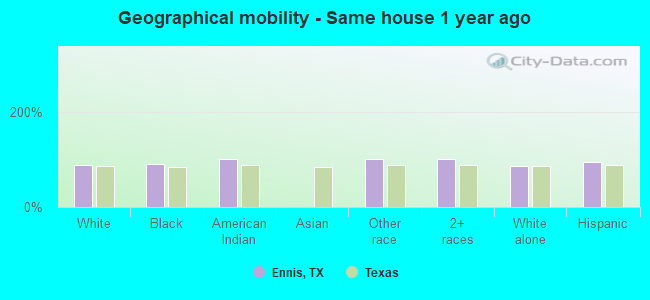
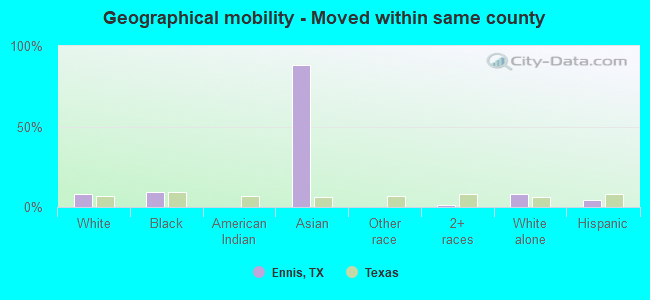
Geographical mobility in Ennis Same house 1 year ago 10,933 86.6% White (Caucasian)2,486 91.3% Black or African American243 100.0% American Indian / Alaska Native2,566 100.0% Other race4,762 100.0% Two or more races7,108 86.2% White alone, not Hispanic / Latino10,401 95.0% Hispanic or LatinoMoved within same county 1,037 8.2% White / Caucasian261 9.6% Black or African American8 88.0% Asian49 1.1% Two or more races668 8.1% White alone, not Hispanic / Latino458 4.2% Hispanic or LatinoMoved within same state 517 4.1% White / Caucasian17 0.6% Black or African American3 0.1% Other race10 0.2% Two or more races329 4.0% White alone, not Hispanic / Latino207 1.9% Hispanic or LatinoMoved from different state 103 0.8% White / Caucasian112 1.4% White alone, not Hispanic / Latino
Children Nativity (place of birth) in Ennis
Children under 6 years - Living with two parents Both parents native 898 100.0% NativeBoth parents foreign-born 187 100.0% NativeChildren under 6 years - Living with one parent Native parent 464 100.0% NativeChildren 6 to 17 years - Living with two parents Both parents native 895 100.0% NativeBoth parents foreign-born 893 72.2% Native344 27.8% Foreign-bornOne native, one foreign-born parent 94 100.0% NativeChildren 6 to 17 years - Living with one parent Native parent 1,580 100.0% NativeForeign-born parent 298 49.9% Native299 50.1% Foreign-born
Grandparents responsible for own grandchildren in Ennis
Grandparents (30 to 59 years) White / Caucasian 18 10.6% Responsible for grandchildren154 89.4% Not responsible for grandchildrenBlack or African American 19 87.5% Responsible for grandchildren3 12.5% Not responsible for grandchildrenOther race 52 100.0% Not responsible for grandchildrenWhite alone, not Hispanic / Latino 7 6.7% Responsible for grandchildren100 93.3% Not responsible for grandchildrenHispanic or Latino 12 12.6% Responsible for grandchildren87 87.4% Not responsible for grandchildrenGrandparents (60 years and over) White / Caucasian 46 57.2% Responsible for grandchildren35 42.8% Not responsible for grandchildrenWhite alone, not Hispanic / Latino 61 84.2% Responsible for grandchildren12 15.8% Not responsible for grandchildrenHispanic or Latino 50 100.0% Not responsible for grandchildren