Races in Ephraim, Utah (UT) Detailed Stats
Data:
Races - White alone (%)
Races - White alone (% change since 2000)
Races - Black alone (%)
Races - Black alone (% change since 2000)
Races - American Indian alone (%)
Races - American Indian alone (% change since 2000)
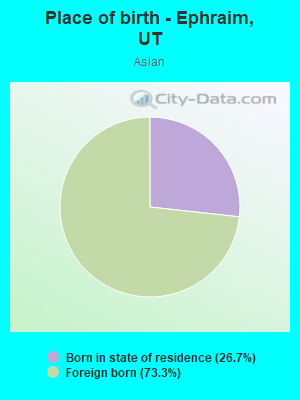
Races - Asian alone (%)
Races - Asian alone (% change since 2000)
Races - Hispanic (%)
Races - Hispanic (% change since 2000)
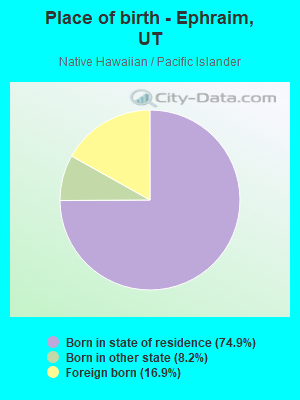
Races - Native Hawaiian and Other Pacific Islander alone (%)
Races - Native Hawaiian and Other Pacific Islander alone (% change since 2000)
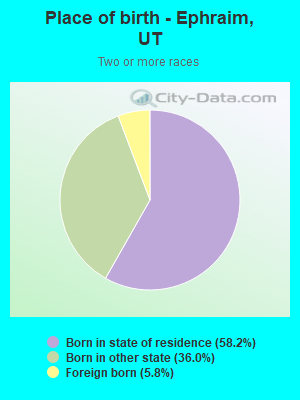
Races - Two or more races(%)
Races - Two or more races(% change since 2000)
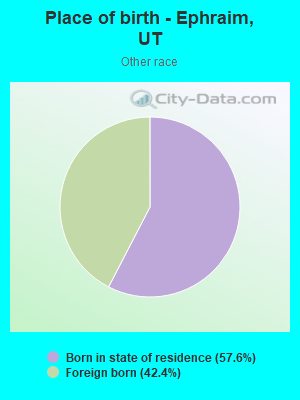
Races - Other race alone (%)
Races - Other race alone (% change since 2000)
Racial diversity
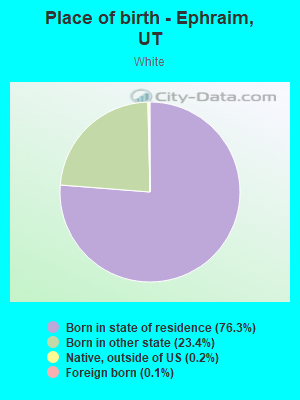
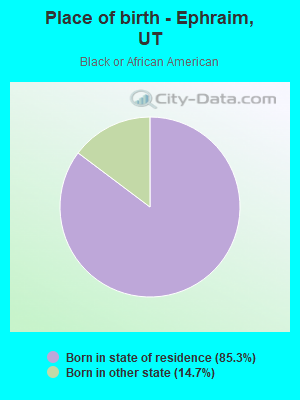
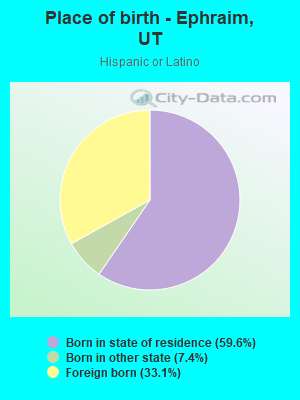
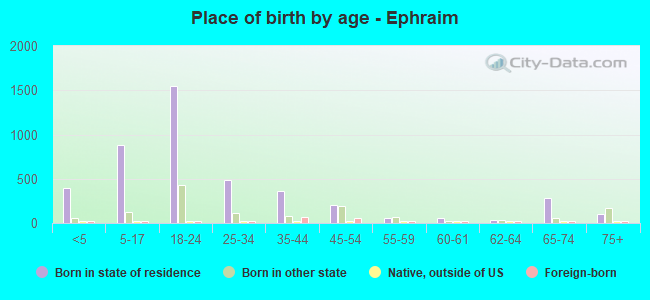
Place of birth - Born in state of residence (%)
Place of birth - Born in state of residence (%) - White
Place of birth - Born in state of residence (%) - Black or African American
Place of birth - Born in state of residence (%) - Asian
Place of birth - Born in state of residence (%) - Hispanic or Latino
Place of birth - Born in state of residence (%) - American Indian and Alaska Native
Place of birth - Born in state of residence (%) - Multirace
Place of birth - Born in state of residence (%) - Other Race
Place of birth - Born in other state (%)
Place of birth - Born in other state (%) - White
Place of birth - Born in other state (%) - Black or African American
Place of birth - Born in other state (%) - Asian
Place of birth - Born in other state (%) - Hispanic or Latino
Place of birth - Born in other state (%) - American Indian and Alaska Native
Place of birth - Born in other state (%) - Multirace
Place of birth - Born in other state (%) - Other Race
Place of birth - Native, outside of US (%)
Place of birth - Native, outside of US (%) - White
Place of birth - Native, outside of US (%) - Black or African American
Place of birth - Native, outside of US (%) - Asian
Place of birth - Native, outside of US (%) - Hispanic or Latino
Place of birth - Native, outside of US (%) - American Indian and Alaska Native
Place of birth - Native, outside of US (%) - Multirace
Place of birth - Native, outside of US (%) - Other Race
Place of birth - Foreign born (%)
Place of birth - Foreign born (%) - White
Place of birth - Foreign born (%) - Black or African American
Place of birth - Foreign born (%) - Asian
Place of birth - Foreign born (%) - Hispanic or Latino
Place of birth - Foreign born (%) - American Indian and Alaska Native
Place of birth - Foreign born (%) - Multirace
Place of birth - Foreign born (%) - Other Race
Residents speaking English at home (%)
Residents speaking English at home - Born in the United States (%)
Residents speaking English at home - Native, born elsewhere (%)
Residents speaking English at home - Foreign born (%)
Residents speaking Spanish at home (%)
Residents speaking Spanish at home - Born in the United States (%)
Residents speaking Spanish at home - Native, born elsewhere (%)
Residents speaking Spanish at home - Foreign born (%)
Residents speaking other language at home (%)
Residents speaking other language at home - Born in the United States (%)
Residents speaking other language at home - Native, born elsewhere (%)
Residents speaking other language at home - Foreign born (%)
Marital status - Never married (%)
Marital status - Now married (%)
Marital status - Separated (%)
Marital status - Widowed (%)
Marital status - Divorced (%)
Ancestries Reported - Arab (%)
Ancestries Reported - Czech (%)
Ancestries Reported - Danish (%)
Ancestries Reported - Dutch (%)
Ancestries Reported - English (%)
Ancestries Reported - French (%)
Ancestries Reported - French Canadian (%)
Ancestries Reported - German (%)
Ancestries Reported - Greek (%)
Ancestries Reported - Hungarian (%)
Ancestries Reported - Irish (%)
Ancestries Reported - Italian (%)
Ancestries Reported - Lithuanian (%)
Ancestries Reported - Norwegian (%)
Ancestries Reported - Polish (%)
Ancestries Reported - Portuguese (%)
Ancestries Reported - Russian (%)
Ancestries Reported - Scotch-Irish (%)
Ancestries Reported - Scottish (%)
Ancestries Reported - Slovak (%)
Ancestries Reported - Subsaharan African (%)
Ancestries Reported - Swedish (%)
Ancestries Reported - Swiss (%)
Ancestries Reported - Ukrainian (%)
Ancestries Reported - United States (%)
Ancestries Reported - Welsh (%)
Ancestries Reported - West Indian (%)
Ancestries Reported - Other (%)
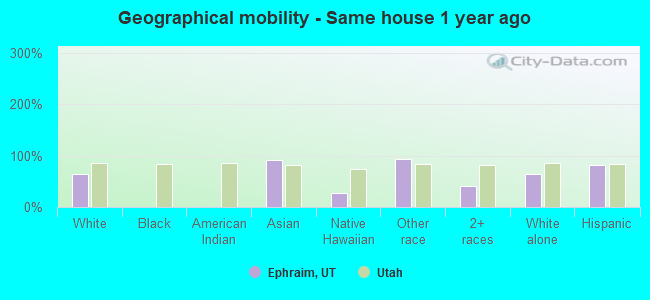
Geographical mobility - Same house 1 year ago (%)
Geographical mobility - Same house 1 year ago (%) - White
Geographical mobility - Same house 1 year ago (%) - Black or African American
Geographical mobility - Same house 1 year ago (%) - Asian
Geographical mobility - Same house 1 year ago (%) - Hispanic or Latino
Geographical mobility - Same house 1 year ago (%) - American Indian and Alaska Native
Geographical mobility - Same house 1 year ago (%) - Multirace
Geographical mobility - Same house 1 year ago (%) - Other Race
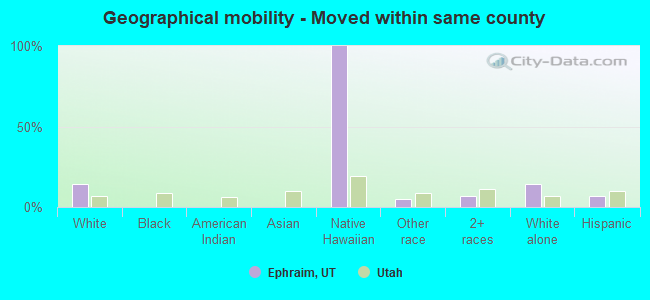
Geographical mobility - Moved within same county (%)
Geographical mobility - Moved within same county (%) - White
Geographical mobility - Moved within same county (%) - Black or African American
Geographical mobility - Moved within same county (%) - Asian
Geographical mobility - Moved within same county (%) - Hispanic or Latino
Geographical mobility - Moved within same county (%) - American Indian and Alaska Native
Geographical mobility - Moved within same county (%) - Multirace
Geographical mobility - Moved within same county (%) - Other Race
Geographical mobility - Moved from different county within same state (%)
Geographical mobility - Moved from different county within same state (%) - White
Geographical mobility - Moved from different county within same state (%) - Black or African American
Geographical mobility - Moved from different county within same state (%) - Asian
Geographical mobility - Moved from different county within same state (%) - Hispanic or Latino
Geographical mobility - Moved from different county within same state (%) - American Indian and Alaska Native
Geographical mobility - Moved from different county within same state (%) - Multirace
Geographical mobility - Moved from different county within same state (%) - Other Race
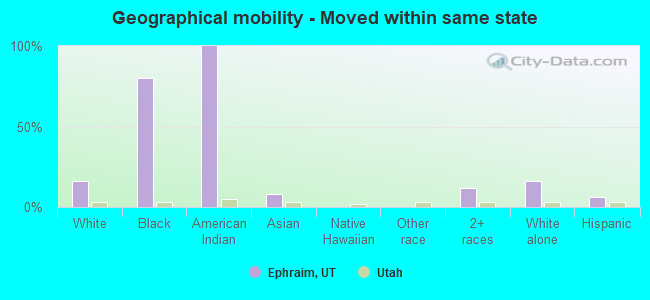
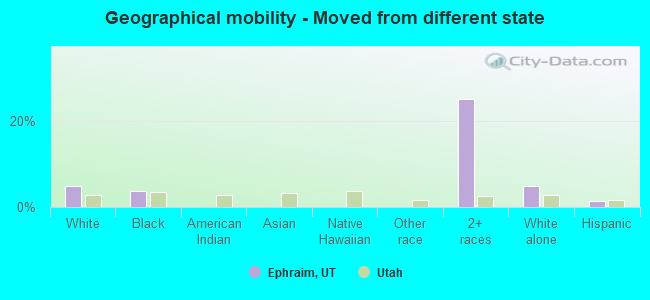
Geographical mobility - Moved from different state (%)
Geographical mobility - Moved from different state (%) - White
Geographical mobility - Moved from different state (%) - Black or African American
Geographical mobility - Moved from different state (%) - Asian
Geographical mobility - Moved from different state (%) - Hispanic or Latino
Geographical mobility - Moved from different state (%) - American Indian and Alaska Native
Geographical mobility - Moved from different state (%) - Multirace
Geographical mobility - Moved from different state (%) - Other Race
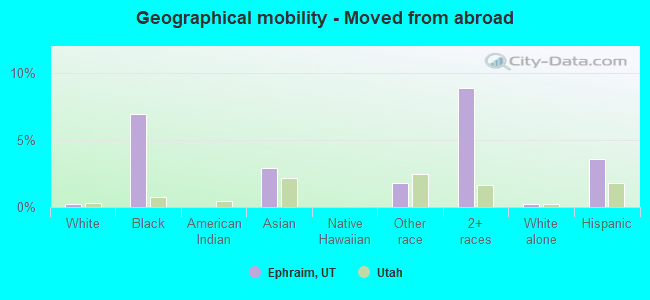
Geographical mobility - Moved from abroad (%)
Geographical mobility - Moved from abroad (%) - White
Geographical mobility - Moved from abroad (%) - Black or African American
Geographical mobility - Moved from abroad (%) - Asian
Geographical mobility - Moved from abroad (%) - Hispanic or Latino
Geographical mobility - Moved from abroad (%) - American Indian and Alaska Native
Geographical mobility - Moved from abroad (%) - Multirace
Geographical mobility - Moved from abroad (%) - Other Race
Place of birth for the foreign-born population - Ireland (%)
Place of birth for the foreign-born population - Denmark (%)
Place of birth for the foreign-born population - Norway (%)
Place of birth for the foreign-born population - Sweden (%)
Place of birth for the foreign-born population - United Kingdom (%)
Place of birth for the foreign-born population - England (%)
Place of birth for the foreign-born population - Scotland (%)
Place of birth for the foreign-born population - Other Northern Europe (%)
Place of birth for the foreign-born population - Austria (%)
Place of birth for the foreign-born population - Belgium (%)
Place of birth for the foreign-born population - France (%)
Place of birth for the foreign-born population - Germany (%)
Place of birth for the foreign-born population - Netherlands (%)
Place of birth for the foreign-born population - Switzerland (%)
Place of birth for the foreign-born population - Other Western Europe (%)
Place of birth for the foreign-born population - Greece (%)
Place of birth for the foreign-born population - Italy (%)
Place of birth for the foreign-born population - Portugal (%)
Place of birth for the foreign-born population - Spain (%)
Place of birth for the foreign-born population - Other Southern Europe (%)
Place of birth for the foreign-born population - Albania (%)
Place of birth for the foreign-born population - Belarus (%)
Place of birth for the foreign-born population - Bosnia and Herzegovina (%)
Place of birth for the foreign-born population - Bulgaria (%)
Place of birth for the foreign-born population - Croatia (%)
Place of birth for the foreign-born population - Czechoslovakia (%)
Place of birth for the foreign-born population - Hungary (%)
Place of birth for the foreign-born population - Latvia (%)
Place of birth for the foreign-born population - Lithuania (%)
Place of birth for the foreign-born population - North Macedonia (Macedonia) (%)
Place of birth for the foreign-born population - Moldova (%)
Place of birth for the foreign-born population - Poland (%)
Place of birth for the foreign-born population - Romania (%)
Place of birth for the foreign-born population - Russia (%)
Place of birth for the foreign-born population - Serbia (%)
Place of birth for the foreign-born population - Ukraine (%)
Place of birth for the foreign-born population - Other Eastern Europe (%)
Place of birth for the foreign-born population - China (%)
Place of birth for the foreign-born population - Hong Kong (%)
Place of birth for the foreign-born population - Taiwan (%)
Place of birth for the foreign-born population - Japan (%)
Place of birth for the foreign-born population - Korea (%)
Place of birth for the foreign-born population - Other Eastern Asia (%)
Place of birth for the foreign-born population - Afghanistan (%)
Place of birth for the foreign-born population - Bangladesh (%)
Place of birth for the foreign-born population - India (%)
Place of birth for the foreign-born population - Iran (%)
Place of birth for the foreign-born population - Kazakhstan (%)
Place of birth for the foreign-born population - Nepal (%)
Place of birth for the foreign-born population - Pakistan (%)
Place of birth for the foreign-born population - Sri Lanka (%)
Place of birth for the foreign-born population - Uzbekistan (%)
Place of birth for the foreign-born population - Other South Central Asia (%)
Place of birth for the foreign-born population - Burma (%)
Place of birth for the foreign-born population - Cambodia (%)
Place of birth for the foreign-born population - Indonesia (%)
Place of birth for the foreign-born population - Laos (%)
Place of birth for the foreign-born population - Malaysia (%)
Place of birth for the foreign-born population - Philippines (%)
Place of birth for the foreign-born population - Singapore (%)
Place of birth for the foreign-born population - Thailand (%)
Place of birth for the foreign-born population - Vietnam (%)
Place of birth for the foreign-born population - Other South Eastern Asia (%)
Place of birth for the foreign-born population - Armenia (%)
Place of birth for the foreign-born population - Iraq (%)
Place of birth for the foreign-born population - Israel (%)
Place of birth for the foreign-born population - Jordan (%)
Place of birth for the foreign-born population - Kuwait (%)
Place of birth for the foreign-born population - Lebanon (%)
Place of birth for the foreign-born population - Saudi Arabia (%)
Place of birth for the foreign-born population - Syria (%)
Place of birth for the foreign-born population - Turkey (%)
Place of birth for the foreign-born population - Yemen (%)
Place of birth for the foreign-born population - Other Western Asia (%)
Place of birth for the foreign-born population - Eritrea (%)
Place of birth for the foreign-born population - Ethiopia (%)
Place of birth for the foreign-born population - Kenya (%)
Place of birth for the foreign-born population - Somalia (%)
Place of birth for the foreign-born population - Uganda (%)
Place of birth for the foreign-born population - Zimbabwe (%)
Place of birth for the foreign-born population - Other Eastern Africa (%)
Place of birth for the foreign-born population - Cameroon (%)
Place of birth for the foreign-born population - Congo (%)
Place of birth for the foreign-born population - Democratic Republic of Congo (Zaire) (%)
Place of birth for the foreign-born population - Other Middle Africa (%)
Place of birth for the foreign-born population - Egypt (%)
Place of birth for the foreign-born population - Morocco (%)
Place of birth for the foreign-born population - Sudan (%)
Place of birth for the foreign-born population - Other Northern Africa (%)
Place of birth for the foreign-born population - South Africa (%)
Place of birth for the foreign-born population - Other Southern Africa (%)
Place of birth for the foreign-born population - Cabo Verde (%)
Place of birth for the foreign-born population - Ghana (%)
Place of birth for the foreign-born population - Liberia (%)
Place of birth for the foreign-born population - Nigeria (%)
Place of birth for the foreign-born population - Senegal (%)
Place of birth for the foreign-born population - Sierra Leone (%)
Place of birth for the foreign-born population - Other Western Africa (%)
Place of birth for the foreign-born population - Australia (%)
Place of birth for the foreign-born population - New Zealand (%)
Place of birth for the foreign-born population - Fiji (%)
Place of birth for the foreign-born population - Micronesia (%)
Place of birth for the foreign-born population - Bahamas (%)
Place of birth for the foreign-born population - Barbados (%)
Place of birth for the foreign-born population - Cuba (%)
Place of birth for the foreign-born population - Dominica (%)
Place of birth for the foreign-born population - Dominican Republic (%)
Place of birth for the foreign-born population - Grenada (%)
Place of birth for the foreign-born population - Haiti (%)
Place of birth for the foreign-born population - Jamaica (%)
Place of birth for the foreign-born population - St. Vincent and the Grenadines (%)
Place of birth for the foreign-born population - Trinidad and Tobago (%)
Place of birth for the foreign-born population - West Indies (%)
Place of birth for the foreign-born population - Other Caribbean (%)
Place of birth for the foreign-born population - Belize (%)
Place of birth for the foreign-born population - Costa Rica (%)
Place of birth for the foreign-born population - El Salvador (%)
Place of birth for the foreign-born population - Guatemala (%)
Place of birth for the foreign-born population - Honduras (%)
Place of birth for the foreign-born population - Mexico (%)
Place of birth for the foreign-born population - Nicaragua (%)
Place of birth for the foreign-born population - Panama (%)
Place of birth for the foreign-born population - Other Central America (%)
Place of birth for the foreign-born population - Argentina (%)
Place of birth for the foreign-born population - Bolivia (%)
Place of birth for the foreign-born population - Brazil (%)
Place of birth for the foreign-born population - Chile (%)
Place of birth for the foreign-born population - Colombia (%)
Place of birth for the foreign-born population - Ecuador (%)
Place of birth for the foreign-born population - Guyana (%)
Place of birth for the foreign-born population - Peru (%)
Place of birth for the foreign-born population - Uruguay (%)
Place of birth for the foreign-born population - Venezuela (%)
Place of birth for the foreign-born population - Other South America (%)
Place of birth for the foreign-born population - Canada (%)
Place of birth for the foreign-born population - Other Northern America (%)
Place of birth for the foreign-born population - Other (%)
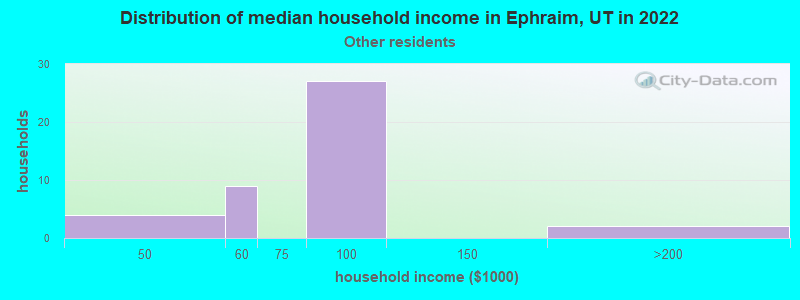
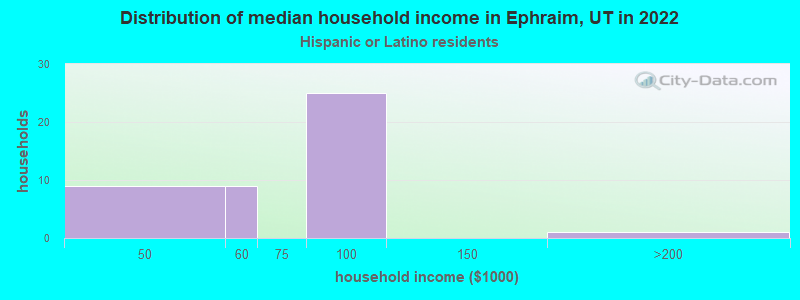
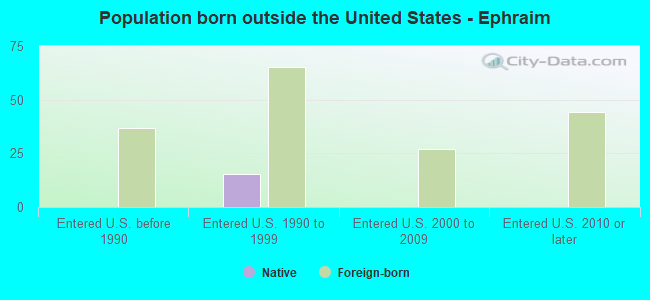
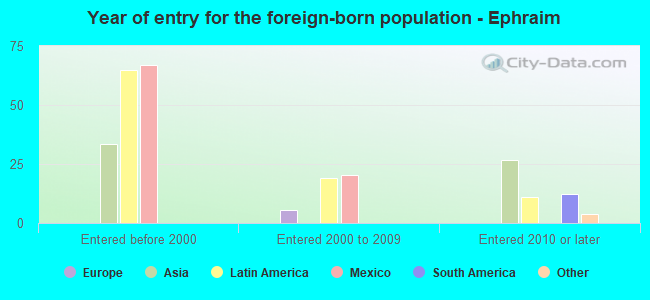
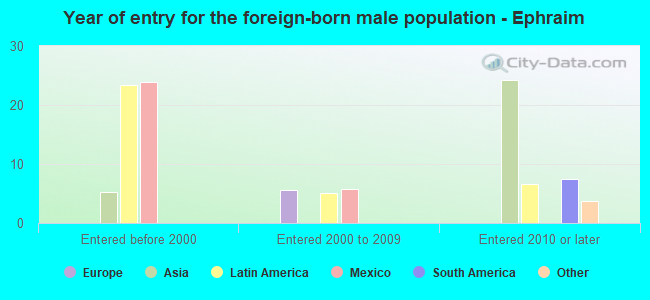
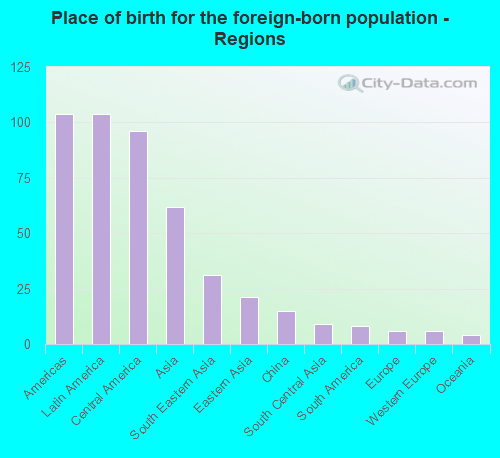
According to 2022 data, the most numerous races in Ephraim, UT are White alone (5,278 residents), Hispanic (316 residents), and Two or more races (79 residents). 91.5% of Ephraim residents speak English at home. 3.0% of Ephraim, UT residents are foreign-born (1.7% born in Latin America, 1.0% born in Asia), which is 167.1% less than the foreign-born rate of 8.0% across the entire state of Utah.
Race distribution in Ephraim
2000 2022
1,904,265 85.3% White alone 201,559 9.0% Hispanic 36,483 1.6% Asian alone 31,308 1.4% Two or more races 26,663 1.2% American Indian alone 14,806 0.7% Native Hawaiian and Other 16,137 0.7% Black alone 1,948 0.09% Other race alone
2,557,466 75.6% White alone 512,086 15.1% Hispanic 119,308 3.5% Two or more races 82,388 2.4% Asian alone 36,978 1.1% Native Hawaiian and Other 34,873 1.0% Black alone 22,803 0.7% American Indian alone 14,898 0.4% Other race alone
Income and house value in Ephraim Median household income in 2022 $73,611 White non-Hispanic householders$80,185 Some other race householders$78,993 Hispanic or Latino race householdersMedian 2022 house value $428,849 White Non-Hispanic householders$269,830 Some other race householders$269,830 Two or more races householders$284,221 Hispanic or Latino householders
Median age by race in Ephraim
22.6 Median age for White residents22.8 22.4 18.6 Median age for Black or African American residents18.1 -686,357,242.6 -709,539,120.4 Median age for American Indian / Alaska Native residents-720,955,482.4 -694,006,308.5 36.6 Median age for Asian residents19.3 55.2 18.6 Median age for Native Hawaiian / Pacific Islander residents26.5 -664,285,713.6 19.6 Median age for Other race residents19.0 21.6 19.7 Median age for Two or more races residents19.5 21.6 22.7 Median age for White alone residents22.8 22.4 19.2 Median age for Hispanic or Latino residents19.0 19.4
Owner/renter occupied households by race in Ephraim
House owners and renters - White residents 916 55.5% Owner occupied735 44.5% Renter occupiedHouse owners and renters - Asian residents 27 100.0% Owner occupiedHouse owners and renters - Native Hawaiian / Pacific Islander residents 1 100.0% Renter occupiedHouse owners and renters - Other race residents 35 85.1% Owner occupied6 14.9% Renter occupiedHouse owners and renters - Two or more races residents 11 100.0% Renter occupiedHouse owners and renters - White alone residents 929 55.4% Owner occupied747 44.6% Renter occupiedHouse owners and renters - Hispanic or Latino residents 31 68.0% Owner occupied14 32.0% Renter occupied
Language usage in Ephraim
English speakers - Total 91.5% of residents of Ephraim speak English at home.
4.9% of residents speak Spanish at home 194 71.9% Speak English very well76 28.1% Speak English less than very well3.3% of residents speak other language at home 175 97.2% Speak English very well5 2.8% Speak English less than very well
English speakers - Born in the United States 94.2% of residents of Ephraim speak English at home.
3.2% of residents speak Spanish at home 34 85.0% Speak English very well6 15.0% Speak English less than very well2.6% of residents speak other language at home 32 100.0% Speak English very well
English speakers - Native, born elsewhere 92.3% of residents of Ephraim speak English at home.
English speakers - Foreign-born 9.6% of residents of Ephraim speak English at home.
58.8% of residents speak Spanish at home 36 34.6% Speak English very well68 65.4% Speak English less than very well30.5% of residents speak other language at home 49 90.7% Speak English very well5 9.3% Speak English less than very well
White (Caucasian) - Speak only English Native:
97.9% (4,770)Foreign-born:
73.4% (6)
White (Caucasian) - Speak another language Native:
2.5% (124)Foreign-born:
39.5% (3)
Asian - Speak only English Native:
90.5% (17)Foreign-born:
23.8% (12)
Other race - Speak another language Native:
100.0% (128)Foreign-born:
97.1% (123)
Two or more races - Speak another language Native:
44.8% (33)Foreign-born:
100.0% (6)
White alone - Speak only English Native:
97.2% (4,765)Foreign-born:
100.0% (6)
Hispanic or Latino - Speak another language Native:
75.0% (120)Foreign-born:
99.4% (105)
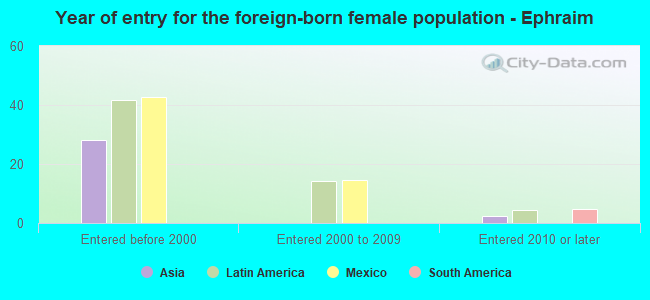
Foreign-born residents in Ephraim 177 residents are foreign born (1.7% Latin America , 1.0% Asia ).
Marital status for residents in Ephraim Marital status - White (Caucasian) population 15 years and over
Males 44.1% Never married49.2% Now married3.5% Separated2.3% Widowed0.9% DivorcedFemales 48.4% Never married43.0% Now married1.1% Separated5.1% Widowed2.4% DivorcedWomen who gave birth in the past 12 months Now married:
100.0% (139)Unmarried:
0.0% (0)
Women who did not give birth in the past 12 months Now married:
31.5% (518)Unmarried:
68.5% (1,128)
Marital status - Asian population 15 years and over
Males 78.3% Never married21.7% Now married0.0% Separated0.0% Widowed0.0% DivorcedFemales 15.6% Never married21.9% Now married0.0% Separated62.5% Widowed0.0% DivorcedWomen who did not give birth in the past 12 months Now married:
58.3% (8)Unmarried:
41.7% (6)
Marital status - Native Hawaiian / Pacific Islander population 15 years and over
Males 66.7% Never married33.3% Now married0.0% Separated0.0% Widowed0.0% DivorcedFemales 100.0% Never married0.0% Now married0.0% Separated0.0% Widowed0.0% DivorcedWomen who did not give birth in the past 12 months Now married:
0.0% (0)Unmarried:
100.0% (19)
Marital status - Other race population 15 years and over
Males 70.1% Never married27.8% Now married2.1% Separated0.0% Widowed0.0% DivorcedFemales 23.5% Never married76.5% Now married0.0% Separated0.0% Widowed0.0% DivorcedWomen who did not give birth in the past 12 months Now married:
73.6% (61)Unmarried:
26.4% (22)
Marital status - Two or more races population 15 years and over
Males 82.4% Never married17.6% Now married0.0% Separated0.0% Widowed0.0% DivorcedFemales 65.2% Never married34.8% Now married0.0% Separated0.0% Widowed0.0% DivorcedWomen who did not give birth in the past 12 months Now married:
34.8% (11)Unmarried:
65.2% (20)
Marital status - White alone, not Hispanic / Latino population 15 years and over
Males 43.9% Never married49.3% Now married3.6% Separated2.3% Widowed0.9% DivorcedFemales 48.3% Never married43.1% Now married1.1% Separated5.1% Widowed2.4% DivorcedWomen who gave birth in the past 12 months Now married:
100.0% (142)Unmarried:
0.0% (0)
Women who did not give birth in the past 12 months Now married:
31.6% (530)Unmarried:
68.4% (1,147)
Marital status - Hispanic or Latino population 15 years and over
Males 66.7% Never married31.4% Now married2.0% Separated0.0% Widowed0.0% DivorcedFemales 36.1% Never married63.9% Now married0.0% Separated0.0% Widowed0.0% DivorcedWomen who did not give birth in the past 12 months Now married:
60.2% (56)Unmarried:
39.8% (37)
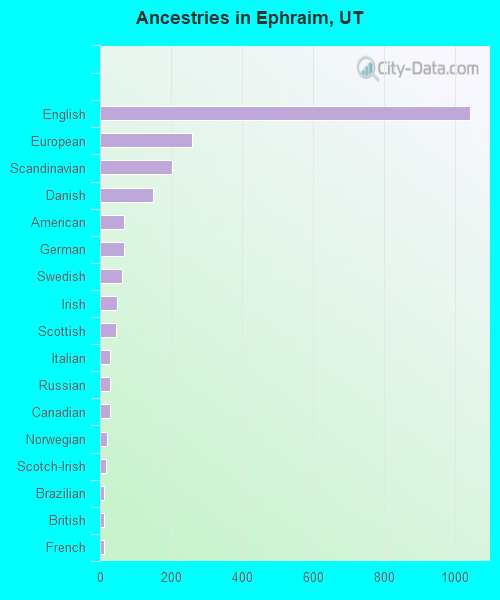
Ancestries in Ephraim
1,045 36.5% English259 9.0% European203 7.1% Scandinavian150 5.2% Danish68 2.4% American68 2.4% German62 2.2% Swedish47 1.6% Irish45 1.6% Scottish29 1.0% Italian29 1.0% Russian27 0.9% Canadian21 0.7% Norwegian18 0.6% Scotch-Irish12 0.4% Brazilian12 0.4% British12 0.4% French8 0.3% Hungarian6 0.2% Welsh5 0.2% French Canadian5 0.2% Greek5 0.2% African5 0.2% Swiss3 0.1% Australian2 0.07% Portuguese
Children Nativity (place of birth) in Ephraim
Children under 6 years - Living with two parents Both parents native 476 100.0% NativeBoth parents foreign-born 18 100.0% NativeOne native, one foreign-born parent 23 100.0% NativeChildren under 6 years - Living with one parent Native parent 14 100.0% Native
Children 6 to 17 years - Living with two parents Both parents native 662 100.0% NativeBoth parents foreign-born 84 100.0% NativeOne native, one foreign-born parent 30 100.0% NativeChildren 6 to 17 years - Living with one parent Native parent 45 100.0% Native
Grandparents responsible for own grandchildren in Ephraim
Grandparents (30 to 59 years) Other race 10 78.6% Responsible for grandchildren3 21.4% Not responsible for grandchildrenHispanic or Latino 8 74.8% Responsible for grandchildren3 25.2% Not responsible for grandchildren
Grandparents (60 years and over)