Races in Erie, Pennsylvania (PA) Detailed Stats
Data:
Races - White alone (%)
Races - White alone (% change since 2000)
Races - Black alone (%)
Races - Black alone (% change since 2000)
Races - American Indian alone (%)
Races - American Indian alone (% change since 2000)
Races - Asian alone (%)
Races - Asian alone (% change since 2000)
Races - Hispanic (%)
Races - Hispanic (% change since 2000)
Races - Native Hawaiian and Other Pacific Islander alone (%)
Races - Native Hawaiian and Other Pacific Islander alone (% change since 2000)
Races - Two or more races(%)
Races - Two or more races(% change since 2000)
Races - Other race alone (%)
Races - Other race alone (% change since 2000)
Racial diversity
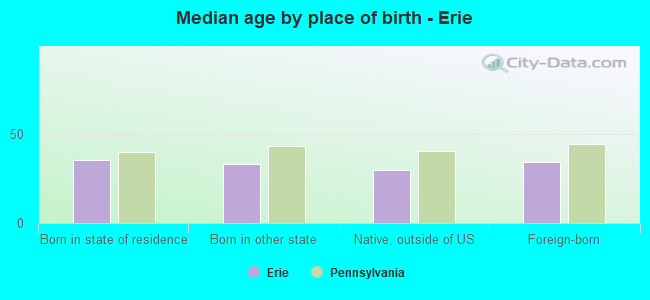
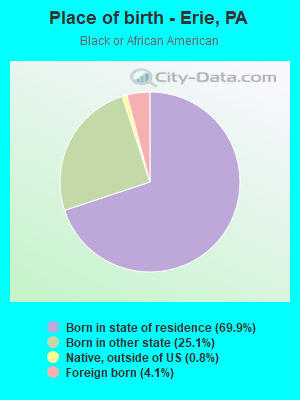
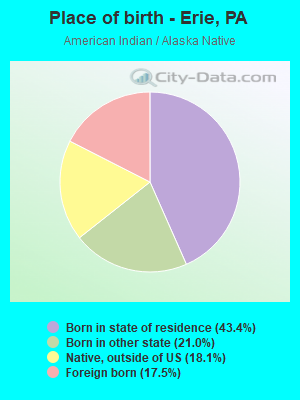
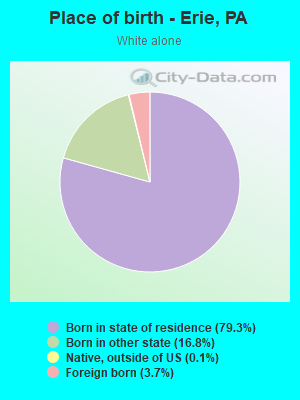
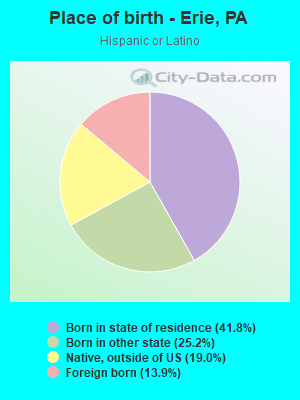
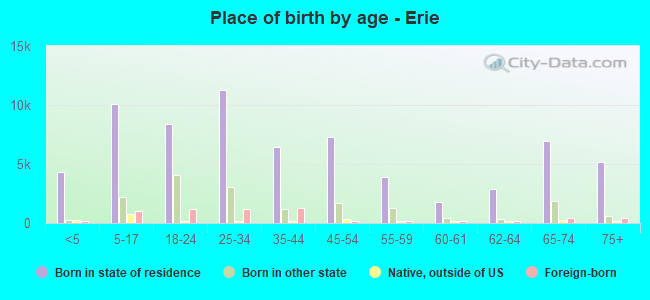
Place of birth - Born in state of residence (%)
Place of birth - Born in state of residence (%) - White
Place of birth - Born in state of residence (%) - Black or African American
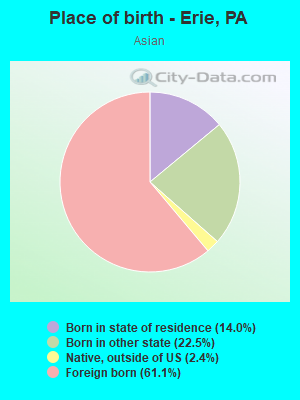
Place of birth - Born in state of residence (%) - Asian
Place of birth - Born in state of residence (%) - Hispanic or Latino
Place of birth - Born in state of residence (%) - American Indian and Alaska Native
Place of birth - Born in state of residence (%) - Multirace
Place of birth - Born in state of residence (%) - Other Race
Place of birth - Born in other state (%)
Place of birth - Born in other state (%) - White
Place of birth - Born in other state (%) - Black or African American
Place of birth - Born in other state (%) - Asian
Place of birth - Born in other state (%) - Hispanic or Latino
Place of birth - Born in other state (%) - American Indian and Alaska Native
Place of birth - Born in other state (%) - Multirace
Place of birth - Born in other state (%) - Other Race
Place of birth - Native, outside of US (%)
Place of birth - Native, outside of US (%) - White
Place of birth - Native, outside of US (%) - Black or African American
Place of birth - Native, outside of US (%) - Asian
Place of birth - Native, outside of US (%) - Hispanic or Latino
Place of birth - Native, outside of US (%) - American Indian and Alaska Native
Place of birth - Native, outside of US (%) - Multirace
Place of birth - Native, outside of US (%) - Other Race
Place of birth - Foreign born (%)
Place of birth - Foreign born (%) - White
Place of birth - Foreign born (%) - Black or African American
Place of birth - Foreign born (%) - Asian
Place of birth - Foreign born (%) - Hispanic or Latino
Place of birth - Foreign born (%) - American Indian and Alaska Native
Place of birth - Foreign born (%) - Multirace
Place of birth - Foreign born (%) - Other Race
Residents speaking English at home (%)
Residents speaking English at home - Born in the United States (%)
Residents speaking English at home - Native, born elsewhere (%)
Residents speaking English at home - Foreign born (%)
Residents speaking Spanish at home (%)
Residents speaking Spanish at home - Born in the United States (%)
Residents speaking Spanish at home - Native, born elsewhere (%)
Residents speaking Spanish at home - Foreign born (%)
Residents speaking other language at home (%)
Residents speaking other language at home - Born in the United States (%)
Residents speaking other language at home - Native, born elsewhere (%)
Residents speaking other language at home - Foreign born (%)
Marital status - Never married (%)
Marital status - Now married (%)
Marital status - Separated (%)
Marital status - Widowed (%)
Marital status - Divorced (%)
Ancestries Reported - Arab (%)
Ancestries Reported - Czech (%)
Ancestries Reported - Danish (%)
Ancestries Reported - Dutch (%)
Ancestries Reported - English (%)
Ancestries Reported - French (%)
Ancestries Reported - French Canadian (%)
Ancestries Reported - German (%)
Ancestries Reported - Greek (%)
Ancestries Reported - Hungarian (%)
Ancestries Reported - Irish (%)
Ancestries Reported - Italian (%)
Ancestries Reported - Lithuanian (%)
Ancestries Reported - Norwegian (%)
Ancestries Reported - Polish (%)
Ancestries Reported - Portuguese (%)
Ancestries Reported - Russian (%)
Ancestries Reported - Scotch-Irish (%)
Ancestries Reported - Scottish (%)
Ancestries Reported - Slovak (%)
Ancestries Reported - Subsaharan African (%)
Ancestries Reported - Swedish (%)
Ancestries Reported - Swiss (%)
Ancestries Reported - Ukrainian (%)
Ancestries Reported - United States (%)
Ancestries Reported - Welsh (%)
Ancestries Reported - West Indian (%)
Ancestries Reported - Other (%)
Geographical mobility - Same house 1 year ago (%)
Geographical mobility - Same house 1 year ago (%) - White
Geographical mobility - Same house 1 year ago (%) - Black or African American
Geographical mobility - Same house 1 year ago (%) - Asian
Geographical mobility - Same house 1 year ago (%) - Hispanic or Latino
Geographical mobility - Same house 1 year ago (%) - American Indian and Alaska Native
Geographical mobility - Same house 1 year ago (%) - Multirace
Geographical mobility - Same house 1 year ago (%) - Other Race
Geographical mobility - Moved within same county (%)
Geographical mobility - Moved within same county (%) - White
Geographical mobility - Moved within same county (%) - Black or African American
Geographical mobility - Moved within same county (%) - Asian
Geographical mobility - Moved within same county (%) - Hispanic or Latino
Geographical mobility - Moved within same county (%) - American Indian and Alaska Native
Geographical mobility - Moved within same county (%) - Multirace
Geographical mobility - Moved within same county (%) - Other Race
Geographical mobility - Moved from different county within same state (%)
Geographical mobility - Moved from different county within same state (%) - White
Geographical mobility - Moved from different county within same state (%) - Black or African American
Geographical mobility - Moved from different county within same state (%) - Asian
Geographical mobility - Moved from different county within same state (%) - Hispanic or Latino
Geographical mobility - Moved from different county within same state (%) - American Indian and Alaska Native
Geographical mobility - Moved from different county within same state (%) - Multirace
Geographical mobility - Moved from different county within same state (%) - Other Race
Geographical mobility - Moved from different state (%)
Geographical mobility - Moved from different state (%) - White
Geographical mobility - Moved from different state (%) - Black or African American
Geographical mobility - Moved from different state (%) - Asian
Geographical mobility - Moved from different state (%) - Hispanic or Latino
Geographical mobility - Moved from different state (%) - American Indian and Alaska Native
Geographical mobility - Moved from different state (%) - Multirace
Geographical mobility - Moved from different state (%) - Other Race
Geographical mobility - Moved from abroad (%)
Geographical mobility - Moved from abroad (%) - White
Geographical mobility - Moved from abroad (%) - Black or African American
Geographical mobility - Moved from abroad (%) - Asian
Geographical mobility - Moved from abroad (%) - Hispanic or Latino
Geographical mobility - Moved from abroad (%) - American Indian and Alaska Native
Geographical mobility - Moved from abroad (%) - Multirace
Geographical mobility - Moved from abroad (%) - Other Race
Place of birth for the foreign-born population - Ireland (%)
Place of birth for the foreign-born population - Denmark (%)
Place of birth for the foreign-born population - Norway (%)
Place of birth for the foreign-born population - Sweden (%)
Place of birth for the foreign-born population - United Kingdom (%)
Place of birth for the foreign-born population - England (%)
Place of birth for the foreign-born population - Scotland (%)
Place of birth for the foreign-born population - Other Northern Europe (%)
Place of birth for the foreign-born population - Austria (%)
Place of birth for the foreign-born population - Belgium (%)
Place of birth for the foreign-born population - France (%)
Place of birth for the foreign-born population - Germany (%)
Place of birth for the foreign-born population - Netherlands (%)
Place of birth for the foreign-born population - Switzerland (%)
Place of birth for the foreign-born population - Other Western Europe (%)
Place of birth for the foreign-born population - Greece (%)
Place of birth for the foreign-born population - Italy (%)
Place of birth for the foreign-born population - Portugal (%)
Place of birth for the foreign-born population - Spain (%)
Place of birth for the foreign-born population - Other Southern Europe (%)
Place of birth for the foreign-born population - Albania (%)
Place of birth for the foreign-born population - Belarus (%)
Place of birth for the foreign-born population - Bosnia and Herzegovina (%)
Place of birth for the foreign-born population - Bulgaria (%)
Place of birth for the foreign-born population - Croatia (%)
Place of birth for the foreign-born population - Czechoslovakia (%)
Place of birth for the foreign-born population - Hungary (%)
Place of birth for the foreign-born population - Latvia (%)
Place of birth for the foreign-born population - Lithuania (%)
Place of birth for the foreign-born population - North Macedonia (Macedonia) (%)
Place of birth for the foreign-born population - Moldova (%)
Place of birth for the foreign-born population - Poland (%)
Place of birth for the foreign-born population - Romania (%)
Place of birth for the foreign-born population - Russia (%)
Place of birth for the foreign-born population - Serbia (%)
Place of birth for the foreign-born population - Ukraine (%)
Place of birth for the foreign-born population - Other Eastern Europe (%)
Place of birth for the foreign-born population - China (%)
Place of birth for the foreign-born population - Hong Kong (%)
Place of birth for the foreign-born population - Taiwan (%)
Place of birth for the foreign-born population - Japan (%)
Place of birth for the foreign-born population - Korea (%)
Place of birth for the foreign-born population - Other Eastern Asia (%)
Place of birth for the foreign-born population - Afghanistan (%)
Place of birth for the foreign-born population - Bangladesh (%)
Place of birth for the foreign-born population - India (%)
Place of birth for the foreign-born population - Iran (%)
Place of birth for the foreign-born population - Kazakhstan (%)
Place of birth for the foreign-born population - Nepal (%)
Place of birth for the foreign-born population - Pakistan (%)
Place of birth for the foreign-born population - Sri Lanka (%)
Place of birth for the foreign-born population - Uzbekistan (%)
Place of birth for the foreign-born population - Other South Central Asia (%)
Place of birth for the foreign-born population - Burma (%)
Place of birth for the foreign-born population - Cambodia (%)
Place of birth for the foreign-born population - Indonesia (%)
Place of birth for the foreign-born population - Laos (%)
Place of birth for the foreign-born population - Malaysia (%)
Place of birth for the foreign-born population - Philippines (%)
Place of birth for the foreign-born population - Singapore (%)
Place of birth for the foreign-born population - Thailand (%)
Place of birth for the foreign-born population - Vietnam (%)
Place of birth for the foreign-born population - Other South Eastern Asia (%)
Place of birth for the foreign-born population - Armenia (%)
Place of birth for the foreign-born population - Iraq (%)
Place of birth for the foreign-born population - Israel (%)
Place of birth for the foreign-born population - Jordan (%)
Place of birth for the foreign-born population - Kuwait (%)
Place of birth for the foreign-born population - Lebanon (%)
Place of birth for the foreign-born population - Saudi Arabia (%)
Place of birth for the foreign-born population - Syria (%)
Place of birth for the foreign-born population - Turkey (%)
Place of birth for the foreign-born population - Yemen (%)
Place of birth for the foreign-born population - Other Western Asia (%)
Place of birth for the foreign-born population - Eritrea (%)
Place of birth for the foreign-born population - Ethiopia (%)
Place of birth for the foreign-born population - Kenya (%)
Place of birth for the foreign-born population - Somalia (%)
Place of birth for the foreign-born population - Uganda (%)
Place of birth for the foreign-born population - Zimbabwe (%)
Place of birth for the foreign-born population - Other Eastern Africa (%)
Place of birth for the foreign-born population - Cameroon (%)
Place of birth for the foreign-born population - Congo (%)
Place of birth for the foreign-born population - Democratic Republic of Congo (Zaire) (%)
Place of birth for the foreign-born population - Other Middle Africa (%)
Place of birth for the foreign-born population - Egypt (%)
Place of birth for the foreign-born population - Morocco (%)
Place of birth for the foreign-born population - Sudan (%)
Place of birth for the foreign-born population - Other Northern Africa (%)
Place of birth for the foreign-born population - South Africa (%)
Place of birth for the foreign-born population - Other Southern Africa (%)
Place of birth for the foreign-born population - Cabo Verde (%)
Place of birth for the foreign-born population - Ghana (%)
Place of birth for the foreign-born population - Liberia (%)
Place of birth for the foreign-born population - Nigeria (%)
Place of birth for the foreign-born population - Senegal (%)
Place of birth for the foreign-born population - Sierra Leone (%)
Place of birth for the foreign-born population - Other Western Africa (%)
Place of birth for the foreign-born population - Australia (%)
Place of birth for the foreign-born population - New Zealand (%)
Place of birth for the foreign-born population - Fiji (%)
Place of birth for the foreign-born population - Micronesia (%)
Place of birth for the foreign-born population - Bahamas (%)
Place of birth for the foreign-born population - Barbados (%)
Place of birth for the foreign-born population - Cuba (%)
Place of birth for the foreign-born population - Dominica (%)
Place of birth for the foreign-born population - Dominican Republic (%)
Place of birth for the foreign-born population - Grenada (%)
Place of birth for the foreign-born population - Haiti (%)
Place of birth for the foreign-born population - Jamaica (%)
Place of birth for the foreign-born population - St. Vincent and the Grenadines (%)
Place of birth for the foreign-born population - Trinidad and Tobago (%)
Place of birth for the foreign-born population - West Indies (%)
Place of birth for the foreign-born population - Other Caribbean (%)
Place of birth for the foreign-born population - Belize (%)
Place of birth for the foreign-born population - Costa Rica (%)
Place of birth for the foreign-born population - El Salvador (%)
Place of birth for the foreign-born population - Guatemala (%)
Place of birth for the foreign-born population - Honduras (%)
Place of birth for the foreign-born population - Mexico (%)
Place of birth for the foreign-born population - Nicaragua (%)
Place of birth for the foreign-born population - Panama (%)
Place of birth for the foreign-born population - Other Central America (%)
Place of birth for the foreign-born population - Argentina (%)
Place of birth for the foreign-born population - Bolivia (%)
Place of birth for the foreign-born population - Brazil (%)
Place of birth for the foreign-born population - Chile (%)
Place of birth for the foreign-born population - Colombia (%)
Place of birth for the foreign-born population - Ecuador (%)
Place of birth for the foreign-born population - Guyana (%)
Place of birth for the foreign-born population - Peru (%)
Place of birth for the foreign-born population - Uruguay (%)
Place of birth for the foreign-born population - Venezuela (%)
Place of birth for the foreign-born population - Other South America (%)
Place of birth for the foreign-born population - Canada (%)
Place of birth for the foreign-born population - Other Northern America (%)
Place of birth for the foreign-born population - Other (%)
Latest news about races in Erie, PA collected exclusively by city-data.com from local newspapers, TV, and radio stations
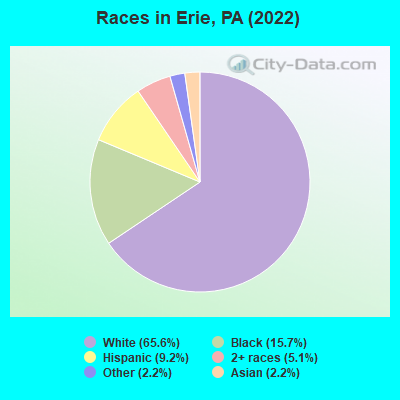
According to 2022 data, the most numerous races in Erie, PA are White alone (61,335 residents), Black alone (14,685 residents), and Hispanic (8,618 residents). 89.7% of Erie residents speak English at home. 7.2% of Erie, PA residents are foreign-born (2.8% born in Asia, 1.6% born in Europe, 1.1% born in Latin America, 1.1% born in Africa), which is 2.5% greater than the foreign-born rate of 7.0% across the entire state of Pennsylvania.
Race distribution in Erie
2000 2022
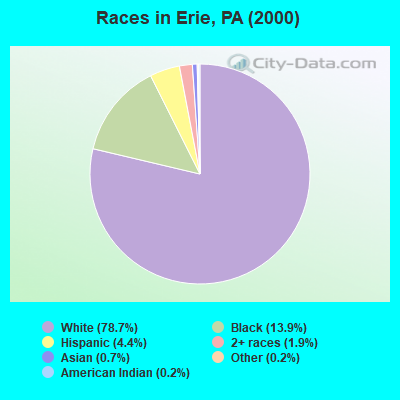
81,605 78.7% White alone 14,420 13.9% Black alone 4,572 4.4% Hispanic 1,957 1.9% Two or more races 756 0.7% Asian alone 189 0.2% Other race alone 181 0.2% American Indian alone 37 0.04% Native Hawaiian and Other
61,335 65.6% White alone 14,685 15.7% Black alone 8,618 9.2% Hispanic 4,758 5.1% Two or more races 2,029 2.2% Asian alone 2,092 2.2% Other race alone
2000 2022
10,322,455 84.1% White alone 1,202,437 9.8% Black alone 394,088 3.2% Hispanic 218,296 1.8% Asian alone 113,097 0.9% Two or more races 13,086 0.1% Other race alone 14,904 0.1% American Indian alone 2,691 0.02% Native Hawaiian and Other
9,487,228 73.1% White alone 1,311,581 10.1% Black alone 1,115,997 8.6% Hispanic 493,942 3.8% Two or more races 487,124 3.8% Asian alone 63,582 0.5% Other race alone 10,130 0.08% American Indian alone 2,424 0.02% Native Hawaiian and Other
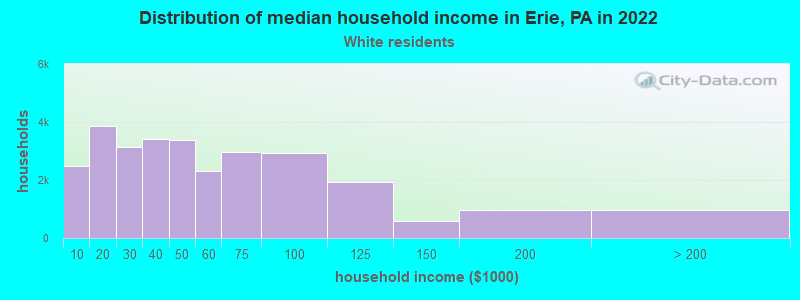
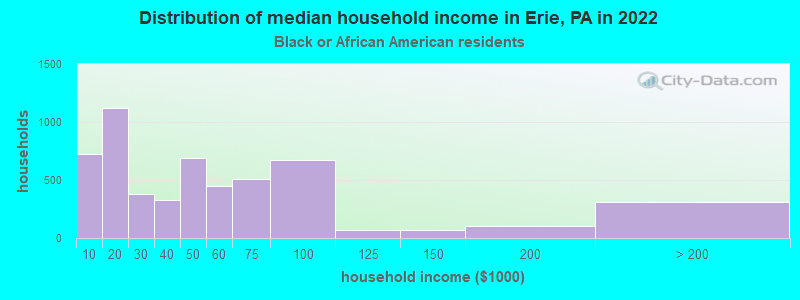
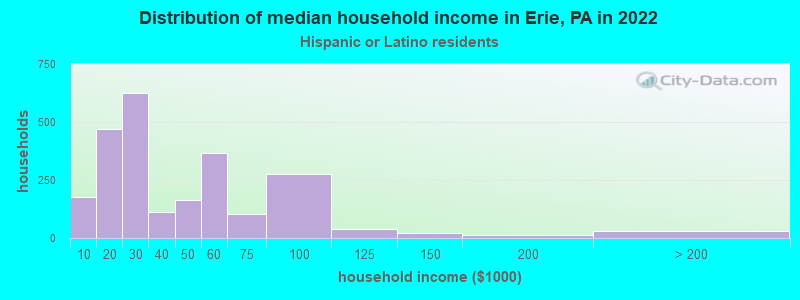
Income and house value in Erie Median household income in 2022 $44,535 White non-Hispanic householders$41,884 Black householders$46,077 Asian householders$38,777 Some other race householders$44,789 Two or more races householders$46,201 Hispanic or Latino race householdersMedian 2022 house value $101,690 White Non-Hispanic householders$70,576 Black or African American householders$144,188 American Indian or Alaska Native householders $98,655 Asian householders$208,693 Native Hawaiian and other Pacific Islander householders$76,495 Some other race householders$87,879 Two or more races householders$91,521 Hispanic or Latino householders
Median age by race in Erie
40.1 Median age for White residents35.7 46.2 30.8 Median age for Black or African American residents25.8 32.5 -666,666,666.0 Median age for American Indian / Alaska Native residents-666,666,666.0 -666,666,666.0 24.2 Median age for Asian residents24.0 29.5 -666,666,666.0 Median age for Native Hawaiian / Pacific Islander residents-666,666,666.0 -666,666,666.0 32.0 Median age for Other race residents29.1 35.4 27.5 Median age for Two or more races residents28.1 25.2 40.8 Median age for White alone residents36.2 46.9 27.1 Median age for Hispanic or Latino residents27.5 22.7
Owner/renter occupied households by race in Erie
House owners and renters - White residents 17,068 59.0% Owner occupied11,868 41.0% Renter occupiedHouse owners and renters - Black or African American residents 2,925 54.0% Owner occupied2,491 46.0% Renter occupiedHouse owners and renters - American Indian / Alaska Native residents 33 14.8% Owner occupied191 85.2% Renter occupiedHouse owners and renters - Asian residents 142 17.5% Owner occupied669 82.5% Renter occupiedHouse owners and renters - Other race residents 304 36.9% Owner occupied520 63.1% Renter occupiedHouse owners and renters - Two or more races residents 1,656 41.7% Owner occupied2,315 58.3% Renter occupiedHouse owners and renters - White alone residents 16,772 58.9% Owner occupied11,686 41.1% Renter occupiedHouse owners and renters - Hispanic or Latino residents 1,612 50.5% Owner occupied1,580 49.5% Renter occupied
Language usage in Erie
English speakers - Total 89.7% of residents of Erie speak English at home.
4.5% of residents speak Spanish at home 1,629 40.7% Speak English very well2,378 59.3% Speak English less than very well5.8% of residents speak other language at home 2,127 41.4% Speak English very well3,010 58.6% Speak English less than very well
English speakers - Born in the United States 94.1% of residents of Erie speak English at home.
4.4% of residents speak Spanish at home 324 44.0% Speak English very well413 56.0% Speak English less than very well1.5% of residents speak other language at home 241 98.8% Speak English very well3 1.2% Speak English less than very well
English speakers - Native, born elsewhere 27.5% of residents of Erie speak English at home.
69.3% of residents speak Spanish at home 238 18.1% Speak English very well1,075 81.9% Speak English less than very well3.2% of residents speak other language at home 61 100.0% Speak English very well
English speakers - Foreign-born 11.5% of residents of Erie speak English at home.
19.5% of residents speak Spanish at home 630 52.6% Speak English very well568 47.4% Speak English less than very well68.9% of residents speak other language at home 1,226 29.0% Speak English very well3,007 71.0% Speak English less than very well
White (Caucasian) - Speak only English Native:
97.2% (56,590)Foreign-born:
13.2% (309)
White (Caucasian) - Speak another language Native:
2.8% (1,632)Foreign-born:
86.8% (2,029)
Black or African American - Speak only English Native:
96.5% (12,697)Foreign-born:
43.7% (339)
Black or African American - Speak another language Native:
3.6% (469)Foreign-born:
55.2% (428)
American Indian / Alaska Native - Speak only English Native:
46.3% (220)Foreign-born:
20.7% (22)
American Indian / Alaska Native - Speak another language Native:
59.1% (281)Foreign-born:
82.0% (86)
Asian - Speak only English Native:
70.4% (267)Foreign-born:
7.2% (115)
Asian - Speak another language Native:
29.6% (112)Foreign-born:
92.8% (1,484)
Other race - Speak another language Native:
42.9% (984)Foreign-born:
100.0% (454)
Two or more races - Speak only English Native:
81.4% (6,539)Foreign-born:
4.8% (50)
Two or more races - Speak another language Native:
18.6% (1,494)Foreign-born:
95.2% (988)
White alone - Speak only English Native:
98.6% (56,050)Foreign-born:
13.4% (309)
White alone - Speak another language Native:
1.4% (805)Foreign-born:
86.6% (1,990)
Hispanic or Latino - Speak another language Native:
43.5% (2,785)Foreign-born:
100.0% (1,198)
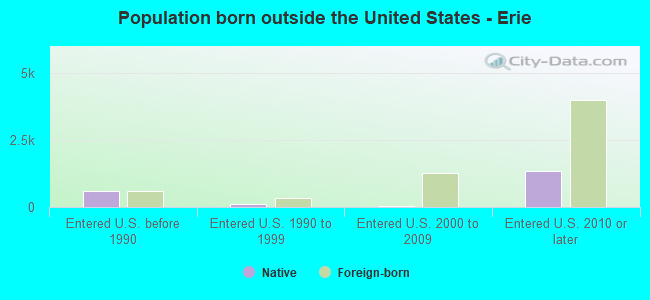
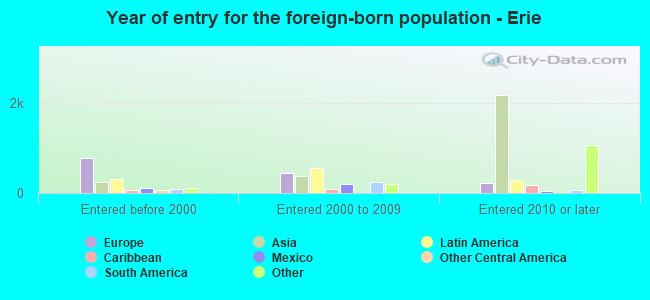
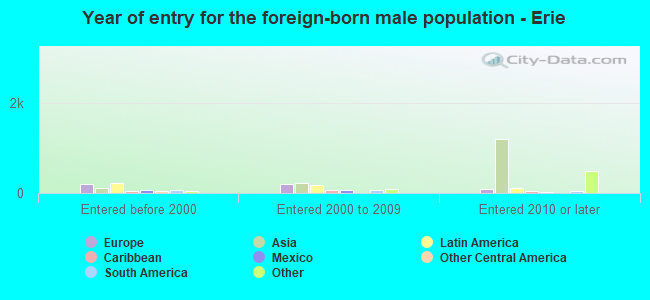
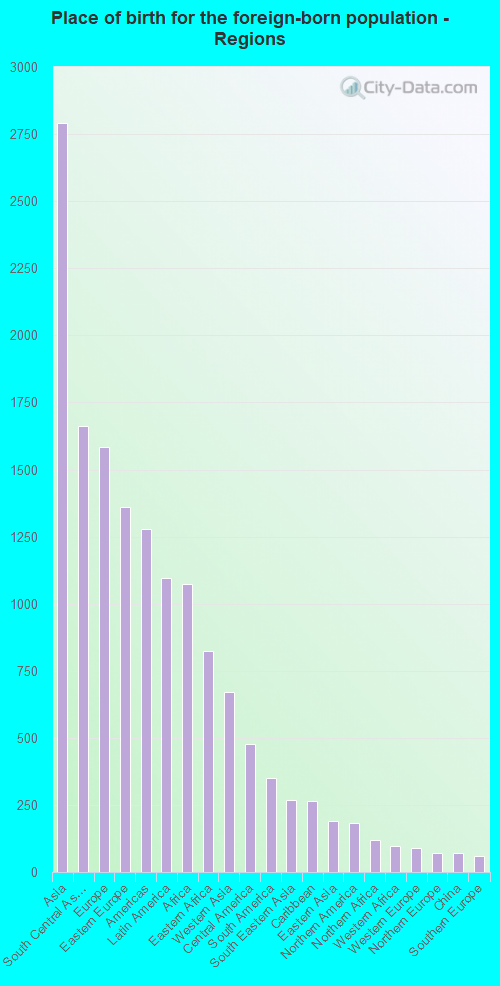
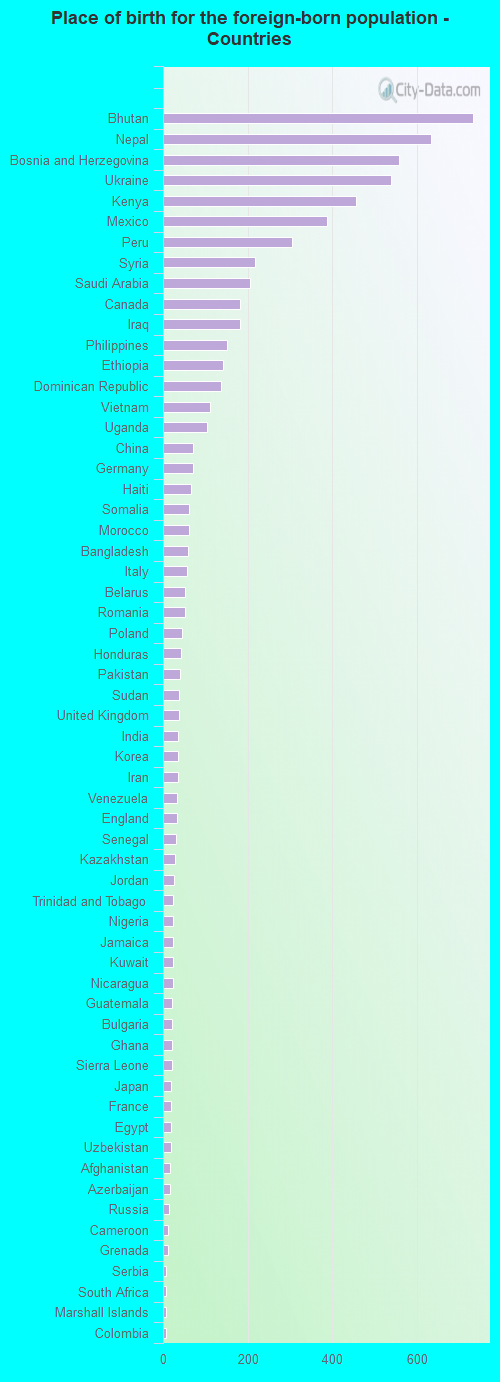
Foreign-born residents in Erie 6,736 residents are foreign born (2.8% Asia , 1.6% Europe , 1.1% Latin America , 1.1% Africa ).
This city:
7.2%Pennsylvania:
7.3%
Marital status for residents in Erie Marital status - White (Caucasian) population 15 years and over
Males 48.0% Never married34.5% Now married2.6% Separated3.0% Widowed11.9% DivorcedFemales 42.2% Never married31.4% Now married2.1% Separated9.8% Widowed14.6% DivorcedWomen who gave birth in the past 12 months Now married:
38.6% (413)Unmarried:
61.4% (656)
Women who did not give birth in the past 12 months Now married:
22.2% (2,925)Unmarried:
77.8% (10,265)
Marital status - Black or African American population 15 years and over
Males 65.1% Never married25.1% Now married0.3% Separated4.2% Widowed5.2% DivorcedFemales 48.2% Never married28.1% Now married4.3% Separated7.3% Widowed12.1% DivorcedWomen who gave birth in the past 12 months Now married:
26.9% (67)Unmarried:
73.1% (183)
Women who did not give birth in the past 12 months Now married:
16.7% (625)Unmarried:
83.3% (3,108)
Marital status - American Indian / Alaska Native population 15 years and over
Males 59.6% Never married5.1% Now married2.0% Separated22.7% Widowed10.6% DivorcedFemales 65.6% Never married27.3% Now married0.0% Separated0.0% Widowed7.1% DivorcedWomen who did not give birth in the past 12 months Now married:
36.9% (44)Unmarried:
63.1% (75)
Marital status - Asian population 15 years and over
Males 40.7% Never married48.2% Now married0.0% Separated6.1% Widowed4.9% DivorcedFemales 35.7% Never married54.2% Now married4.3% Separated3.3% Widowed2.6% DivorcedWomen who gave birth in the past 12 months Now married:
58.6% (18)Unmarried:
41.4% (13)
Women who did not give birth in the past 12 months Now married:
47.8% (270)Unmarried:
52.2% (295)
Marital status - Other race population 15 years and over
Males 56.3% Never married30.5% Now married2.6% Separated1.8% Widowed8.8% DivorcedFemales 41.8% Never married26.6% Now married16.9% Separated4.6% Widowed10.1% DivorcedWomen who gave birth in the past 12 months Now married:
34.2% (47)Unmarried:
65.8% (91)
Women who did not give birth in the past 12 months Now married:
47.3% (342)Unmarried:
52.7% (381)
Marital status - Two or more races population 15 years and over
Males 54.6% Never married35.0% Now married0.0% Separated0.4% Widowed10.0% DivorcedFemales 52.9% Never married41.2% Now married0.0% Separated1.7% Widowed4.2% DivorcedWomen who gave birth in the past 12 months Now married:
100.0% (291)Unmarried:
0.0% (0)
Women who did not give birth in the past 12 months Now married:
22.4% (538)Unmarried:
77.6% (1,864)
Marital status - White alone, not Hispanic / Latino population 15 years and over
Males 47.8% Never married34.4% Now married2.6% Separated3.0% Widowed12.1% DivorcedFemales 41.9% Never married31.5% Now married2.1% Separated9.9% Widowed14.6% DivorcedWomen who gave birth in the past 12 months Now married:
46.6% (413)Unmarried:
53.4% (474)
Women who did not give birth in the past 12 months Now married:
22.4% (2,925)Unmarried:
77.6% (10,129)
Marital status - Hispanic or Latino population 15 years and over
Males 61.2% Never married28.5% Now married1.0% Separated0.7% Widowed8.6% DivorcedFemales 47.2% Never married30.5% Now married6.2% Separated2.8% Widowed13.3% DivorcedWomen who gave birth in the past 12 months Now married:
59.5% (218)Unmarried:
40.5% (148)
Women who did not give birth in the past 12 months Now married:
31.4% (570)Unmarried:
68.6% (1,242)
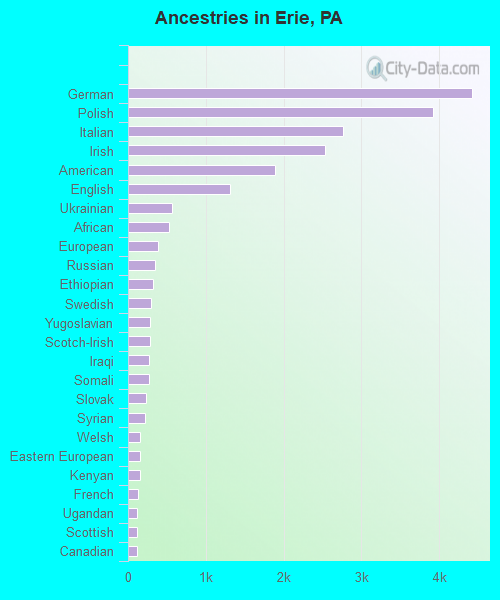
Ancestries in Erie
4,421 11.1% German3,924 9.8% Polish2,764 6.9% Italian2,529 6.3% Irish1,887 4.7% American1,311 3.3% English562 1.4% Ukrainian531 1.3% African390 1.0% European345 0.9% Russian321 0.8% Ethiopian297 0.7% Swedish284 0.7% Yugoslavian282 0.7% Scotch-Irish276 0.7% Iraqi272 0.7% Somali226 0.6% Slovak220 0.6% Syrian159 0.4% Welsh156 0.4% Eastern European150 0.4% Kenyan128 0.3% French114 0.3% Ugandan114 0.3% Scottish113 0.3% Canadian93 0.2% Sudanese89 0.2% Arab79 0.2% Jamaican76 0.2% Lithuanian68 0.2% Albanian64 0.2% Pennsylvania German62 0.2% Czech61 0.2% Moroccan60 0.2% Slavic55 0.1% Croatian54 0.1% Assyrian52 0.1% Armenian49 0.1% Dutch46 0.1% French Canadian45 0.1% Palestinian42 0.1% Haitian40 0.1% Lebanese40 0.1% Hungarian34 0.09% Norwegian31 0.08% British29 0.07% Bulgarian28 0.07% Danish26 0.07% Czechoslovakian26 0.07% Romanian22 0.06% Belgian21 0.05% Iranian17 0.04% Egyptian17 0.04% Scandinavian14 0.04% Portuguese13 0.03% Carpatho Rusyn10 0.03% Senegalese10 0.03% Afghan8 0.02% Northern European8 0.02% Nigerian7 0.02% Guyanese7 0.02% Greek6 0.02% Austrian4 0.01% Basque
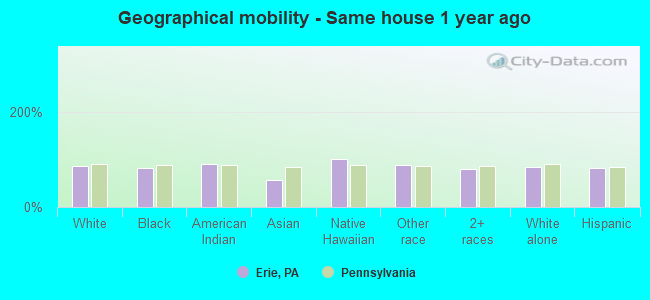
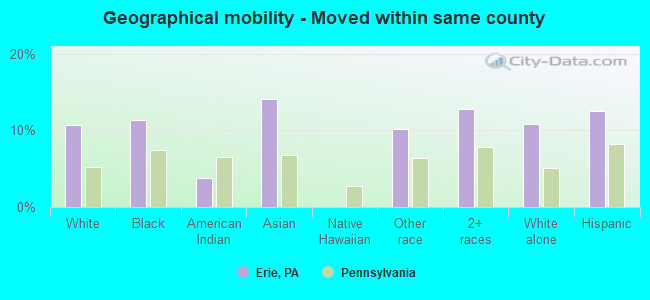
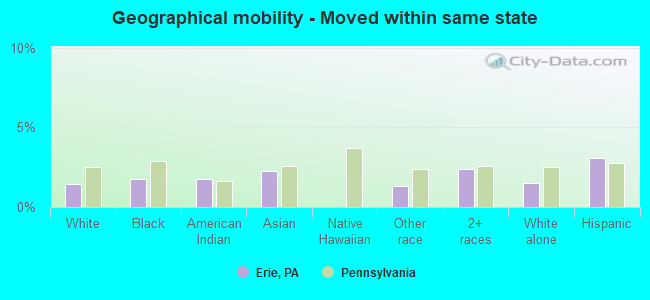
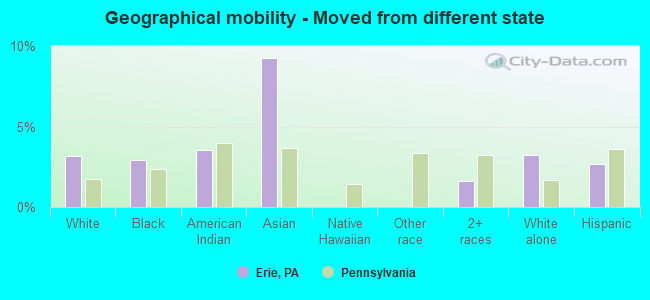
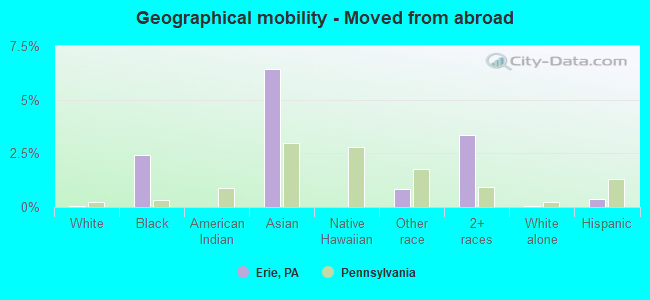
Geographical mobility in Erie Same house 1 year ago 52,761 84.6% White (Caucasian)12,088 81.5% Black or African American538 90.4% American Indian / Alaska Native1,376 56.5% Asian33 100.0% Native Hawaiian / Pacific Islander2,588 86.7% Other race7,277 79.8% Two or more races51,451 84.4% White alone, not Hispanic / Latino6,486 80.7% Hispanic or LatinoMoved within same county 6,664 10.7% White / Caucasian1,688 11.4% Black or African American23 3.8% American Indian / Alaska Native344 14.1% Asian303 10.1% Other race1,165 12.8% Two or more races6,603 10.8% White alone, not Hispanic / Latino1,003 12.5% Hispanic or LatinoMoved within same state 909 1.5% White / Caucasian257 1.7% Black or African American11 1.8% American Indian / Alaska Native56 2.3% Asian39 1.3% Other race218 2.4% Two or more races909 1.5% White alone, not Hispanic / Latino245 3.1% Hispanic or LatinoMoved from different state 1,986 3.2% White / Caucasian436 2.9% Black or African American21 3.5% American Indian / Alaska Native226 9.3% Asian149 1.6% Two or more races1,951 3.2% White alone, not Hispanic / Latino217 2.7% Hispanic or LatinoMoved from abroad 27 0.0% White357 2.4% Black or African American157 6.4% Asian26 0.9% Other race304 3.3% Two or more races27 0.0% White alone, not Hispanic / Latino29 0.4% Hispanic or Latino
Children Nativity (place of birth) in Erie
Children under 6 years - Living with two parents Both parents native 1,394 100.0% NativeBoth parents foreign-born 702 90.2% Native76 9.8% Foreign-bornOne native, one foreign-born parent 542 100.0% NativeChildren under 6 years - Living with one parent Native parent 2,744 100.0% NativeForeign-born parent 295 70.0% Native126 30.0% Foreign-bornChildren 6 to 17 years - Living with two parents Both parents native 3,757 100.0% NativeBoth parents foreign-born 561 43.3% Native736 56.7% Foreign-bornOne native, one foreign-born parent 169 92.3% Native14 7.7% Foreign-bornChildren 6 to 17 years - Living with one parent Native parent 7,198 100.0% NativeForeign-born parent 351 58.1% Native253 41.9% Foreign-born
Grandparents responsible for own grandchildren in Erie
Grandparents (30 to 59 years) White / Caucasian 182 51.5% Responsible for grandchildren171 48.5% Not responsible for grandchildrenBlack or African American 56 38.6% Responsible for grandchildren90 61.4% Not responsible for grandchildrenAsian 106 100.0% Not responsible for grandchildrenOther race 6 10.3% Responsible for grandchildren53 89.7% Not responsible for grandchildrenTwo or more races 69 57.7% Responsible for grandchildren51 42.3% Not responsible for grandchildrenWhite alone, not Hispanic / Latino 182 59.2% Responsible for grandchildren125 40.8% Not responsible for grandchildrenHispanic or Latino 28 26.1% Responsible for grandchildren80 73.9% Not responsible for grandchildrenGrandparents (60 years and over) White / Caucasian 127 27.2% Responsible for grandchildren339 72.8% Not responsible for grandchildrenBlack or African American 70 48.3% Responsible for grandchildren75 51.7% Not responsible for grandchildrenAsian 30 100.0% Not responsible for grandchildrenOther race 56 100.0% Not responsible for grandchildrenTwo or more races 56 22.2% Responsible for grandchildren197 77.8% Not responsible for grandchildrenWhite alone, not Hispanic / Latino 127 28.7% Responsible for grandchildren316 71.3% Not responsible for grandchildrenHispanic or Latino 273 100.0% Not responsible for grandchildren
Zip codes: 16501 , 16502 , 16503 , 16504 , 16505 , 16506 , 16507 , 16508 , 16509 , 16510 , 16511 , 16546 .