Races in Evanston, Illinois (IL) Detailed Stats
Data:
Races - White alone (%)
Races - White alone (% change since 2000)
Races - Black alone (%)
Races - Black alone (% change since 2000)
Races - American Indian alone (%)
Races - American Indian alone (% change since 2000)
Races - Asian alone (%)
Races - Asian alone (% change since 2000)
Races - Hispanic (%)
Races - Hispanic (% change since 2000)
Races - Native Hawaiian and Other Pacific Islander alone (%)
Races - Native Hawaiian and Other Pacific Islander alone (% change since 2000)
Races - Two or more races(%)
Races - Two or more races(% change since 2000)
Races - Other race alone (%)
Races - Other race alone (% change since 2000)
Racial diversity
Place of birth - Born in state of residence (%)
Place of birth - Born in state of residence (%) - White
Place of birth - Born in state of residence (%) - Black or African American
Place of birth - Born in state of residence (%) - Asian
Place of birth - Born in state of residence (%) - Hispanic or Latino
Place of birth - Born in state of residence (%) - American Indian and Alaska Native
Place of birth - Born in state of residence (%) - Multirace
Place of birth - Born in state of residence (%) - Other Race
Place of birth - Born in other state (%)
Place of birth - Born in other state (%) - White
Place of birth - Born in other state (%) - Black or African American
Place of birth - Born in other state (%) - Asian
Place of birth - Born in other state (%) - Hispanic or Latino
Place of birth - Born in other state (%) - American Indian and Alaska Native
Place of birth - Born in other state (%) - Multirace
Place of birth - Born in other state (%) - Other Race
Place of birth - Native, outside of US (%)
Place of birth - Native, outside of US (%) - White
Place of birth - Native, outside of US (%) - Black or African American
Place of birth - Native, outside of US (%) - Asian
Place of birth - Native, outside of US (%) - Hispanic or Latino
Place of birth - Native, outside of US (%) - American Indian and Alaska Native
Place of birth - Native, outside of US (%) - Multirace
Place of birth - Native, outside of US (%) - Other Race
Place of birth - Foreign born (%)
Place of birth - Foreign born (%) - White
Place of birth - Foreign born (%) - Black or African American
Place of birth - Foreign born (%) - Asian
Place of birth - Foreign born (%) - Hispanic or Latino
Place of birth - Foreign born (%) - American Indian and Alaska Native
Place of birth - Foreign born (%) - Multirace
Place of birth - Foreign born (%) - Other Race
Residents speaking English at home (%)
Residents speaking English at home - Born in the United States (%)
Residents speaking English at home - Native, born elsewhere (%)
Residents speaking English at home - Foreign born (%)
Residents speaking Spanish at home (%)
Residents speaking Spanish at home - Born in the United States (%)
Residents speaking Spanish at home - Native, born elsewhere (%)
Residents speaking Spanish at home - Foreign born (%)
Residents speaking other language at home (%)
Residents speaking other language at home - Born in the United States (%)
Residents speaking other language at home - Native, born elsewhere (%)
Residents speaking other language at home - Foreign born (%)
Marital status - Never married (%)
Marital status - Now married (%)
Marital status - Separated (%)
Marital status - Widowed (%)
Marital status - Divorced (%)
Ancestries Reported - Arab (%)
Ancestries Reported - Czech (%)
Ancestries Reported - Danish (%)
Ancestries Reported - Dutch (%)
Ancestries Reported - English (%)
Ancestries Reported - French (%)
Ancestries Reported - French Canadian (%)
Ancestries Reported - German (%)
Ancestries Reported - Greek (%)
Ancestries Reported - Hungarian (%)
Ancestries Reported - Irish (%)
Ancestries Reported - Italian (%)
Ancestries Reported - Lithuanian (%)
Ancestries Reported - Norwegian (%)
Ancestries Reported - Polish (%)
Ancestries Reported - Portuguese (%)
Ancestries Reported - Russian (%)
Ancestries Reported - Scotch-Irish (%)
Ancestries Reported - Scottish (%)
Ancestries Reported - Slovak (%)
Ancestries Reported - Subsaharan African (%)
Ancestries Reported - Swedish (%)
Ancestries Reported - Swiss (%)
Ancestries Reported - Ukrainian (%)
Ancestries Reported - United States (%)
Ancestries Reported - Welsh (%)
Ancestries Reported - West Indian (%)
Ancestries Reported - Other (%)
Geographical mobility - Same house 1 year ago (%)
Geographical mobility - Same house 1 year ago (%) - White
Geographical mobility - Same house 1 year ago (%) - Black or African American
Geographical mobility - Same house 1 year ago (%) - Asian
Geographical mobility - Same house 1 year ago (%) - Hispanic or Latino
Geographical mobility - Same house 1 year ago (%) - American Indian and Alaska Native
Geographical mobility - Same house 1 year ago (%) - Multirace
Geographical mobility - Same house 1 year ago (%) - Other Race
Geographical mobility - Moved within same county (%)
Geographical mobility - Moved within same county (%) - White
Geographical mobility - Moved within same county (%) - Black or African American
Geographical mobility - Moved within same county (%) - Asian
Geographical mobility - Moved within same county (%) - Hispanic or Latino
Geographical mobility - Moved within same county (%) - American Indian and Alaska Native
Geographical mobility - Moved within same county (%) - Multirace
Geographical mobility - Moved within same county (%) - Other Race
Geographical mobility - Moved from different county within same state (%)
Geographical mobility - Moved from different county within same state (%) - White
Geographical mobility - Moved from different county within same state (%) - Black or African American
Geographical mobility - Moved from different county within same state (%) - Asian
Geographical mobility - Moved from different county within same state (%) - Hispanic or Latino
Geographical mobility - Moved from different county within same state (%) - American Indian and Alaska Native
Geographical mobility - Moved from different county within same state (%) - Multirace
Geographical mobility - Moved from different county within same state (%) - Other Race
Geographical mobility - Moved from different state (%)
Geographical mobility - Moved from different state (%) - White
Geographical mobility - Moved from different state (%) - Black or African American
Geographical mobility - Moved from different state (%) - Asian
Geographical mobility - Moved from different state (%) - Hispanic or Latino
Geographical mobility - Moved from different state (%) - American Indian and Alaska Native
Geographical mobility - Moved from different state (%) - Multirace
Geographical mobility - Moved from different state (%) - Other Race
Geographical mobility - Moved from abroad (%)
Geographical mobility - Moved from abroad (%) - White
Geographical mobility - Moved from abroad (%) - Black or African American
Geographical mobility - Moved from abroad (%) - Asian
Geographical mobility - Moved from abroad (%) - Hispanic or Latino
Geographical mobility - Moved from abroad (%) - American Indian and Alaska Native
Geographical mobility - Moved from abroad (%) - Multirace
Geographical mobility - Moved from abroad (%) - Other Race
Place of birth for the foreign-born population - Ireland (%)
Place of birth for the foreign-born population - Denmark (%)
Place of birth for the foreign-born population - Norway (%)
Place of birth for the foreign-born population - Sweden (%)
Place of birth for the foreign-born population - United Kingdom (%)
Place of birth for the foreign-born population - England (%)
Place of birth for the foreign-born population - Scotland (%)
Place of birth for the foreign-born population - Other Northern Europe (%)
Place of birth for the foreign-born population - Austria (%)
Place of birth for the foreign-born population - Belgium (%)
Place of birth for the foreign-born population - France (%)
Place of birth for the foreign-born population - Germany (%)
Place of birth for the foreign-born population - Netherlands (%)
Place of birth for the foreign-born population - Switzerland (%)
Place of birth for the foreign-born population - Other Western Europe (%)
Place of birth for the foreign-born population - Greece (%)
Place of birth for the foreign-born population - Italy (%)
Place of birth for the foreign-born population - Portugal (%)
Place of birth for the foreign-born population - Spain (%)
Place of birth for the foreign-born population - Other Southern Europe (%)
Place of birth for the foreign-born population - Albania (%)
Place of birth for the foreign-born population - Belarus (%)
Place of birth for the foreign-born population - Bosnia and Herzegovina (%)
Place of birth for the foreign-born population - Bulgaria (%)
Place of birth for the foreign-born population - Croatia (%)
Place of birth for the foreign-born population - Czechoslovakia (%)
Place of birth for the foreign-born population - Hungary (%)
Place of birth for the foreign-born population - Latvia (%)
Place of birth for the foreign-born population - Lithuania (%)
Place of birth for the foreign-born population - North Macedonia (Macedonia) (%)
Place of birth for the foreign-born population - Moldova (%)
Place of birth for the foreign-born population - Poland (%)
Place of birth for the foreign-born population - Romania (%)
Place of birth for the foreign-born population - Russia (%)
Place of birth for the foreign-born population - Serbia (%)
Place of birth for the foreign-born population - Ukraine (%)
Place of birth for the foreign-born population - Other Eastern Europe (%)
Place of birth for the foreign-born population - China (%)
Place of birth for the foreign-born population - Hong Kong (%)
Place of birth for the foreign-born population - Taiwan (%)
Place of birth for the foreign-born population - Japan (%)
Place of birth for the foreign-born population - Korea (%)
Place of birth for the foreign-born population - Other Eastern Asia (%)
Place of birth for the foreign-born population - Afghanistan (%)
Place of birth for the foreign-born population - Bangladesh (%)
Place of birth for the foreign-born population - India (%)
Place of birth for the foreign-born population - Iran (%)
Place of birth for the foreign-born population - Kazakhstan (%)
Place of birth for the foreign-born population - Nepal (%)
Place of birth for the foreign-born population - Pakistan (%)
Place of birth for the foreign-born population - Sri Lanka (%)
Place of birth for the foreign-born population - Uzbekistan (%)
Place of birth for the foreign-born population - Other South Central Asia (%)
Place of birth for the foreign-born population - Burma (%)
Place of birth for the foreign-born population - Cambodia (%)
Place of birth for the foreign-born population - Indonesia (%)
Place of birth for the foreign-born population - Laos (%)
Place of birth for the foreign-born population - Malaysia (%)
Place of birth for the foreign-born population - Philippines (%)
Place of birth for the foreign-born population - Singapore (%)
Place of birth for the foreign-born population - Thailand (%)
Place of birth for the foreign-born population - Vietnam (%)
Place of birth for the foreign-born population - Other South Eastern Asia (%)
Place of birth for the foreign-born population - Armenia (%)
Place of birth for the foreign-born population - Iraq (%)
Place of birth for the foreign-born population - Israel (%)
Place of birth for the foreign-born population - Jordan (%)
Place of birth for the foreign-born population - Kuwait (%)
Place of birth for the foreign-born population - Lebanon (%)
Place of birth for the foreign-born population - Saudi Arabia (%)
Place of birth for the foreign-born population - Syria (%)
Place of birth for the foreign-born population - Turkey (%)
Place of birth for the foreign-born population - Yemen (%)
Place of birth for the foreign-born population - Other Western Asia (%)
Place of birth for the foreign-born population - Eritrea (%)
Place of birth for the foreign-born population - Ethiopia (%)
Place of birth for the foreign-born population - Kenya (%)
Place of birth for the foreign-born population - Somalia (%)
Place of birth for the foreign-born population - Uganda (%)
Place of birth for the foreign-born population - Zimbabwe (%)
Place of birth for the foreign-born population - Other Eastern Africa (%)
Place of birth for the foreign-born population - Cameroon (%)
Place of birth for the foreign-born population - Congo (%)
Place of birth for the foreign-born population - Democratic Republic of Congo (Zaire) (%)
Place of birth for the foreign-born population - Other Middle Africa (%)
Place of birth for the foreign-born population - Egypt (%)
Place of birth for the foreign-born population - Morocco (%)
Place of birth for the foreign-born population - Sudan (%)
Place of birth for the foreign-born population - Other Northern Africa (%)
Place of birth for the foreign-born population - South Africa (%)
Place of birth for the foreign-born population - Other Southern Africa (%)
Place of birth for the foreign-born population - Cabo Verde (%)
Place of birth for the foreign-born population - Ghana (%)
Place of birth for the foreign-born population - Liberia (%)
Place of birth for the foreign-born population - Nigeria (%)
Place of birth for the foreign-born population - Senegal (%)
Place of birth for the foreign-born population - Sierra Leone (%)
Place of birth for the foreign-born population - Other Western Africa (%)
Place of birth for the foreign-born population - Australia (%)
Place of birth for the foreign-born population - New Zealand (%)
Place of birth for the foreign-born population - Fiji (%)
Place of birth for the foreign-born population - Micronesia (%)
Place of birth for the foreign-born population - Bahamas (%)
Place of birth for the foreign-born population - Barbados (%)
Place of birth for the foreign-born population - Cuba (%)
Place of birth for the foreign-born population - Dominica (%)
Place of birth for the foreign-born population - Dominican Republic (%)
Place of birth for the foreign-born population - Grenada (%)
Place of birth for the foreign-born population - Haiti (%)
Place of birth for the foreign-born population - Jamaica (%)
Place of birth for the foreign-born population - St. Vincent and the Grenadines (%)
Place of birth for the foreign-born population - Trinidad and Tobago (%)
Place of birth for the foreign-born population - West Indies (%)
Place of birth for the foreign-born population - Other Caribbean (%)
Place of birth for the foreign-born population - Belize (%)
Place of birth for the foreign-born population - Costa Rica (%)
Place of birth for the foreign-born population - El Salvador (%)
Place of birth for the foreign-born population - Guatemala (%)
Place of birth for the foreign-born population - Honduras (%)
Place of birth for the foreign-born population - Mexico (%)
Place of birth for the foreign-born population - Nicaragua (%)
Place of birth for the foreign-born population - Panama (%)
Place of birth for the foreign-born population - Other Central America (%)
Place of birth for the foreign-born population - Argentina (%)
Place of birth for the foreign-born population - Bolivia (%)
Place of birth for the foreign-born population - Brazil (%)
Place of birth for the foreign-born population - Chile (%)
Place of birth for the foreign-born population - Colombia (%)
Place of birth for the foreign-born population - Ecuador (%)
Place of birth for the foreign-born population - Guyana (%)
Place of birth for the foreign-born population - Peru (%)
Place of birth for the foreign-born population - Uruguay (%)
Place of birth for the foreign-born population - Venezuela (%)
Place of birth for the foreign-born population - Other South America (%)
Place of birth for the foreign-born population - Canada (%)
Place of birth for the foreign-born population - Other Northern America (%)
Place of birth for the foreign-born population - Other (%)
Latest news about races in Evanston, IL collected exclusively by city-data.com from local newspapers, TV, and radio stations
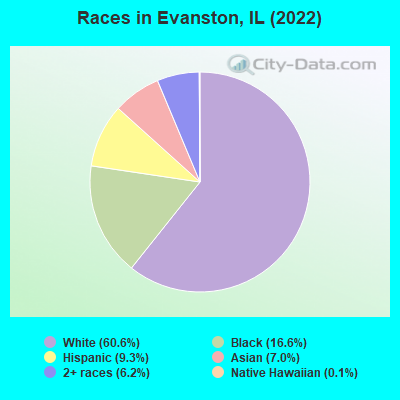
According to 2022 data, the most numerous races in Evanston, IL are White alone (45,789 residents), Hispanic (7,006 residents), and Black alone (12,556 residents). 80.2% of Evanston residents speak English at home. 16.5% of Evanston, IL residents are foreign-born (6.2% born in Asia, 4.2% born in Latin America, 3.4% born in Europe, 2.1% born in Africa), which is 15.4% greater than the foreign-born rate of 14.0% across the entire state of Illinois.
Race distribution in Evanston
2000 2022
46,444 62.6% White alone 16,449 22.2% Black alone 4,539 6.1% Hispanic 4,505 6.1% Asian alone 1,876 2.5% Two or more races 282 0.4% Other race alone 92 0.1% American Indian alone 52 0.07% Native Hawaiian and Other
45,789 60.6% White alone 12,556 16.6% Black alone 7,006 9.3% Hispanic 5,321 7.0% Asian alone 4,706 6.2% Two or more races 104 0.1% Native Hawaiian and Other 42 0.06% American Indian alone 14 0.02% Other race alone
2000 2022
8,424,140 67.8% White alone 1,856,152 14.9% Black alone 1,530,262 12.3% Hispanic 419,916 3.4% Asian alone 153,996 1.2% Two or more races 13,479 0.1% Other race alone 18,232 0.1% American Indian alone 3,116 0.03% Native Hawaiian and Other
7,356,301 58.5% White alone 2,299,726 18.3% Hispanic 1,660,423 13.2% Black alone 747,296 5.9% Asian alone 458,599 3.6% Two or more races 45,386 0.4% Other race alone 10,405 0.08% American Indian alone 3,896 0.03% Native Hawaiian and Other
Income and house value in Evanston Median household income in 2022 $111,905 White non-Hispanic householders$55,110 Black householders$118,931 Asian householders$74,649 Some other race householders$97,002 Two or more races householders$82,995 Hispanic or Latino race householdersMedian 2022 house value $675,147 White Non-Hispanic householders$309,426 Black or African American householders$330,928 American Indian or Alaska Native householders $422,993 Asian householders$219,901 Native Hawaiian and other Pacific Islander householders$310,403 Some other race householders$387,613 Two or more races householders$386,050 Hispanic or Latino householders
Median age by race in Evanston
44.7 Median age for White residents44.8 44.7 42.2 Median age for Black or African American residents35.4 43.8 -666,666,666.0 Median age for American Indian / Alaska Native residents-666,666,666.0 -666,666,666.0 30.5 Median age for Asian residents30.7 28.7 21.6 Median age for Native Hawaiian / Pacific Islander residents-918,721,460.3 19.1 33.6 Median age for Other race residents33.3 43.1 27.6 Median age for Two or more races residents27.0 29.8 44.9 Median age for White alone residents44.6 45.2 29.0 Median age for Hispanic or Latino residents37.0 25.1
Owner/renter occupied households by race in Evanston
House owners and renters - White residents 14,817 65.5% Owner occupied7,790 34.5% Renter occupiedHouse owners and renters - Black or African American residents 1,627 29.6% Owner occupied3,871 70.4% Renter occupiedHouse owners and renters - American Indian / Alaska Native residents 60 48.1% Owner occupied65 51.9% Renter occupiedHouse owners and renters - Asian residents 1,062 52.6% Owner occupied957 47.4% Renter occupiedHouse owners and renters - Other race residents 141 16.7% Owner occupied702 83.3% Renter occupiedHouse owners and renters - Two or more races residents 1,085 47.4% Owner occupied1,205 52.6% Renter occupiedHouse owners and renters - White alone residents 14,451 65.8% Owner occupied7,506 34.2% Renter occupiedHouse owners and renters - Hispanic or Latino residents 923 37.1% Owner occupied1,565 62.9% Renter occupied
Language usage in Evanston
English speakers - Total 80.2% of residents of Evanston speak English at home.
7.3% of residents speak Spanish at home 3,970 75.0% Speak English very well1,326 25.0% Speak English less than very well12.6% of residents speak other language at home 8,141 88.7% Speak English very well1,033 11.3% Speak English less than very well
English speakers - Born in the United States 90.1% of residents of Evanston speak English at home.
4.1% of residents speak Spanish at home 935 86.5% Speak English very well146 13.5% Speak English less than very well5.9% of residents speak other language at home 1,520 97.1% Speak English very well46 2.9% Speak English less than very well
English speakers - Native, born elsewhere 73.7% of residents of Evanston speak English at home.
5.8% of residents speak Spanish at home 88 100.0% Speak English very well20.5% of residents speak other language at home 312 100.0% Speak English very well
English speakers - Foreign-born 28.6% of residents of Evanston speak English at home.
19.4% of residents speak Spanish at home 881 43.7% Speak English very well1,135 56.3% Speak English less than very well52.1% of residents speak other language at home 4,494 83.0% Speak English very well920 17.0% Speak English less than very well
White (Caucasian) - Speak only English Native:
93.0% (39,648)Foreign-born:
24.0% (656)
White (Caucasian) - Speak another language Native:
7.0% (2,987)Foreign-born:
76.0% (2,082)
Black or African American - Speak only English Native:
95.9% (10,168)Foreign-born:
57.3% (991)
Black or African American - Speak another language Native:
4.1% (437)Foreign-born:
42.7% (739)
American Indian / Alaska Native - Speak another language Native:
40.8% (101)Foreign-born:
100.0% (105)
Asian - Speak only English Native:
50.7% (1,036)Foreign-born:
32.9% (1,083)
Asian - Speak another language Native:
49.3% (1,006)Foreign-born:
67.1% (2,211)
Other race - Speak only English Native:
33.2% (645)Foreign-born:
1.4% (15)
Other race - Speak another language Native:
67.5% (1,310)Foreign-born:
99.1% (1,062)
Two or more races - Speak only English Native:
82.0% (4,582)Foreign-born:
14.0% (197)
Two or more races - Speak another language Native:
18.0% (1,005)Foreign-born:
86.0% (1,206)
White alone - Speak only English Native:
93.6% (38,690)Foreign-born:
24.5% (656)
White alone - Speak another language Native:
6.4% (2,666)Foreign-born:
75.5% (2,026)
Hispanic or Latino - Speak only English Native:
50.4% (2,466)Foreign-born:
4.4% (90)
Hispanic or Latino - Speak another language Native:
49.6% (2,424)Foreign-born:
95.6% (1,972)
Foreign-born residents in Evanston 12,482 residents are foreign born (6.2% Asia , 4.2% Latin America , 3.4% Europe , 2.1% Africa ).
This city:
16.5%Illinois:
14.1%
Marital status for residents in Evanston Marital status - White (Caucasian) population 15 years and over
Males 33.7% Never married53.3% Now married0.0% Separated2.8% Widowed10.3% DivorcedFemales 41.9% Never married42.3% Now married0.6% Separated6.3% Widowed8.8% DivorcedWomen who gave birth in the past 12 months Now married:
100.0% (369)Unmarried:
0.0% (0)
Women who did not give birth in the past 12 months Now married:
32.8% (3,558)Unmarried:
67.2% (7,279)
Marital status - Black or African American population 15 years and over
Males 58.2% Never married22.3% Now married0.0% Separated0.0% Widowed19.5% DivorcedFemales 56.4% Never married22.3% Now married0.7% Separated8.5% Widowed12.0% DivorcedWomen who gave birth in the past 12 months Now married:
69.9% (182)Unmarried:
30.1% (78)
Women who did not give birth in the past 12 months Now married:
19.6% (557)Unmarried:
80.4% (2,279)
Marital status - American Indian / Alaska Native population 15 years and over
Males 35.5% Never married64.5% Now married0.0% Separated0.0% Widowed0.0% DivorcedFemales 47.0% Never married53.0% Now married0.0% Separated0.0% Widowed0.0% DivorcedWomen who did not give birth in the past 12 months Now married:
39.7% (56)Unmarried:
60.3% (85)
Marital status - Asian population 15 years and over
Males 60.6% Never married32.0% Now married0.5% Separated0.0% Widowed7.0% DivorcedFemales 59.7% Never married34.6% Now married0.6% Separated3.7% Widowed1.3% DivorcedWomen who gave birth in the past 12 months Now married:
100.0% (96)Unmarried:
0.0% (0)
Women who did not give birth in the past 12 months Now married:
27.3% (646)Unmarried:
72.7% (1,722)
Marital status - Other race population 15 years and over
Males 55.7% Never married30.3% Now married2.6% Separated3.7% Widowed7.6% DivorcedFemales 54.2% Never married28.9% Now married3.8% Separated0.7% Widowed12.5% DivorcedWomen who gave birth in the past 12 months Now married:
80.4% (46)Unmarried:
19.6% (11)
Women who did not give birth in the past 12 months Now married:
23.2% (152)Unmarried:
76.8% (505)
Marital status - Two or more races population 15 years and over
Males 56.9% Never married36.4% Now married0.5% Separated0.9% Widowed5.4% DivorcedFemales 51.6% Never married30.9% Now married0.0% Separated2.5% Widowed14.9% DivorcedWomen who gave birth in the past 12 months Now married:
100.0% (51)Unmarried:
0.0% (0)
Women who did not give birth in the past 12 months Now married:
26.0% (610)Unmarried:
74.0% (1,738)
Marital status - White alone, not Hispanic / Latino population 15 years and over
Males 33.9% Never married53.5% Now married0.0% Separated2.9% Widowed9.7% DivorcedFemales 40.1% Never married43.4% Now married0.7% Separated6.6% Widowed9.2% DivorcedWomen who gave birth in the past 12 months Now married:
100.0% (369)Unmarried:
0.0% (0)
Women who did not give birth in the past 12 months Now married:
34.3% (3,424)Unmarried:
65.7% (6,559)
Marital status - Hispanic or Latino population 15 years and over
Males 42.0% Never married47.4% Now married2.4% Separated0.0% Widowed8.2% DivorcedFemales 53.4% Never married33.7% Now married0.0% Separated1.0% Widowed11.9% DivorcedWomen who gave birth in the past 12 months Now married:
90.9% (100)Unmarried:
9.1% (10)
Women who did not give birth in the past 12 months Now married:
27.8% (739)Unmarried:
72.2% (1,921)
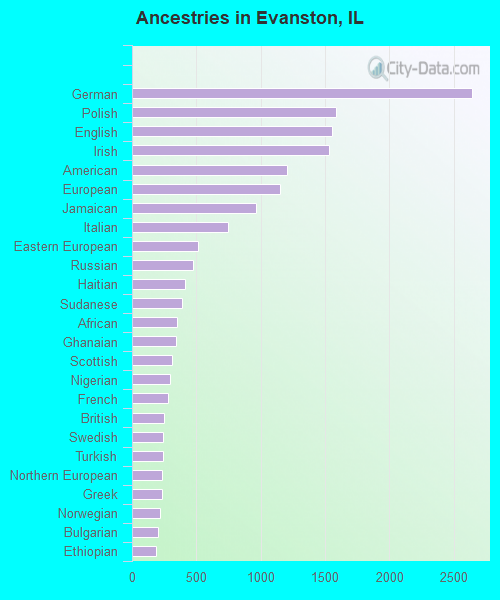
Ancestries in Evanston
2,643 7.0% German1,585 4.2% Polish1,553 4.1% English1,530 4.1% Irish1,208 3.2% American1,154 3.1% European965 2.6% Jamaican745 2.0% Italian513 1.4% Eastern European478 1.3% Russian409 1.1% Haitian386 1.0% Sudanese346 0.9% African339 0.9% Ghanaian311 0.8% Scottish292 0.8% Nigerian279 0.7% French247 0.7% British241 0.6% Swedish240 0.6% Turkish236 0.6% Northern European231 0.6% Greek219 0.6% Norwegian201 0.5% Bulgarian188 0.5% Ethiopian161 0.4% Dutch158 0.4% Ukrainian154 0.4% Romanian150 0.4% Scandinavian139 0.4% Sierra Leonean125 0.3% Czech116 0.3% Lithuanian112 0.3% Serbian89 0.2% Hungarian84 0.2% Iranian78 0.2% Croatian76 0.2% Austrian71 0.2% French Canadian61 0.2% Belgian58 0.2% Portuguese55 0.1% Yugoslavian52 0.1% Scotch-Irish47 0.1% Arab43 0.1% Latvian40 0.1% Armenian37 0.10% Albanian33 0.09% Lebanese29 0.08% Swiss28 0.07% Australian26 0.07% Danish24 0.06% Slavic23 0.06% Assyrian23 0.06% Bahamian22 0.06% Guyanese21 0.06% West Indian20 0.05% Brazilian19 0.05% Syrian16 0.04% Palestinian16 0.04% Belizean14 0.04% Israeli14 0.04% Luxembourger13 0.03% Kenyan13 0.03% Welsh11 0.03% Canadian11 0.03% Iraqi8 0.02% Egyptian7 0.02% Alsatian6 0.02% Finnish5 0.01% Czechoslovakian4 0.01% Slovak
Geographical mobility in Evanston Same house 1 year ago 37,740 81.0% White (Caucasian)9,807 76.8% Black or African American305 83.2% American Indian / Alaska Native3,630 68.0% Asian8 41.6% Native Hawaiian / Pacific Islander2,043 63.6% Other race5,670 77.9% Two or more races37,020 81.8% White alone, not Hispanic / Latino5,585 79.7% Hispanic or LatinoMoved within same county 4,077 8.8% White / Caucasian966 7.6% Black or African American919 17.2% Asian299 9.3% Other race1,157 15.9% Two or more races3,977 8.8% White alone, not Hispanic / Latino550 7.9% Hispanic or LatinoMoved within same state 632 1.4% White / Caucasian306 2.4% Black or African American29 7.9% American Indian / Alaska Native64 1.2% Asian11 61.6% Native Hawaiian / Pacific Islander3 0.0% Two or more races632 1.4% White alone, not Hispanic / Latino18 0.3% Hispanic or LatinoMoved from different state 3,786 8.1% White / Caucasian1,420 11.1% Black or African American44 11.9% American Indian / Alaska Native365 6.8% Asian424 13.2% Other race232 3.2% Two or more races3,367 7.4% White alone, not Hispanic / Latino543 7.8% Hispanic or LatinoMoved from abroad 356 0.8% White266 2.1% Black or African American358 6.7% Asian414 12.9% Other race216 3.0% Two or more races260 0.6% White alone, not Hispanic / Latino310 4.4% Hispanic or Latino
Children Nativity (place of birth) in Evanston
Children under 6 years - Living with two parents Both parents native 1,608 100.0% NativeBoth parents foreign-born 363 67.8% Native173 32.2% Foreign-bornOne native, one foreign-born parent 399 97.1% Native12 2.9% Foreign-bornChildren under 6 years - Living with one parent Native parent 1,117 100.0% NativeForeign-born parent 262 100.0% NativeChildren 6 to 17 years - Living with two parents Both parents native 4,004 99.0% Native40 1.0% Foreign-bornBoth parents foreign-born 534 74.6% Native182 25.4% Foreign-bornOne native, one foreign-born parent 1,249 98.8% Native16 1.2% Foreign-bornChildren 6 to 17 years - Living with one parent Native parent 2,572 100.0% NativeForeign-born parent 513 51.0% Native494 49.0% Foreign-born
Place of birth for residents in Evanston 4,789 Asia3,392 Americas3,238 Latin America2,599 Europe2,254 Eastern Asia1,633 Africa1,503 China1,470 Central America1,150 Eastern Europe1,048 Western Africa1,025 South Central Asia1,019 Caribbean932 South Eastern Asia748 South America725 Western Europe580 Northern Europe576 Western Asia249 Northern Africa171 Eastern Africa154 Northern America143 Southern Europe68 Oceania49 Middle Africa48 Southern Africa48 Australia and New Zealand Subregion1,428 China1,149 Mexico829 India668 Jamaica559 Korea555 Nigeria524 Philippines338 Ghana308 Germany306 Russia243 Vietnam234 Poland216 Brazil212 Sudan212 Turkey202 France190 Japan181 United Kingdom176 Israel168 England164 Haiti158 Chile157 Netherlands154 Canada150 Sierra Leone145 Ukraine137 Colombia127 Guatemala118 Ethiopia90 El Salvador88 Peru85 Yemen80 Ireland78 Grenada75 Venezuela67 Italy63 Scotland59 Pakistan58 Cuba57 Iran53 Bulgaria53 Spain53 Singapore52 Croatia46 Romania45 Iraq45 South Africa45 Costa Rica42 Thailand40 Taiwan39 Sweden39 Bhutan34 Czechoslovakia34 Hong Kong33 Belgium33 Cambodia33 Australia33 Belarus32 Norway30 Hungary29 Panama27 Nepal25 Bosnia and Herzegovina24 Bolivia23 Switzerland21 West Indies21 Greece20 Argentina19 North Macedonia (Macedonia)19 Honduras19 Fiji18 Dominican Republic18 Serbia17 Guyana14 New Zealand14 Cameroon13 Indonesia13 Moldova13 Malaysia12 Kenya12 Zimbabwe12 Denmark11 Lebanon10 Saudi Arabia10 Egypt9 Syria9 Latvia9 Morocco8 Bahamas8 Bangladesh8 Algeria8 Ecuador7 Nicaragua5 Burma (Myanmar)4 Eritrea3 Democratic Republic of Congo (Zaire)2 Jordan
Grandparents responsible for own grandchildren in Evanston
Grandparents (30 to 59 years) White / Caucasian 13 100.0% Not responsible for grandchildrenBlack or African American 46 22.0% Responsible for grandchildren164 78.0% Not responsible for grandchildrenAsian 31 100.0% Not responsible for grandchildrenOther race 31 100.0% Not responsible for grandchildrenTwo or more races 37 100.0% Not responsible for grandchildrenWhite alone, not Hispanic / Latino 7 100.0% Not responsible for grandchildrenHispanic or Latino 61 100.0% Not responsible for grandchildrenGrandparents (60 years and over) White / Caucasian 151 100.0% Not responsible for grandchildrenBlack or African American 184 69.7% Responsible for grandchildren80 30.3% Not responsible for grandchildrenAsian 10 8.3% Responsible for grandchildren114 91.7% Not responsible for grandchildrenOther race 8 27.1% Responsible for grandchildren22 72.9% Not responsible for grandchildrenTwo or more races 72 100.0% Not responsible for grandchildrenWhite alone, not Hispanic / Latino 195 100.0% Not responsible for grandchildrenHispanic or Latino 9 14.5% Responsible for grandchildren52 85.5% Not responsible for grandchildren