Races in Evergreen Park, Illinois (IL) Detailed Stats
Data:
Races - White alone (%)
Races - White alone (% change since 2000)
Races - Black alone (%)
Races - Black alone (% change since 2000)
Races - American Indian alone (%)
Races - American Indian alone (% change since 2000)
Races - Asian alone (%)
Races - Asian alone (% change since 2000)
Races - Hispanic (%)
Races - Hispanic (% change since 2000)
Races - Native Hawaiian and Other Pacific Islander alone (%)
Races - Native Hawaiian and Other Pacific Islander alone (% change since 2000)
Races - Two or more races(%)
Races - Two or more races(% change since 2000)
Races - Other race alone (%)
Races - Other race alone (% change since 2000)
Racial diversity
Place of birth - Born in state of residence (%)
Place of birth - Born in state of residence (%) - White
Place of birth - Born in state of residence (%) - Black or African American
Place of birth - Born in state of residence (%) - Asian
Place of birth - Born in state of residence (%) - Hispanic or Latino
Place of birth - Born in state of residence (%) - American Indian and Alaska Native
Place of birth - Born in state of residence (%) - Multirace
Place of birth - Born in state of residence (%) - Other Race
Place of birth - Born in other state (%)
Place of birth - Born in other state (%) - White
Place of birth - Born in other state (%) - Black or African American
Place of birth - Born in other state (%) - Asian
Place of birth - Born in other state (%) - Hispanic or Latino
Place of birth - Born in other state (%) - American Indian and Alaska Native
Place of birth - Born in other state (%) - Multirace
Place of birth - Born in other state (%) - Other Race
Place of birth - Native, outside of US (%)
Place of birth - Native, outside of US (%) - White
Place of birth - Native, outside of US (%) - Black or African American
Place of birth - Native, outside of US (%) - Asian
Place of birth - Native, outside of US (%) - Hispanic or Latino
Place of birth - Native, outside of US (%) - American Indian and Alaska Native
Place of birth - Native, outside of US (%) - Multirace
Place of birth - Native, outside of US (%) - Other Race
Place of birth - Foreign born (%)
Place of birth - Foreign born (%) - White
Place of birth - Foreign born (%) - Black or African American
Place of birth - Foreign born (%) - Asian
Place of birth - Foreign born (%) - Hispanic or Latino
Place of birth - Foreign born (%) - American Indian and Alaska Native
Place of birth - Foreign born (%) - Multirace
Place of birth - Foreign born (%) - Other Race
Residents speaking English at home (%)
Residents speaking English at home - Born in the United States (%)
Residents speaking English at home - Native, born elsewhere (%)
Residents speaking English at home - Foreign born (%)
Residents speaking Spanish at home (%)
Residents speaking Spanish at home - Born in the United States (%)
Residents speaking Spanish at home - Native, born elsewhere (%)
Residents speaking Spanish at home - Foreign born (%)
Residents speaking other language at home (%)
Residents speaking other language at home - Born in the United States (%)
Residents speaking other language at home - Native, born elsewhere (%)
Residents speaking other language at home - Foreign born (%)
Marital status - Never married (%)
Marital status - Now married (%)
Marital status - Separated (%)
Marital status - Widowed (%)
Marital status - Divorced (%)
Ancestries Reported - Arab (%)
Ancestries Reported - Czech (%)
Ancestries Reported - Danish (%)
Ancestries Reported - Dutch (%)
Ancestries Reported - English (%)
Ancestries Reported - French (%)
Ancestries Reported - French Canadian (%)
Ancestries Reported - German (%)
Ancestries Reported - Greek (%)
Ancestries Reported - Hungarian (%)
Ancestries Reported - Irish (%)
Ancestries Reported - Italian (%)
Ancestries Reported - Lithuanian (%)
Ancestries Reported - Norwegian (%)
Ancestries Reported - Polish (%)
Ancestries Reported - Portuguese (%)
Ancestries Reported - Russian (%)
Ancestries Reported - Scotch-Irish (%)
Ancestries Reported - Scottish (%)
Ancestries Reported - Slovak (%)
Ancestries Reported - Subsaharan African (%)
Ancestries Reported - Swedish (%)
Ancestries Reported - Swiss (%)
Ancestries Reported - Ukrainian (%)
Ancestries Reported - United States (%)
Ancestries Reported - Welsh (%)
Ancestries Reported - West Indian (%)
Ancestries Reported - Other (%)
Geographical mobility - Same house 1 year ago (%)
Geographical mobility - Same house 1 year ago (%) - White
Geographical mobility - Same house 1 year ago (%) - Black or African American
Geographical mobility - Same house 1 year ago (%) - Asian
Geographical mobility - Same house 1 year ago (%) - Hispanic or Latino
Geographical mobility - Same house 1 year ago (%) - American Indian and Alaska Native
Geographical mobility - Same house 1 year ago (%) - Multirace
Geographical mobility - Same house 1 year ago (%) - Other Race
Geographical mobility - Moved within same county (%)
Geographical mobility - Moved within same county (%) - White
Geographical mobility - Moved within same county (%) - Black or African American
Geographical mobility - Moved within same county (%) - Asian
Geographical mobility - Moved within same county (%) - Hispanic or Latino
Geographical mobility - Moved within same county (%) - American Indian and Alaska Native
Geographical mobility - Moved within same county (%) - Multirace
Geographical mobility - Moved within same county (%) - Other Race
Geographical mobility - Moved from different county within same state (%)
Geographical mobility - Moved from different county within same state (%) - White
Geographical mobility - Moved from different county within same state (%) - Black or African American
Geographical mobility - Moved from different county within same state (%) - Asian
Geographical mobility - Moved from different county within same state (%) - Hispanic or Latino
Geographical mobility - Moved from different county within same state (%) - American Indian and Alaska Native
Geographical mobility - Moved from different county within same state (%) - Multirace
Geographical mobility - Moved from different county within same state (%) - Other Race
Geographical mobility - Moved from different state (%)
Geographical mobility - Moved from different state (%) - White
Geographical mobility - Moved from different state (%) - Black or African American
Geographical mobility - Moved from different state (%) - Asian
Geographical mobility - Moved from different state (%) - Hispanic or Latino
Geographical mobility - Moved from different state (%) - American Indian and Alaska Native
Geographical mobility - Moved from different state (%) - Multirace
Geographical mobility - Moved from different state (%) - Other Race
Geographical mobility - Moved from abroad (%)
Geographical mobility - Moved from abroad (%) - White
Geographical mobility - Moved from abroad (%) - Black or African American
Geographical mobility - Moved from abroad (%) - Asian
Geographical mobility - Moved from abroad (%) - Hispanic or Latino
Geographical mobility - Moved from abroad (%) - American Indian and Alaska Native
Geographical mobility - Moved from abroad (%) - Multirace
Geographical mobility - Moved from abroad (%) - Other Race
Place of birth for the foreign-born population - Ireland (%)
Place of birth for the foreign-born population - Denmark (%)
Place of birth for the foreign-born population - Norway (%)
Place of birth for the foreign-born population - Sweden (%)
Place of birth for the foreign-born population - United Kingdom (%)
Place of birth for the foreign-born population - England (%)
Place of birth for the foreign-born population - Scotland (%)
Place of birth for the foreign-born population - Other Northern Europe (%)
Place of birth for the foreign-born population - Austria (%)
Place of birth for the foreign-born population - Belgium (%)
Place of birth for the foreign-born population - France (%)
Place of birth for the foreign-born population - Germany (%)
Place of birth for the foreign-born population - Netherlands (%)
Place of birth for the foreign-born population - Switzerland (%)
Place of birth for the foreign-born population - Other Western Europe (%)
Place of birth for the foreign-born population - Greece (%)
Place of birth for the foreign-born population - Italy (%)
Place of birth for the foreign-born population - Portugal (%)
Place of birth for the foreign-born population - Spain (%)
Place of birth for the foreign-born population - Other Southern Europe (%)
Place of birth for the foreign-born population - Albania (%)
Place of birth for the foreign-born population - Belarus (%)
Place of birth for the foreign-born population - Bosnia and Herzegovina (%)
Place of birth for the foreign-born population - Bulgaria (%)
Place of birth for the foreign-born population - Croatia (%)
Place of birth for the foreign-born population - Czechoslovakia (%)
Place of birth for the foreign-born population - Hungary (%)
Place of birth for the foreign-born population - Latvia (%)
Place of birth for the foreign-born population - Lithuania (%)
Place of birth for the foreign-born population - North Macedonia (Macedonia) (%)
Place of birth for the foreign-born population - Moldova (%)
Place of birth for the foreign-born population - Poland (%)
Place of birth for the foreign-born population - Romania (%)
Place of birth for the foreign-born population - Russia (%)
Place of birth for the foreign-born population - Serbia (%)
Place of birth for the foreign-born population - Ukraine (%)
Place of birth for the foreign-born population - Other Eastern Europe (%)
Place of birth for the foreign-born population - China (%)
Place of birth for the foreign-born population - Hong Kong (%)
Place of birth for the foreign-born population - Taiwan (%)
Place of birth for the foreign-born population - Japan (%)
Place of birth for the foreign-born population - Korea (%)
Place of birth for the foreign-born population - Other Eastern Asia (%)
Place of birth for the foreign-born population - Afghanistan (%)
Place of birth for the foreign-born population - Bangladesh (%)
Place of birth for the foreign-born population - India (%)
Place of birth for the foreign-born population - Iran (%)
Place of birth for the foreign-born population - Kazakhstan (%)
Place of birth for the foreign-born population - Nepal (%)
Place of birth for the foreign-born population - Pakistan (%)
Place of birth for the foreign-born population - Sri Lanka (%)
Place of birth for the foreign-born population - Uzbekistan (%)
Place of birth for the foreign-born population - Other South Central Asia (%)
Place of birth for the foreign-born population - Burma (%)
Place of birth for the foreign-born population - Cambodia (%)
Place of birth for the foreign-born population - Indonesia (%)
Place of birth for the foreign-born population - Laos (%)
Place of birth for the foreign-born population - Malaysia (%)
Place of birth for the foreign-born population - Philippines (%)
Place of birth for the foreign-born population - Singapore (%)
Place of birth for the foreign-born population - Thailand (%)
Place of birth for the foreign-born population - Vietnam (%)
Place of birth for the foreign-born population - Other South Eastern Asia (%)
Place of birth for the foreign-born population - Armenia (%)
Place of birth for the foreign-born population - Iraq (%)
Place of birth for the foreign-born population - Israel (%)
Place of birth for the foreign-born population - Jordan (%)
Place of birth for the foreign-born population - Kuwait (%)
Place of birth for the foreign-born population - Lebanon (%)
Place of birth for the foreign-born population - Saudi Arabia (%)
Place of birth for the foreign-born population - Syria (%)
Place of birth for the foreign-born population - Turkey (%)
Place of birth for the foreign-born population - Yemen (%)
Place of birth for the foreign-born population - Other Western Asia (%)
Place of birth for the foreign-born population - Eritrea (%)
Place of birth for the foreign-born population - Ethiopia (%)
Place of birth for the foreign-born population - Kenya (%)
Place of birth for the foreign-born population - Somalia (%)
Place of birth for the foreign-born population - Uganda (%)
Place of birth for the foreign-born population - Zimbabwe (%)
Place of birth for the foreign-born population - Other Eastern Africa (%)
Place of birth for the foreign-born population - Cameroon (%)
Place of birth for the foreign-born population - Congo (%)
Place of birth for the foreign-born population - Democratic Republic of Congo (Zaire) (%)
Place of birth for the foreign-born population - Other Middle Africa (%)
Place of birth for the foreign-born population - Egypt (%)
Place of birth for the foreign-born population - Morocco (%)
Place of birth for the foreign-born population - Sudan (%)
Place of birth for the foreign-born population - Other Northern Africa (%)
Place of birth for the foreign-born population - South Africa (%)
Place of birth for the foreign-born population - Other Southern Africa (%)
Place of birth for the foreign-born population - Cabo Verde (%)
Place of birth for the foreign-born population - Ghana (%)
Place of birth for the foreign-born population - Liberia (%)
Place of birth for the foreign-born population - Nigeria (%)
Place of birth for the foreign-born population - Senegal (%)
Place of birth for the foreign-born population - Sierra Leone (%)
Place of birth for the foreign-born population - Other Western Africa (%)
Place of birth for the foreign-born population - Australia (%)
Place of birth for the foreign-born population - New Zealand (%)
Place of birth for the foreign-born population - Fiji (%)
Place of birth for the foreign-born population - Micronesia (%)
Place of birth for the foreign-born population - Bahamas (%)
Place of birth for the foreign-born population - Barbados (%)
Place of birth for the foreign-born population - Cuba (%)
Place of birth for the foreign-born population - Dominica (%)
Place of birth for the foreign-born population - Dominican Republic (%)
Place of birth for the foreign-born population - Grenada (%)
Place of birth for the foreign-born population - Haiti (%)
Place of birth for the foreign-born population - Jamaica (%)
Place of birth for the foreign-born population - St. Vincent and the Grenadines (%)
Place of birth for the foreign-born population - Trinidad and Tobago (%)
Place of birth for the foreign-born population - West Indies (%)
Place of birth for the foreign-born population - Other Caribbean (%)
Place of birth for the foreign-born population - Belize (%)
Place of birth for the foreign-born population - Costa Rica (%)
Place of birth for the foreign-born population - El Salvador (%)
Place of birth for the foreign-born population - Guatemala (%)
Place of birth for the foreign-born population - Honduras (%)
Place of birth for the foreign-born population - Mexico (%)
Place of birth for the foreign-born population - Nicaragua (%)
Place of birth for the foreign-born population - Panama (%)
Place of birth for the foreign-born population - Other Central America (%)
Place of birth for the foreign-born population - Argentina (%)
Place of birth for the foreign-born population - Bolivia (%)
Place of birth for the foreign-born population - Brazil (%)
Place of birth for the foreign-born population - Chile (%)
Place of birth for the foreign-born population - Colombia (%)
Place of birth for the foreign-born population - Ecuador (%)
Place of birth for the foreign-born population - Guyana (%)
Place of birth for the foreign-born population - Peru (%)
Place of birth for the foreign-born population - Uruguay (%)
Place of birth for the foreign-born population - Venezuela (%)
Place of birth for the foreign-born population - Other South America (%)
Place of birth for the foreign-born population - Canada (%)
Place of birth for the foreign-born population - Other Northern America (%)
Place of birth for the foreign-born population - Other (%)
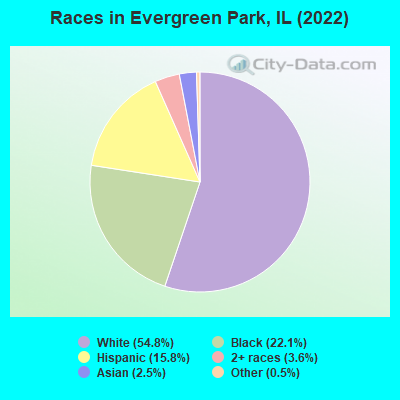
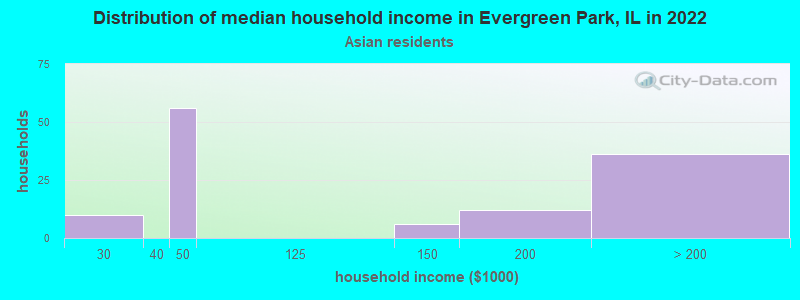
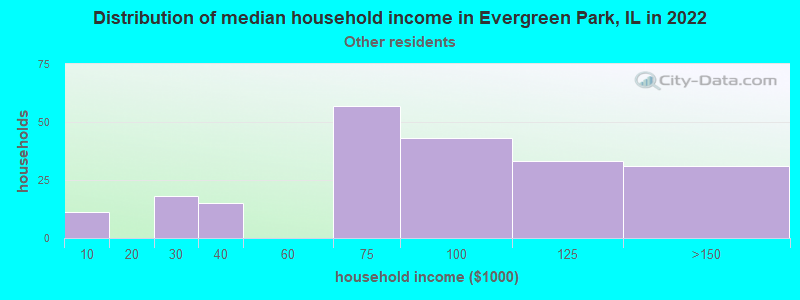
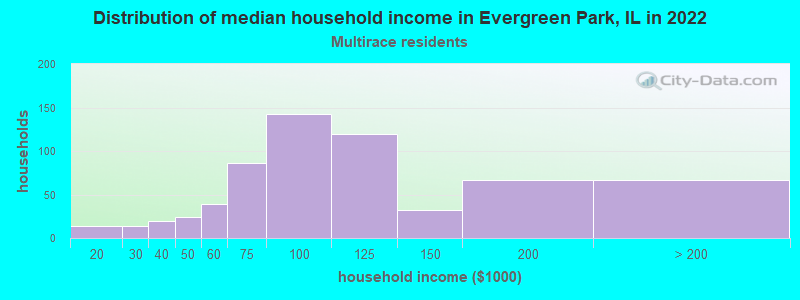
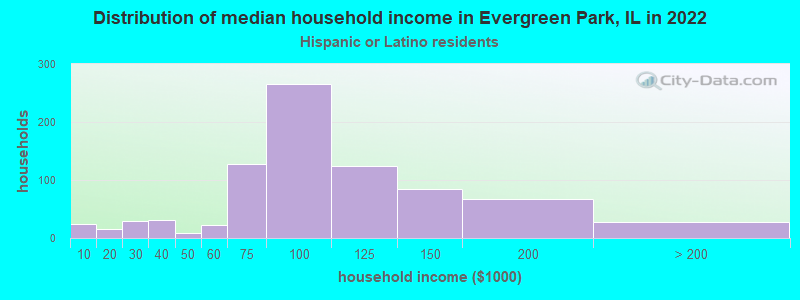
According to 2022 data, the most numerous races in Evergreen Park, IL are White alone (10,579 residents), Hispanic (3,048 residents), and Black alone (4,257 residents). 84.5% of Evergreen Park residents speak English at home. 9.4% of Evergreen Park, IL residents are foreign-born (4.7% born in Latin America, 2.0% born in Europe, 1.9% born in Asia), which is 48.2% less than the foreign-born rate of 14.0% across the entire state of Illinois.
Race distribution in Evergreen Park
2000 2022
8,424,140 67.8% White alone 1,856,152 14.9% Black alone 1,530,262 12.3% Hispanic 419,916 3.4% Asian alone 153,996 1.2% Two or more races 13,479 0.1% Other race alone 18,232 0.1% American Indian alone 3,116 0.03% Native Hawaiian and Other
7,356,301 58.5% White alone 2,299,726 18.3% Hispanic 1,660,423 13.2% Black alone 747,296 5.9% Asian alone 458,599 3.6% Two or more races 45,386 0.4% Other race alone 10,405 0.08% American Indian alone 3,896 0.03% Native Hawaiian and Other
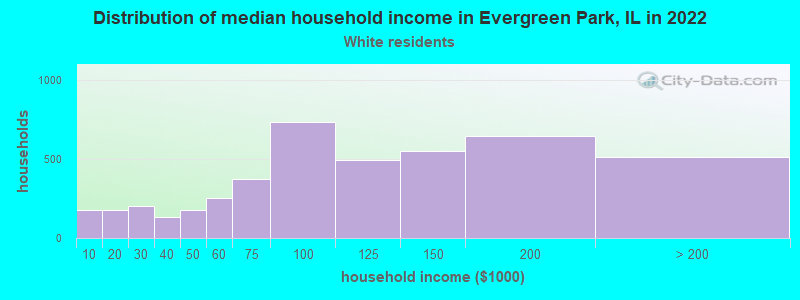
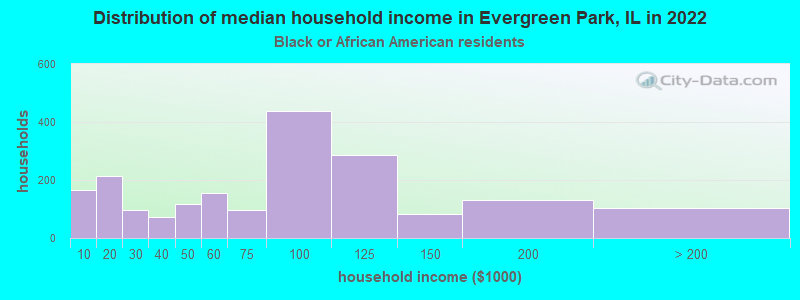
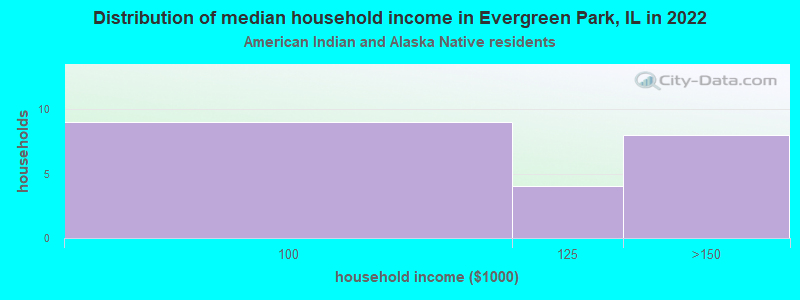
Income and house value in Evergreen Park Median household income in 2022 $99,170 White non-Hispanic householders$75,457 Black householders$116,676 American Indian and Alaska Native householders$67,367 Some other race householders$91,279 Two or more races householders$95,816 Hispanic or Latino race householdersMedian 2022 house value $250,211 White Non-Hispanic householders$252,253 Black or African American householders $255,223 Asian householders$184,503 Some other race householders$278,425 Two or more races householders$218,842 Hispanic or Latino householders
Median age by race in Evergreen Park
43.8 Median age for White residents43.5 44.1 42.4 Median age for Black or African American residents42.6 43.1 49.8 Median age for American Indian / Alaska Native residents31.3 52.3 43.1 Median age for Asian residents31.1 48.5 -687,999,999.3 Median age for Native Hawaiian / Pacific Islander residents-918,721,460.3 -610,229,276.3 26.5 Median age for Other race residents33.5 25.8 21.6 Median age for Two or more races residents18.7 33.1 45.7 Median age for White alone residents44.3 46.1 28.0 Median age for Hispanic or Latino residents29.2 26.5
Owner/renter occupied households by race in Evergreen Park
House owners and renters - White residents 4,063 91.6% Owner occupied373 8.4% Renter occupiedHouse owners and renters - Black or African American residents 1,249 63.7% Owner occupied712 36.3% Renter occupiedHouse owners and renters - American Indian / Alaska Native residents 19 100.0% Owner occupiedHouse owners and renters - Asian residents 67 52.8% Owner occupied60 47.2% Renter occupiedHouse owners and renters - Other race residents 219 100.0% Owner occupiedHouse owners and renters - Two or more races residents 541 84.1% Owner occupied103 15.9% Renter occupiedHouse owners and renters - White alone residents 4,012 91.6% Owner occupied366 8.4% Renter occupiedHouse owners and renters - Hispanic or Latino residents 771 93.4% Owner occupied55 6.6% Renter occupied
Language usage in Evergreen Park
English speakers - Total 84.5% of residents of Evergreen Park speak English at home.
10.2% of residents speak Spanish at home 1,309 72.6% Speak English very well494 27.4% Speak English less than very well4.6% of residents speak other language at home 557 68.2% Speak English very well260 31.8% Speak English less than very well
English speakers - Born in the United States 97.4% of residents of Evergreen Park speak English at home.
1.3% of residents speak Spanish at home 8 40.0% Speak English very well12 60.0% Speak English less than very well1.0% of residents speak other language at home 16 100.0% Speak English very well
English speakers - Native, born elsewhere 96.3% of residents of Evergreen Park speak English at home.
3.7% of residents speak Spanish at home 3 100.0% Speak English very well2.4% of residents speak other language at home 2 100.0% Speak English less than very well
English speakers - Foreign-born 15.6% of residents of Evergreen Park speak English at home.
46.6% of residents speak Spanish at home 423 51.3% Speak English very well402 48.7% Speak English less than very well37.2% of residents speak other language at home 399 60.5% Speak English very well260 39.5% Speak English less than very well
White (Caucasian) - Speak only English Native:
99.0% (9,348)Foreign-born:
29.1% (149)
White (Caucasian) - Speak another language Native:
4.0% (376)Foreign-born:
72.0% (368)
Black or African American - Speak only English Native:
99.5% (3,881)Foreign-born:
20.2% (21)
Black or African American - Speak another language Native:
0.4% (17)Foreign-born:
75.7% (78)
American Indian / Alaska Native - Speak another language Native:
44.6% (22)Foreign-born:
100.0% (5)
Asian - Speak only English Native:
100.0% (87)Foreign-born:
4.4% (17)
Other race - Speak only English Native:
67.3% (313)Foreign-born:
14.1% (35)
Other race - Speak another language Native:
36.4% (169)Foreign-born:
84.7% (213)
Two or more races - Speak only English Native:
56.5% (776)Foreign-born:
10.6% (59)
Two or more races - Speak another language Native:
43.2% (594)Foreign-born:
89.4% (497)
White alone - Speak only English Native:
98.4% (9,237)Foreign-born:
43.4% (164)
White alone - Speak another language Native:
0.9% (85)Foreign-born:
53.4% (202)
Hispanic or Latino - Speak only English Native:
46.9% (845)Foreign-born:
3.6% (31)
Hispanic or Latino - Speak another language Native:
54.0% (975)Foreign-born:
96.5% (828)
Foreign-born residents in Evergreen Park 1,822 residents are foreign born (4.7% Latin America , 2.0% Europe , 1.9% Asia ).
This city:
9.4%Illinois:
14.1%
Marital status for residents in Evergreen Park Marital status - White (Caucasian) population 15 years and over
Males 30.8% Never married60.2% Now married1.6% Separated1.8% Widowed5.7% DivorcedFemales 26.1% Never married53.3% Now married1.4% Separated9.6% Widowed9.5% DivorcedWomen who gave birth in the past 12 months Now married:
82.9% (263)Unmarried:
17.1% (54)
Women who did not give birth in the past 12 months Now married:
44.4% (879)Unmarried:
55.6% (1,102)
Marital status - Black or African American population 15 years and over
Males 47.0% Never married40.5% Now married2.2% Separated2.1% Widowed8.2% DivorcedFemales 45.7% Never married29.2% Now married4.5% Separated3.8% Widowed16.9% DivorcedWomen who gave birth in the past 12 months Now married:
38.9% (42)Unmarried:
61.1% (65)
Women who did not give birth in the past 12 months Now married:
28.6% (301)Unmarried:
71.4% (754)
Marital status - American Indian / Alaska Native population 15 years and over
Males 60.0% Never married40.0% Now married0.0% Separated0.0% Widowed0.0% DivorcedFemales 0.0% Never married60.0% Now married0.0% Separated0.0% Widowed40.0% DivorcedWomen who did not give birth in the past 12 months Now married:
100.0% (4)Unmarried:
0.0% (0)
Marital status - Asian population 15 years and over
Males 64.0% Never married36.0% Now married0.0% Separated0.0% Widowed0.0% DivorcedFemales 0.0% Never married81.8% Now married18.2% Separated0.0% Widowed0.0% DivorcedWomen who did not give birth in the past 12 months Now married:
100.0% (115)Unmarried:
0.0% (0)
Marital status - Other race population 15 years and over
Males 26.8% Never married61.0% Now married0.0% Separated0.0% Widowed12.1% DivorcedFemales 22.8% Never married44.2% Now married0.0% Separated0.0% Widowed33.0% DivorcedWomen who did not give birth in the past 12 months Now married:
36.9% (82)Unmarried:
63.1% (141)
Marital status - Two or more races population 15 years and over
Males 40.7% Never married51.7% Now married2.0% Separated0.0% Widowed5.6% DivorcedFemales 17.0% Never married57.2% Now married10.6% Separated4.1% Widowed11.1% DivorcedWomen who gave birth in the past 12 months Now married:
100.0% (74)Unmarried:
0.0% (0)
Women who did not give birth in the past 12 months Now married:
63.8% (176)Unmarried:
36.2% (100)
Marital status - White alone, not Hispanic / Latino population 15 years and over
Males 31.5% Never married60.5% Now married1.0% Separated1.7% Widowed5.3% DivorcedFemales 24.1% Never married54.0% Now married1.6% Separated10.0% Widowed10.2% DivorcedWomen who gave birth in the past 12 months Now married:
96.3% (245)Unmarried:
3.7% (10)
Women who did not give birth in the past 12 months Now married:
44.6% (861)Unmarried:
55.4% (1,068)
Marital status - Hispanic or Latino population 15 years and over
Males 29.9% Never married54.0% Now married5.0% Separated0.8% Widowed10.3% DivorcedFemales 31.7% Never married50.0% Now married3.1% Separated4.3% Widowed10.9% DivorcedWomen who gave birth in the past 12 months Now married:
62.5% (90)Unmarried:
37.5% (54)
Women who did not give birth in the past 12 months Now married:
48.8% (322)Unmarried:
51.2% (338)
Ancestries in Evergreen Park
2,043 21.3% Irish472 4.9% German445 4.6% Polish364 3.8% Italian152 1.6% American143 1.5% Lithuanian120 1.3% European111 1.2% Ukrainian100 1.0% Dutch82 0.9% English61 0.6% African52 0.5% Greek40 0.4% Swedish36 0.4% Scandinavian29 0.3% Serbian27 0.3% Croatian25 0.3% Norwegian23 0.2% Belizean14 0.1% Nigerian13 0.1% Ghanaian12 0.1% Hungarian10 0.1% Czech9 0.09% Slovak8 0.08% Eastern European7 0.07% Jordanian5 0.05% Canadian4 0.04% British3 0.03% Scotch-Irish
Children Nativity (place of birth) in Evergreen Park
Children under 6 years - Living with two parents Both parents native 910 100.0% NativeBoth parents foreign-born 88 100.0% NativeOne native, one foreign-born parent 218 100.0% NativeChildren under 6 years - Living with one parent Native parent 543 100.0% NativeForeign-born parent 15 13.7% Native98 86.3% Foreign-bornChildren 6 to 17 years - Living with two parents Both parents native 1,295 99.1% Native12 0.9% Foreign-bornBoth parents foreign-born 119 70.5% Native50 29.5% Foreign-bornOne native, one foreign-born parent 238 100.0% NativeChildren 6 to 17 years - Living with one parent Native parent 622 100.0% NativeForeign-born parent 171 54.5% Native143 45.5% Foreign-born
Grandparents responsible for own grandchildren in Evergreen Park
Grandparents (30 to 59 years) White / Caucasian 24 19.2% Responsible for grandchildren102 80.8% Not responsible for grandchildrenBlack or African American 12 100.0% Not responsible for grandchildrenTwo or more races 38 53.6% Responsible for grandchildren33 46.4% Not responsible for grandchildrenWhite alone, not Hispanic / Latino 32 28.4% Responsible for grandchildren81 71.6% Not responsible for grandchildrenHispanic or Latino 33 48.8% Responsible for grandchildren35 51.2% Not responsible for grandchildrenGrandparents (60 years and over) White / Caucasian 11 55.0% Responsible for grandchildren9 45.0% Not responsible for grandchildrenBlack or African American 43 76.0% Responsible for grandchildren13 24.0% Not responsible for grandchildrenTwo or more races 19 100.0% Not responsible for grandchildrenWhite alone, not Hispanic / Latino 13 66.0% Responsible for grandchildren7 34.0% Not responsible for grandchildrenHispanic or Latino 16 100.0% Not responsible for grandchildren