Races in Fairchild AFB, Washington (WA) Detailed Stats
Ancestries, Foreign-born residents, place of birth
Settings
X


Recent posts about races in Fairchild AFB, Washington on our local forum with over 2,400,000 registered users:
 | Semi rural near Spokane (5 replies) |
| Spokane is superfund site central (40 replies) |
| Diversity in Spokane...does it exist? (6 replies) |
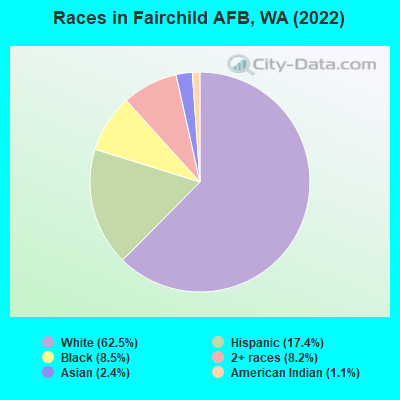
According to 2022 data, the most numerous races in Fairchild AFB, WA are White alone (2,031 residents), Hispanic (564 residents), and Asian alone (77 residents). 86.9% of Fairchild AFB residents speak English at home. 6.0% of Fairchild AFB, WA residents are foreign-born (2.6% born in Africa, 1.3% born in Latin America, 1.0% born in Asia, 0.9% born in Europe), which is 148.6% less than the foreign-born rate of 15.0% across the entire state of Washington.
Race distribution in Fairchild AFB
2000
2022

- 3,27175.1%White alone
- 3718.5%Hispanic
- 3327.6%Black alone
- 1764.0%Two or more races
- 1513.5%Asian alone
- 210.5%Other race alone
- 190.4%American Indian alone
- 160.4%Native Hawaiian and Other
Pacific Islander alone

-
- 2,03162.5%White alone
- 56417.4%Hispanic
- 2768.5%Black alone
- 2658.2%Two or more races
- 772.4%Asian alone
- 361.1%American Indian alone
2000
2022
-
- 4,652,49078.9%White alone
- 441,5097.5%Hispanic
- 319,4015.4%Asian alone
- 184,6313.1%Black alone
- 175,9263.0%Two or more races
- 85,3961.4%American Indian alone
- 22,7790.4%Native Hawaiian and Other
Pacific Islander alone - 11,9890.2%Other race alone

-
- 4,941,45663.5%White alone
- 1,093,31314.0%Hispanic
- 755,8329.7%Asian alone
- 523,4486.7%Two or more races
- 299,5373.8%Black alone
- 69,0240.9%American Indian alone
- 52,2310.7%Native Hawaiian and Other
Pacific Islander alone - 50,9450.7%Other race alone

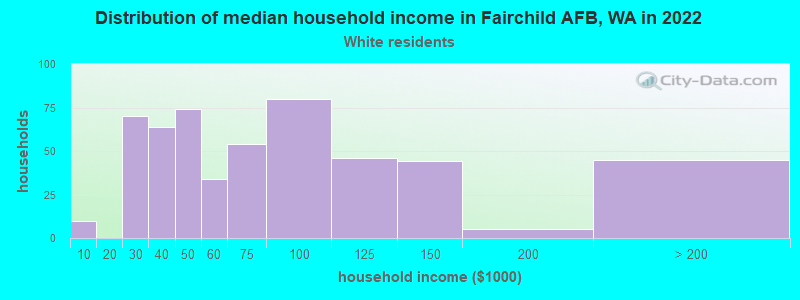
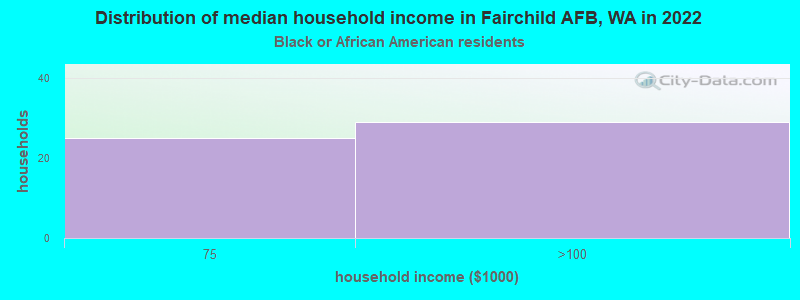
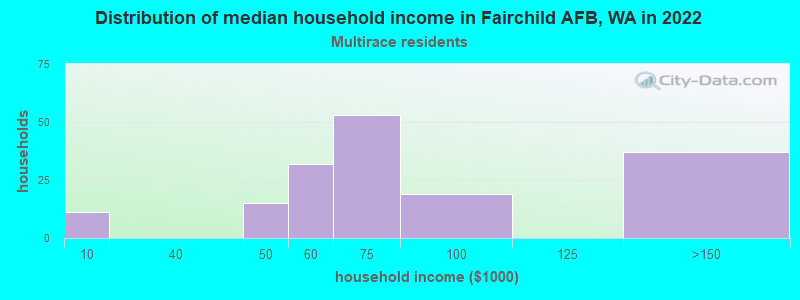
Income and house value in Fairchild AFB
- Median household income in 2022
- $59,413White non-Hispanic householders
- $69,618Black householders
- $91,611American Indian and Alaska Native householders
- $62,597Two or more races householders
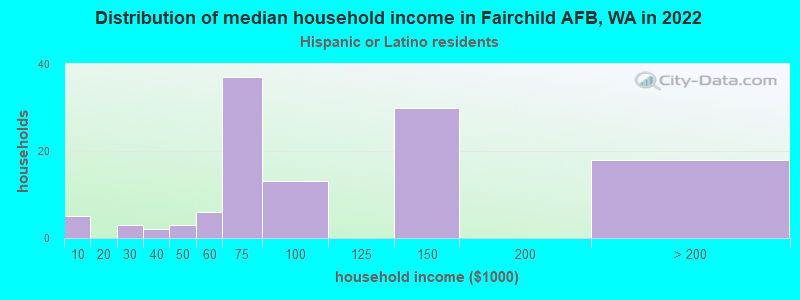
- $83,936Hispanic or Latino race householders
- Median 2022 house value
- $-835,343,786White Non-Hispanic householders
Household income for White non-Hispanic householders
Household income for Black householders
Household income for American Indian and Alaska Native householders

Household income for Asian householders

Household income for Some other race householders

Household income for Two or more races householders
Household income for Hispanic or Latino race householders
Median age by race in Fairchild AFB
- 24.3Median age for White residents
- 23.2Males
- 25.6Females
- 25.8Median age for Black or African American residents
- 28.3Males
- 25.0Females
- 19.0Median age for American Indian / Alaska Native residents
- 30.5Males
- 16.3Females
- 22.7Median age for Asian residents
- 23.2Males
- -644,329,896.3Females
- -635,265,699.8Median age for Native Hawaiian / Pacific Islander residents
- -518,787,878.3Males
- -609,195,401.7Females
- 23.1Median age for Other race residents
- 23.1Males
- -679,867,986.1Females
- 21.2Median age for Two or more races residents
- 24.6Males
- 9.0Females
- 24.1Median age for White alone residents
- 23.0Males
- 25.5Females
- 23.1Median age for Hispanic or Latino residents
- 24.8Males
- 17.3Females
Owner/renter occupied households by race in Fairchild AFB
- House owners and renters - White residents
- 51.0%Owner occupied
- 52399.0%Renter occupied
- House owners and renters - Black or African American residents
- 56100.0%Renter occupied
- House owners and renters - American Indian / Alaska Native residents
- 10100.0%Renter occupied
- House owners and renters - Asian residents
- 11100.0%Renter occupied
- House owners and renters - Other race residents
- 12100.0%Renter occupied
- House owners and renters - Two or more races residents
- 178100.0%Renter occupied
- House owners and renters - White alone residents
- 51.0%Owner occupied
- 48999.0%Renter occupied
- House owners and renters - Hispanic or Latino residents
- 126100.0%Renter occupied
Language usage in Fairchild AFB
- English speakers - Total
- 86.9% of residents of Fairchild AFB speak English at home.
- 5.8% of residents speak Spanish at home
- 11372.9%Speak English very well
- 4227.1%Speak English less than very well
- 6.5% of residents speak other language at home
- 16092.5%Speak English very well
- 137.5%Speak English less than very well
- English speakers - Born in the United States
- 95.8% of residents of Fairchild AFB speak English at home.
- 2.4% of residents speak Spanish at home
- 4489.8%Speak English very well
- 510.2%Speak English less than very well
- 0.9% of residents speak other language at home
- 18100.0%Speak English very well
- English speakers - Native, born elsewhere
- 39.2% of residents of Fairchild AFB speak English at home.
- 70.9% of residents speak Spanish at home
- 7167.6%Speak English very well
- 3432.4%Speak English less than very well
- 6.8% of residents speak other language at home
- 660.0%Speak English very well
- 440.0%Speak English less than very well
- English speakers - Foreign-born
- 8.9% of residents of Fairchild AFB speak English at home.
- 15.0% of residents speak Spanish at home
- 27100.0%Speak English very well
- 67.2% of residents speak other language at home
- 11292.6%Speak English very well
- 97.4%Speak English less than very well
White (Caucasian) - Speak only English
| Native: | 97.8% (1,725) |
| Foreign-born: | 12.8% (7) |
White (Caucasian) - Speak another language
| Native: | 2.2% (39) |
| Foreign-born: | 83.3% (45) |
Asian - Speak another language
| Native: | 11.9% (6) |
| Foreign-born: | 97.6% (25) |
Other race - Speak another language
| Native: | 32.7% (27) |
| Foreign-born: | 81.4% (3) |
Two or more races - Speak only English
| Native: | 72.3% (307) |
| Foreign-born: | 58.5% (8) |
Two or more races - Speak another language
| Native: | 27.6% (117) |
| Foreign-born: | 45.6% (6) |
White alone - Speak only English
| Native: | 99.0% (1,692) |
| Foreign-born: | 23.6% (7) |
White alone - Speak another language
| Native: | 1.0% (17) |
| Foreign-born: | 74.5% (22) |
Hispanic or Latino - Speak another language
| Native: | 31.6% (127) |
| Foreign-born: | 92.1% (23) |
Foreign-born residents in Fairchild AFB
196 residents are foreign born (2.6% Africa, 1.3% Latin America, 1.0% Asia, 0.9% Europe).
| This city: | 6.0% |
| Washington: | 14.9% |


Marital status for residents in Fairchild AFB
Marital status - White (Caucasian) population 15 years and over
- Males
- 43.3%Never married
- 55.7%Now married
- 0.0%Separated
- 0.0%Widowed
- 1.0%Divorced
- Females
- 10.0%Never married
- 89.1%Now married
- 0.0%Separated
- 0.0%Widowed
- 0.9%Divorced
Women who gave birth in the past 12 months
| Now married: | 100.0% (95) |
| Unmarried: | 0.0% (0) |
Women who did not give birth in the past 12 months
| Now married: | 86.5% (405) |
| Unmarried: | 13.5% (63) |
Marital status - Black or African American population 15 years and over
- Males
- 61.9%Never married
- 38.1%Now married
- 0.0%Separated
- 0.0%Widowed
- 0.0%Divorced
- Females
- 36.5%Never married
- 63.5%Now married
- 0.0%Separated
- 0.0%Widowed
- 0.0%Divorced
Women who did not give birth in the past 12 months
| Now married: | 63.5% (47) |
| Unmarried: | 36.5% (27) |
Marital status - American Indian / Alaska Native population 15 years and over
- Males
- 0.0%Never married
- 100.0%Now married
- 0.0%Separated
- 0.0%Widowed
- 0.0%Divorced
- Females
- 29.2%Never married
- 70.8%Now married
- 0.0%Separated
- 0.0%Widowed
- 0.0%Divorced
Women who did not give birth in the past 12 months
| Now married: | 70.8% (20) |
| Unmarried: | 29.2% (8) |
Marital status - Asian population 15 years and over
- Males
- 90.9%Never married
- 9.1%Now married
- 0.0%Separated
- 0.0%Widowed
- 0.0%Divorced
- Females
- 69.2%Never married
- 30.8%Now married
- 0.0%Separated
- 0.0%Widowed
- 0.0%Divorced
Women who did not give birth in the past 12 months
| Now married: | 30.8% (4) |
| Unmarried: | 69.2% (9) |
Marital status - Other race population 15 years and over
- Males
- 75.5%Never married
- 24.5%Now married
- 0.0%Separated
- 0.0%Widowed
- 0.0%Divorced
- Females
- 0.0%Never married
- 100.0%Now married
- 0.0%Separated
- 0.0%Widowed
- 0.0%Divorced
Women who did not give birth in the past 12 months
| Now married: | 100.0% (18) |
| Unmarried: | 0.0% (0) |
Marital status - Two or more races population 15 years and over
- Males
- 19.3%Never married
- 80.7%Now married
- 0.0%Separated
- 0.0%Widowed
- 0.0%Divorced
- Females
- 13.7%Never married
- 86.3%Now married
- 0.0%Separated
- 0.0%Widowed
- 0.0%Divorced
Women who gave birth in the past 12 months
| Now married: | 100.0% (41) |
| Unmarried: | 0.0% (0) |
Women who did not give birth in the past 12 months
| Now married: | 81.4% (92) |
| Unmarried: | 18.6% (21) |
Marital status - White alone, not Hispanic / Latino population 15 years and over
- Males
- 45.6%Never married
- 53.6%Now married
- 0.0%Separated
- 0.0%Widowed
- 0.8%Divorced
- Females
- 10.5%Never married
- 88.6%Now married
- 0.0%Separated
- 0.0%Widowed
- 0.9%Divorced
Women who gave birth in the past 12 months
| Now married: | 100.0% (95) |
| Unmarried: | 0.0% (0) |
Women who did not give birth in the past 12 months
| Now married: | 85.7% (379) |
| Unmarried: | 14.3% (63) |
Marital status - Hispanic or Latino population 15 years and over
- Males
- 25.3%Never married
- 73.3%Now married
- 0.0%Separated
- 0.0%Widowed
- 1.4%Divorced
- Females
- 17.9%Never married
- 82.1%Now married
- 0.0%Separated
- 0.0%Widowed
- 0.0%Divorced
Women who gave birth in the past 12 months
| Now married: | 100.0% (5) |
| Unmarried: | 0.0% (0) |
Women who did not give birth in the past 12 months
| Now married: | 81.3% (95) |
| Unmarried: | 18.7% (22) |
Ancestries in Fairchild AFB

- 11010.1%Italian
- 867.9%English
- 847.7%American
- 827.5%German
- 797.3%Irish
- 514.7%Liberian
- 343.1%Somali
- 161.5%Scotch-Irish
- 151.4%Scottish
- 121.1%British
- 111.0%African
- 60.6%Palestinian
- 40.4%European
- 30.3%Dutch
- 30.3%Polish

Geographical mobility in Fairchild AFB

- Same house 1 year ago
- 1,23560.9%White (Caucasian)
- 18165.4%Black or African American
- 1830.1%American Indian / Alaska Native
- 7286.7%Asian
- 4150.3%Other race
- 52984.0%Two or more races
- 1,17460.6%White alone, not Hispanic / Latino
- 44179.8%Hispanic or Latino

-
- Moved within same county
- 1246.1%White / Caucasian
- 83.1%Black or African American
- 61.0%Two or more races
- 1256.4%White alone, not Hispanic / Latino
- 20.4%Hispanic or Latino

-
- Moved within same state
- 52.0%Black or African American
- 69.8%American Indian / Alaska Native
- 56.1%Other race
- 61.0%Two or more races
- 132.3%Hispanic or Latino

-
- Moved from different state
- 53626.4%White / Caucasian
- 14452.3%Black or African American
- 4473.8%American Indian / Alaska Native
- 911.2%Asian
- 3239.1%Other race
- 14623.1%Two or more races
- 54728.2%White alone, not Hispanic / Latino
- 13324.0%Hispanic or Latino

-
- Moved from abroad
- 402.0%White
- 1830.4%American Indian / Alaska Native
- 91.4%Two or more races
- 331.7%White alone, not Hispanic / Latino
- 193.4%Hispanic or Latino

Children Nativity (place of birth) in Fairchild AFB
Place of birth for residents in Fairchild AFB
![Place of birth for the foreign-born population - Regions]()
- 87Africa
- 51Western Africa
- 44Americas
- 44Latin America
- 35Eastern Africa
- 34Asia
- 30Europe
- 23Central America
- 20South America
- 18South Eastern Asia
- 17Eastern Europe
- 15Eastern Asia
- 15China
- 12Northern Europe

![Place of birth for the foreign-born population - Countries]()
- 35Somalia
- 32Liberia
- 23Mexico
- 18Philippines
- 17Ukraine
- 15China
- 12United Kingdom
- 8Brazil
- 7Ecuador
- 5Chile

Zip codes: 99011.