Races in Fairfield, Ohio (OH) Detailed Stats
Data:
Races - White alone (%)
Races - White alone (% change since 2000)
Races - Black alone (%)
Races - Black alone (% change since 2000)
Races - American Indian alone (%)
Races - American Indian alone (% change since 2000)
Races - Asian alone (%)
Races - Asian alone (% change since 2000)
Races - Hispanic (%)
Races - Hispanic (% change since 2000)
Races - Native Hawaiian and Other Pacific Islander alone (%)
Races - Native Hawaiian and Other Pacific Islander alone (% change since 2000)
Races - Two or more races(%)
Races - Two or more races(% change since 2000)
Races - Other race alone (%)
Races - Other race alone (% change since 2000)
Racial diversity
Place of birth - Born in state of residence (%)
Place of birth - Born in state of residence (%) - White
Place of birth - Born in state of residence (%) - Black or African American
Place of birth - Born in state of residence (%) - Asian
Place of birth - Born in state of residence (%) - Hispanic or Latino
Place of birth - Born in state of residence (%) - American Indian and Alaska Native
Place of birth - Born in state of residence (%) - Multirace
Place of birth - Born in state of residence (%) - Other Race
Place of birth - Born in other state (%)
Place of birth - Born in other state (%) - White
Place of birth - Born in other state (%) - Black or African American
Place of birth - Born in other state (%) - Asian
Place of birth - Born in other state (%) - Hispanic or Latino
Place of birth - Born in other state (%) - American Indian and Alaska Native
Place of birth - Born in other state (%) - Multirace
Place of birth - Born in other state (%) - Other Race
Place of birth - Native, outside of US (%)
Place of birth - Native, outside of US (%) - White
Place of birth - Native, outside of US (%) - Black or African American
Place of birth - Native, outside of US (%) - Asian
Place of birth - Native, outside of US (%) - Hispanic or Latino
Place of birth - Native, outside of US (%) - American Indian and Alaska Native
Place of birth - Native, outside of US (%) - Multirace
Place of birth - Native, outside of US (%) - Other Race
Place of birth - Foreign born (%)
Place of birth - Foreign born (%) - White
Place of birth - Foreign born (%) - Black or African American
Place of birth - Foreign born (%) - Asian
Place of birth - Foreign born (%) - Hispanic or Latino
Place of birth - Foreign born (%) - American Indian and Alaska Native
Place of birth - Foreign born (%) - Multirace
Place of birth - Foreign born (%) - Other Race
Residents speaking English at home (%)
Residents speaking English at home - Born in the United States (%)
Residents speaking English at home - Native, born elsewhere (%)
Residents speaking English at home - Foreign born (%)
Residents speaking Spanish at home (%)
Residents speaking Spanish at home - Born in the United States (%)
Residents speaking Spanish at home - Native, born elsewhere (%)
Residents speaking Spanish at home - Foreign born (%)
Residents speaking other language at home (%)
Residents speaking other language at home - Born in the United States (%)
Residents speaking other language at home - Native, born elsewhere (%)
Residents speaking other language at home - Foreign born (%)
Marital status - Never married (%)
Marital status - Now married (%)
Marital status - Separated (%)
Marital status - Widowed (%)
Marital status - Divorced (%)
Ancestries Reported - Arab (%)
Ancestries Reported - Czech (%)
Ancestries Reported - Danish (%)
Ancestries Reported - Dutch (%)
Ancestries Reported - English (%)
Ancestries Reported - French (%)
Ancestries Reported - French Canadian (%)
Ancestries Reported - German (%)
Ancestries Reported - Greek (%)
Ancestries Reported - Hungarian (%)
Ancestries Reported - Irish (%)
Ancestries Reported - Italian (%)
Ancestries Reported - Lithuanian (%)
Ancestries Reported - Norwegian (%)
Ancestries Reported - Polish (%)
Ancestries Reported - Portuguese (%)
Ancestries Reported - Russian (%)
Ancestries Reported - Scotch-Irish (%)
Ancestries Reported - Scottish (%)
Ancestries Reported - Slovak (%)
Ancestries Reported - Subsaharan African (%)
Ancestries Reported - Swedish (%)
Ancestries Reported - Swiss (%)
Ancestries Reported - Ukrainian (%)
Ancestries Reported - United States (%)
Ancestries Reported - Welsh (%)
Ancestries Reported - West Indian (%)
Ancestries Reported - Other (%)
Geographical mobility - Same house 1 year ago (%)
Geographical mobility - Same house 1 year ago (%) - White
Geographical mobility - Same house 1 year ago (%) - Black or African American
Geographical mobility - Same house 1 year ago (%) - Asian
Geographical mobility - Same house 1 year ago (%) - Hispanic or Latino
Geographical mobility - Same house 1 year ago (%) - American Indian and Alaska Native
Geographical mobility - Same house 1 year ago (%) - Multirace
Geographical mobility - Same house 1 year ago (%) - Other Race
Geographical mobility - Moved within same county (%)
Geographical mobility - Moved within same county (%) - White
Geographical mobility - Moved within same county (%) - Black or African American
Geographical mobility - Moved within same county (%) - Asian
Geographical mobility - Moved within same county (%) - Hispanic or Latino
Geographical mobility - Moved within same county (%) - American Indian and Alaska Native
Geographical mobility - Moved within same county (%) - Multirace
Geographical mobility - Moved within same county (%) - Other Race
Geographical mobility - Moved from different county within same state (%)
Geographical mobility - Moved from different county within same state (%) - White
Geographical mobility - Moved from different county within same state (%) - Black or African American
Geographical mobility - Moved from different county within same state (%) - Asian
Geographical mobility - Moved from different county within same state (%) - Hispanic or Latino
Geographical mobility - Moved from different county within same state (%) - American Indian and Alaska Native
Geographical mobility - Moved from different county within same state (%) - Multirace
Geographical mobility - Moved from different county within same state (%) - Other Race
Geographical mobility - Moved from different state (%)
Geographical mobility - Moved from different state (%) - White
Geographical mobility - Moved from different state (%) - Black or African American
Geographical mobility - Moved from different state (%) - Asian
Geographical mobility - Moved from different state (%) - Hispanic or Latino
Geographical mobility - Moved from different state (%) - American Indian and Alaska Native
Geographical mobility - Moved from different state (%) - Multirace
Geographical mobility - Moved from different state (%) - Other Race
Geographical mobility - Moved from abroad (%)
Geographical mobility - Moved from abroad (%) - White
Geographical mobility - Moved from abroad (%) - Black or African American
Geographical mobility - Moved from abroad (%) - Asian
Geographical mobility - Moved from abroad (%) - Hispanic or Latino
Geographical mobility - Moved from abroad (%) - American Indian and Alaska Native
Geographical mobility - Moved from abroad (%) - Multirace
Geographical mobility - Moved from abroad (%) - Other Race
Place of birth for the foreign-born population - Ireland (%)
Place of birth for the foreign-born population - Denmark (%)
Place of birth for the foreign-born population - Norway (%)
Place of birth for the foreign-born population - Sweden (%)
Place of birth for the foreign-born population - United Kingdom (%)
Place of birth for the foreign-born population - England (%)
Place of birth for the foreign-born population - Scotland (%)
Place of birth for the foreign-born population - Other Northern Europe (%)
Place of birth for the foreign-born population - Austria (%)
Place of birth for the foreign-born population - Belgium (%)
Place of birth for the foreign-born population - France (%)
Place of birth for the foreign-born population - Germany (%)
Place of birth for the foreign-born population - Netherlands (%)
Place of birth for the foreign-born population - Switzerland (%)
Place of birth for the foreign-born population - Other Western Europe (%)
Place of birth for the foreign-born population - Greece (%)
Place of birth for the foreign-born population - Italy (%)
Place of birth for the foreign-born population - Portugal (%)
Place of birth for the foreign-born population - Spain (%)
Place of birth for the foreign-born population - Other Southern Europe (%)
Place of birth for the foreign-born population - Albania (%)
Place of birth for the foreign-born population - Belarus (%)
Place of birth for the foreign-born population - Bosnia and Herzegovina (%)
Place of birth for the foreign-born population - Bulgaria (%)
Place of birth for the foreign-born population - Croatia (%)
Place of birth for the foreign-born population - Czechoslovakia (%)
Place of birth for the foreign-born population - Hungary (%)
Place of birth for the foreign-born population - Latvia (%)
Place of birth for the foreign-born population - Lithuania (%)
Place of birth for the foreign-born population - North Macedonia (Macedonia) (%)
Place of birth for the foreign-born population - Moldova (%)
Place of birth for the foreign-born population - Poland (%)
Place of birth for the foreign-born population - Romania (%)
Place of birth for the foreign-born population - Russia (%)
Place of birth for the foreign-born population - Serbia (%)
Place of birth for the foreign-born population - Ukraine (%)
Place of birth for the foreign-born population - Other Eastern Europe (%)
Place of birth for the foreign-born population - China (%)
Place of birth for the foreign-born population - Hong Kong (%)
Place of birth for the foreign-born population - Taiwan (%)
Place of birth for the foreign-born population - Japan (%)
Place of birth for the foreign-born population - Korea (%)
Place of birth for the foreign-born population - Other Eastern Asia (%)
Place of birth for the foreign-born population - Afghanistan (%)
Place of birth for the foreign-born population - Bangladesh (%)
Place of birth for the foreign-born population - India (%)
Place of birth for the foreign-born population - Iran (%)
Place of birth for the foreign-born population - Kazakhstan (%)
Place of birth for the foreign-born population - Nepal (%)
Place of birth for the foreign-born population - Pakistan (%)
Place of birth for the foreign-born population - Sri Lanka (%)
Place of birth for the foreign-born population - Uzbekistan (%)
Place of birth for the foreign-born population - Other South Central Asia (%)
Place of birth for the foreign-born population - Burma (%)
Place of birth for the foreign-born population - Cambodia (%)
Place of birth for the foreign-born population - Indonesia (%)
Place of birth for the foreign-born population - Laos (%)
Place of birth for the foreign-born population - Malaysia (%)
Place of birth for the foreign-born population - Philippines (%)
Place of birth for the foreign-born population - Singapore (%)
Place of birth for the foreign-born population - Thailand (%)
Place of birth for the foreign-born population - Vietnam (%)
Place of birth for the foreign-born population - Other South Eastern Asia (%)
Place of birth for the foreign-born population - Armenia (%)
Place of birth for the foreign-born population - Iraq (%)
Place of birth for the foreign-born population - Israel (%)
Place of birth for the foreign-born population - Jordan (%)
Place of birth for the foreign-born population - Kuwait (%)
Place of birth for the foreign-born population - Lebanon (%)
Place of birth for the foreign-born population - Saudi Arabia (%)
Place of birth for the foreign-born population - Syria (%)
Place of birth for the foreign-born population - Turkey (%)
Place of birth for the foreign-born population - Yemen (%)
Place of birth for the foreign-born population - Other Western Asia (%)
Place of birth for the foreign-born population - Eritrea (%)
Place of birth for the foreign-born population - Ethiopia (%)
Place of birth for the foreign-born population - Kenya (%)
Place of birth for the foreign-born population - Somalia (%)
Place of birth for the foreign-born population - Uganda (%)
Place of birth for the foreign-born population - Zimbabwe (%)
Place of birth for the foreign-born population - Other Eastern Africa (%)
Place of birth for the foreign-born population - Cameroon (%)
Place of birth for the foreign-born population - Congo (%)
Place of birth for the foreign-born population - Democratic Republic of Congo (Zaire) (%)
Place of birth for the foreign-born population - Other Middle Africa (%)
Place of birth for the foreign-born population - Egypt (%)
Place of birth for the foreign-born population - Morocco (%)
Place of birth for the foreign-born population - Sudan (%)
Place of birth for the foreign-born population - Other Northern Africa (%)
Place of birth for the foreign-born population - South Africa (%)
Place of birth for the foreign-born population - Other Southern Africa (%)
Place of birth for the foreign-born population - Cabo Verde (%)
Place of birth for the foreign-born population - Ghana (%)
Place of birth for the foreign-born population - Liberia (%)
Place of birth for the foreign-born population - Nigeria (%)
Place of birth for the foreign-born population - Senegal (%)
Place of birth for the foreign-born population - Sierra Leone (%)
Place of birth for the foreign-born population - Other Western Africa (%)
Place of birth for the foreign-born population - Australia (%)
Place of birth for the foreign-born population - New Zealand (%)
Place of birth for the foreign-born population - Fiji (%)
Place of birth for the foreign-born population - Micronesia (%)
Place of birth for the foreign-born population - Bahamas (%)
Place of birth for the foreign-born population - Barbados (%)
Place of birth for the foreign-born population - Cuba (%)
Place of birth for the foreign-born population - Dominica (%)
Place of birth for the foreign-born population - Dominican Republic (%)
Place of birth for the foreign-born population - Grenada (%)
Place of birth for the foreign-born population - Haiti (%)
Place of birth for the foreign-born population - Jamaica (%)
Place of birth for the foreign-born population - St. Vincent and the Grenadines (%)
Place of birth for the foreign-born population - Trinidad and Tobago (%)
Place of birth for the foreign-born population - West Indies (%)
Place of birth for the foreign-born population - Other Caribbean (%)
Place of birth for the foreign-born population - Belize (%)
Place of birth for the foreign-born population - Costa Rica (%)
Place of birth for the foreign-born population - El Salvador (%)
Place of birth for the foreign-born population - Guatemala (%)
Place of birth for the foreign-born population - Honduras (%)
Place of birth for the foreign-born population - Mexico (%)
Place of birth for the foreign-born population - Nicaragua (%)
Place of birth for the foreign-born population - Panama (%)
Place of birth for the foreign-born population - Other Central America (%)
Place of birth for the foreign-born population - Argentina (%)
Place of birth for the foreign-born population - Bolivia (%)
Place of birth for the foreign-born population - Brazil (%)
Place of birth for the foreign-born population - Chile (%)
Place of birth for the foreign-born population - Colombia (%)
Place of birth for the foreign-born population - Ecuador (%)
Place of birth for the foreign-born population - Guyana (%)
Place of birth for the foreign-born population - Peru (%)
Place of birth for the foreign-born population - Uruguay (%)
Place of birth for the foreign-born population - Venezuela (%)
Place of birth for the foreign-born population - Other South America (%)
Place of birth for the foreign-born population - Canada (%)
Place of birth for the foreign-born population - Other Northern America (%)
Place of birth for the foreign-born population - Other (%)
Latest news about races in Fairfield, OH collected exclusively by city-data.com from local newspapers, TV, and radio stations
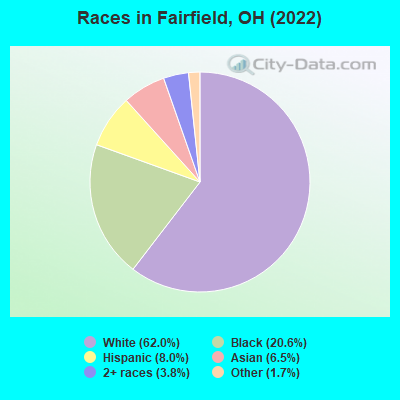
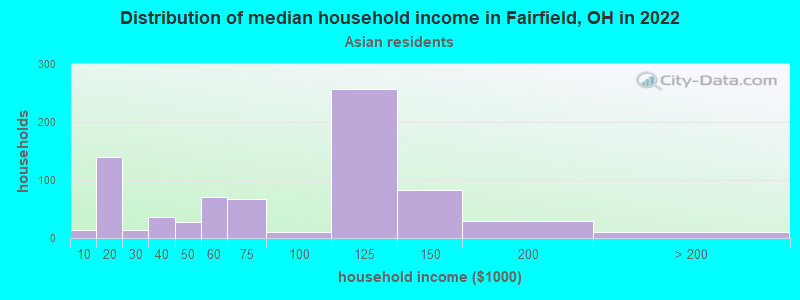
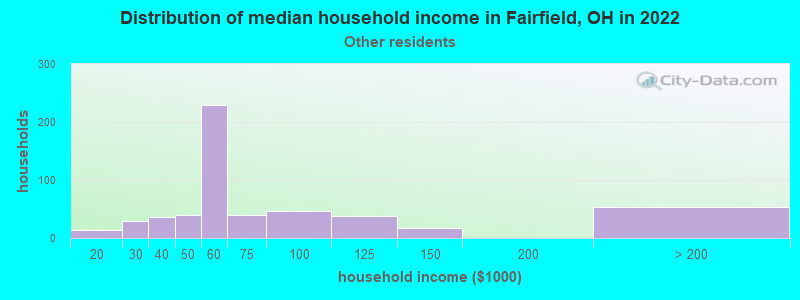
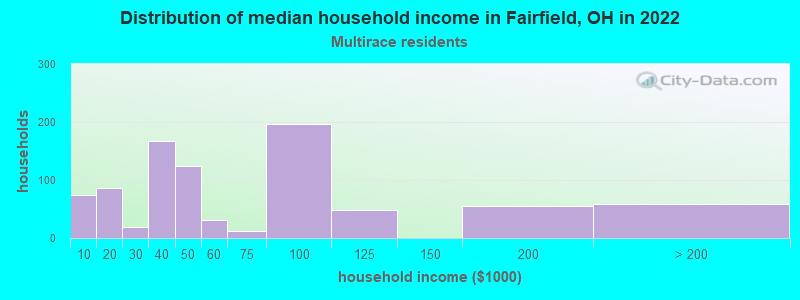
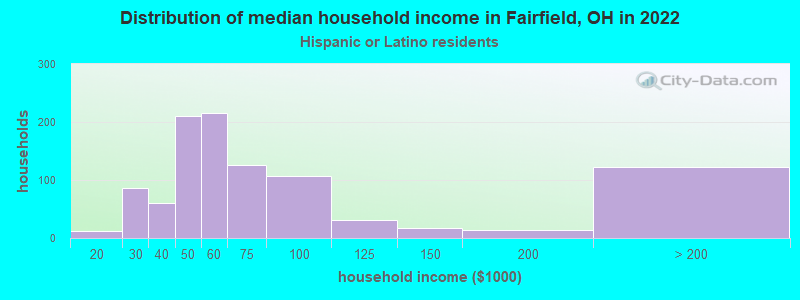
According to 2022 data, the most numerous races in Fairfield, OH are White alone (27,670 residents), Black alone (9,208 residents), and Two or more races (1,706 residents). 83.1% of Fairfield residents speak English at home. 12.3% of Fairfield, OH residents are foreign-born (4.5% born in Africa, 3.7% born in Asia, 3.1% born in Latin America), which is 67.5% greater than the foreign-born rate of 4.0% across the entire state of Ohio.
Race distribution in Fairfield
2000 2022
9,538,111 84.0% White alone 1,290,662 11.4% Black alone 217,123 1.9% Hispanic 137,770 1.2% Two or more races 131,670 1.2% Asian alone 21,985 0.2% American Indian alone 13,483 0.1% Other race alone 2,336 0.02% Native Hawaiian and Other
8,948,793 76.1% White alone 1,401,403 11.9% Black alone 529,291 4.5% Two or more races 517,232 4.4% Hispanic 293,387 2.5% Asian alone 52,805 0.4% Other race alone 9,785 0.08% American Indian alone 3,362 0.03% Native Hawaiian and Other
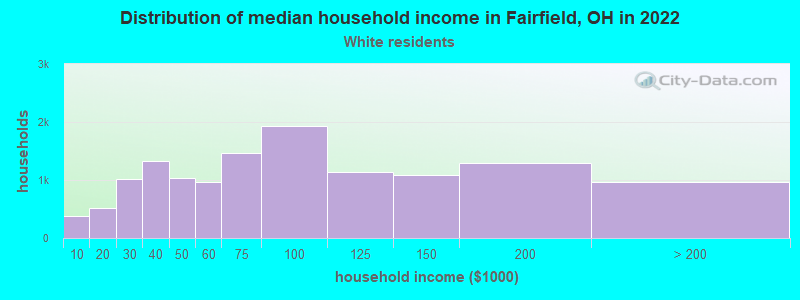
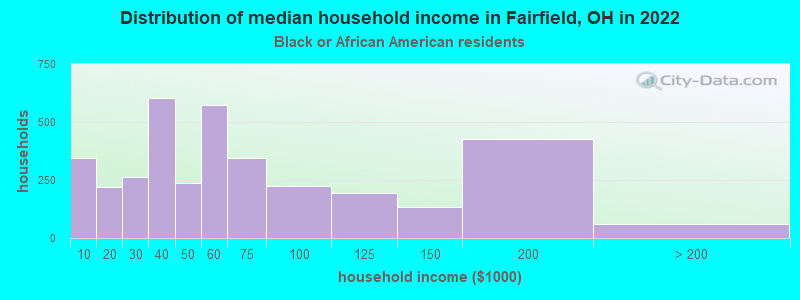
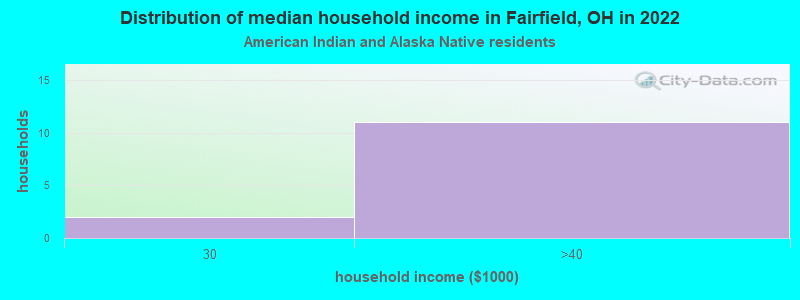
Income and house value in Fairfield Median household income in 2022 $73,197 White non-Hispanic householders$52,130 Black householders$118,706 Asian householders$65,104 Some other race householders$42,214 Two or more races householders$58,499 Hispanic or Latino race householdersMedian 2022 house value $243,095 White Non-Hispanic householders$228,533 Black or African American householders$162,128 American Indian or Alaska Native householders $314,354 Asian householders$266,978 Some other race householders$213,971 Two or more races householders$242,707 Hispanic or Latino householders
Median age by race in Fairfield
47.0 Median age for White residents45.8 49.4 29.0 Median age for Black or African American residents31.5 27.0 27.8 Median age for American Indian / Alaska Native residents-685,185,184.5 -658,163,264.6 27.2 Median age for Asian residents16.9 32.5 -749,999,999.2 Median age for Native Hawaiian / Pacific Islander residents-750,242,953.6 -805,394,989.6 22.6 Median age for Other race residents26.2 20.1 18.4 Median age for Two or more races residents21.1 17.3 48.3 Median age for White alone residents46.5 50.4 25.8 Median age for Hispanic or Latino residents28.3 22.9
Owner/renter occupied households by race in Fairfield
House owners and renters - White residents 9,578 72.6% Owner occupied3,622 27.4% Renter occupiedHouse owners and renters - Black or African American residents 1,103 30.1% Owner occupied2,559 69.9% Renter occupiedHouse owners and renters - American Indian / Alaska Native residents 8 84.7% Owner occupied1 15.3% Renter occupiedHouse owners and renters - Asian residents 604 85.5% Owner occupied102 14.5% Renter occupiedHouse owners and renters - Other race residents 332 53.4% Owner occupied290 46.6% Renter occupiedHouse owners and renters - Two or more races residents 383 43.7% Owner occupied495 56.3% Renter occupiedHouse owners and renters - White alone residents 9,528 73.1% Owner occupied3,511 26.9% Renter occupiedHouse owners and renters - Hispanic or Latino residents 476 48.0% Owner occupied516 52.0% Renter occupied
Language usage in Fairfield
English speakers - Total 83.1% of residents of Fairfield speak English at home.
6.4% of residents speak Spanish at home 1,424 53.4% Speak English very well1,244 46.6% Speak English less than very well11.4% of residents speak other language at home 1,555 32.6% Speak English very well3,212 67.4% Speak English less than very well
English speakers - Born in the United States 89.4% of residents of Fairfield speak English at home.
4.4% of residents speak Spanish at home 355 100.0% Speak English very well6.9% of residents speak other language at home 205 37.1% Speak English very well348 62.9% Speak English less than very well
English speakers - Native, born elsewhere 61.7% of residents of Fairfield speak English at home.
11.9% of residents speak Spanish at home 62 100.0% Speak English very well12.3% of residents speak other language at home 44 68.8% Speak English very well20 31.2% Speak English less than very well
English speakers - Foreign-born 11.6% of residents of Fairfield speak English at home.
26.0% of residents speak Spanish at home 330 22.6% Speak English very well1,129 77.4% Speak English less than very well62.9% of residents speak other language at home 902 25.6% Speak English very well2,624 74.4% Speak English less than very well
White (Caucasian) - Speak only English Native:
98.1% (26,485)Foreign-born:
32.4% (79)
White (Caucasian) - Speak another language Native:
1.6% (424)Foreign-born:
100.0% (244)
Black or African American - Speak only English Native:
94.4% (5,816)Foreign-born:
13.7% (264)
Black or African American - Speak another language Native:
6.2% (381)Foreign-born:
87.3% (1,679)
American Indian / Alaska Native - Speak only English Native:
45.0% (8)Foreign-born:
100.0% (13)
Asian - Speak only English Native:
25.0% (259)Foreign-born:
1.3% (21)
Asian - Speak another language Native:
79.8% (826)Foreign-born:
100.0% (1,618)
Other race - Speak only English Native:
21.3% (208)Foreign-born:
4.1% (76)
Other race - Speak another language Native:
82.5% (808)Foreign-born:
86.0% (1,585)
Two or more races - Speak only English Native:
90.7% (1,699)Foreign-born:
19.7% (116)
Two or more races - Speak another language Native:
8.1% (152)Foreign-born:
82.7% (486)
White alone - Speak only English Native:
99.2% (26,179)Foreign-born:
41.0% (83)
White alone - Speak another language Native:
0.8% (220)Foreign-born:
51.8% (105)
Hispanic or Latino - Speak only English Native:
38.8% (535)Foreign-born:
16.0% (292)
Hispanic or Latino - Speak another language Native:
63.7% (879)Foreign-born:
83.8% (1,524)
Foreign-born residents in Fairfield 5,492 residents are foreign born (4.5% Africa , 3.7% Asia , 3.1% Latin America ).
Marital status for residents in Fairfield Marital status - White (Caucasian) population 15 years and over
Males 29.9% Never married53.2% Now married0.9% Separated4.0% Widowed11.9% DivorcedFemales 22.8% Never married48.7% Now married0.9% Separated13.3% Widowed14.2% DivorcedWomen who gave birth in the past 12 months Now married:
80.2% (203)Unmarried:
19.8% (50)
Women who did not give birth in the past 12 months Now married:
43.8% (2,455)Unmarried:
56.2% (3,147)
Marital status - Black or African American population 15 years and over
Males 43.7% Never married44.8% Now married0.3% Separated1.5% Widowed9.6% DivorcedFemales 40.9% Never married38.8% Now married2.2% Separated4.5% Widowed13.6% DivorcedWomen who gave birth in the past 12 months Now married:
89.0% (371)Unmarried:
11.0% (46)
Women who did not give birth in the past 12 months Now married:
29.7% (825)Unmarried:
70.3% (1,951)
Marital status - American Indian / Alaska Native population 15 years and over
Males 0.0% Never married100.0% Now married0.0% Separated0.0% Widowed0.0% DivorcedFemales 12.5% Never married0.0% Now married87.5% Separated0.0% Widowed0.0% DivorcedWomen who did not give birth in the past 12 months Now married:
0.0% (0)Unmarried:
100.0% (1)
Marital status - Asian population 15 years and over
Males 37.2% Never married58.7% Now married0.9% Separated0.0% Widowed3.2% DivorcedFemales 21.8% Never married64.1% Now married0.0% Separated5.2% Widowed8.9% DivorcedWomen who gave birth in the past 12 months Now married:
100.0% (81)Unmarried:
0.0% (0)
Women who did not give birth in the past 12 months Now married:
59.9% (445)Unmarried:
40.1% (298)
Marital status - Other race population 15 years and over
Males 49.1% Never married47.3% Now married3.6% Separated0.0% Widowed0.0% DivorcedFemales 34.1% Never married33.2% Now married0.2% Separated2.1% Widowed30.4% DivorcedWomen who gave birth in the past 12 months Now married:
66.7% (80)Unmarried:
33.3% (40)
Women who did not give birth in the past 12 months Now married:
30.6% (191)Unmarried:
69.4% (434)
Marital status - Two or more races population 15 years and over
Males 54.0% Never married30.6% Now married0.0% Separated0.0% Widowed15.4% DivorcedFemales 45.9% Never married27.6% Now married1.6% Separated6.8% Widowed18.2% DivorcedWomen who gave birth in the past 12 months Now married:
0.0% (0)Unmarried:
100.0% (20)
Women who did not give birth in the past 12 months Now married:
33.1% (164)Unmarried:
66.9% (331)
Marital status - White alone, not Hispanic / Latino population 15 years and over
Males 30.4% Never married52.4% Now married0.9% Separated4.1% Widowed12.2% DivorcedFemales 21.4% Never married49.4% Now married1.0% Separated13.6% Widowed14.7% DivorcedWomen who gave birth in the past 12 months Now married:
75.8% (161)Unmarried:
24.2% (52)
Women who did not give birth in the past 12 months Now married:
45.3% (2,434)Unmarried:
54.7% (2,943)
Marital status - Hispanic or Latino population 15 years and over
Males 33.9% Never married63.7% Now married2.4% Separated0.0% Widowed0.0% DivorcedFemales 44.0% Never married37.9% Now married1.2% Separated7.5% Widowed9.4% DivorcedWomen who gave birth in the past 12 months Now married:
69.4% (105)Unmarried:
30.6% (46)
Women who did not give birth in the past 12 months Now married:
37.2% (338)Unmarried:
62.8% (570)
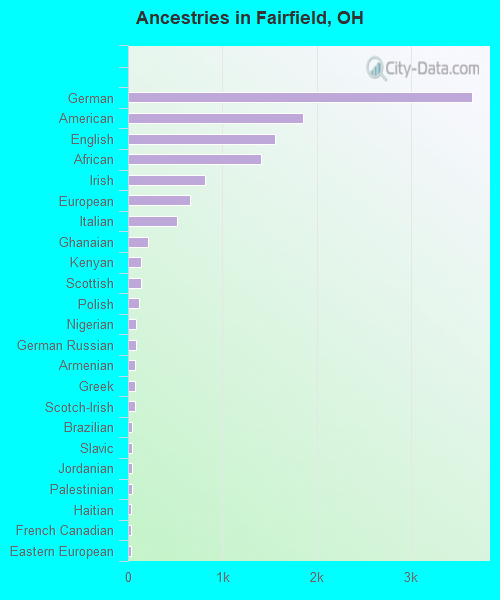
Ancestries in Fairfield
3,645 13.4% German1,856 6.8% American1,563 5.7% English1,415 5.2% African817 3.0% Irish662 2.4% European524 1.9% Italian212 0.8% Ghanaian142 0.5% Kenyan141 0.5% Scottish118 0.4% Polish90 0.3% Nigerian81 0.3% German Russian75 0.3% Armenian73 0.3% Greek71 0.3% Scotch-Irish47 0.2% Brazilian45 0.2% Slavic39 0.1% Jordanian39 0.1% Palestinian37 0.1% Haitian36 0.1% French Canadian35 0.1% Eastern European32 0.1% Danish31 0.1% Welsh28 0.1% Russian27 0.10% Czech27 0.10% British26 0.10% Dutch24 0.09% Portuguese20 0.07% French20 0.07% Austrian20 0.07% Yugoslavian19 0.07% Slovak16 0.06% Swiss12 0.04% Trinidadian and Tobagonian10 0.04% Ukrainian9 0.03% Norwegian9 0.03% Hungarian8 0.03% Arab6 0.02% Lithuanian
Geographical mobility in Fairfield Same house 1 year ago 26,308 93.9% White (Caucasian)7,160 79.7% Black or African American30 100.0% American Indian / Alaska Native2,421 93.9% Asian2,557 81.1% Other race2,670 97.8% Two or more races25,686 93.6% White alone, not Hispanic / Latino3,042 89.1% Hispanic or LatinoMoved within same county 899 3.2% White / Caucasian353 3.9% Black or African American94 3.7% Asian283 9.0% Other race58 2.1% Two or more races921 3.4% White alone, not Hispanic / Latino207 6.1% Hispanic or LatinoMoved within same state 768 2.7% White / Caucasian724 8.1% Black or African American82 3.2% Asian54 1.7% Other race2 0.1% Two or more races773 2.8% White alone, not Hispanic / Latino58 1.7% Hispanic or LatinoMoved from different state 148 0.5% White / Caucasian149 1.7% Black or African American20 0.8% Asian33 1.1% Other race43 1.6% Two or more races147 0.5% White alone, not Hispanic / Latino46 1.3% Hispanic or LatinoMoved from abroad 20 0.1% White828 9.2% Black or African American24 0.1% White alone, not Hispanic / Latino
Children Nativity (place of birth) in Fairfield
Children under 6 years - Living with two parents Both parents native 1,112 100.0% NativeBoth parents foreign-born 862 87.7% Native121 12.3% Foreign-bornOne native, one foreign-born parent 188 100.0% NativeChildren under 6 years - Living with one parent Native parent 1,051 100.0% NativeForeign-born parent 191 65.3% Native102 34.7% Foreign-bornChildren 6 to 17 years - Living with two parents Both parents native 1,732 100.0% NativeBoth parents foreign-born 1,711 84.6% Native312 15.4% Foreign-bornOne native, one foreign-born parent 302 100.0% NativeChildren 6 to 17 years - Living with one parent Native parent 1,823 100.0% NativeForeign-born parent 196 30.7% Native443 69.3% Foreign-born
Grandparents responsible for own grandchildren in Fairfield
Grandparents (30 to 59 years) White / Caucasian 138 80.6% Responsible for grandchildren33 19.4% Not responsible for grandchildrenBlack or African American 21 33.3% Responsible for grandchildren41 66.7% Not responsible for grandchildrenAsian 13 100.0% Not responsible for grandchildrenTwo or more races 9 100.0% Not responsible for grandchildrenWhite alone, not Hispanic / Latino 147 80.2% Responsible for grandchildren36 19.8% Not responsible for grandchildrenGrandparents (60 years and over) White / Caucasian 23 17.1% Responsible for grandchildren111 82.9% Not responsible for grandchildrenBlack or African American 31 33.6% Responsible for grandchildren61 66.4% Not responsible for grandchildrenAsian 98 100.0% Not responsible for grandchildrenTwo or more races 4 100.0% Not responsible for grandchildrenWhite alone, not Hispanic / Latino 23 17.1% Responsible for grandchildren111 82.9% Not responsible for grandchildren