Races in Fairmont City, Illinois (IL) Detailed Stats
Data:
Races - White alone (%)
Races - White alone (% change since 2000)
Races - Black alone (%)
Races - Black alone (% change since 2000)
Races - American Indian alone (%)
Races - American Indian alone (% change since 2000)
Races - Asian alone (%)
Races - Asian alone (% change since 2000)
Races - Hispanic (%)
Races - Hispanic (% change since 2000)
Races - Native Hawaiian and Other Pacific Islander alone (%)
Races - Native Hawaiian and Other Pacific Islander alone (% change since 2000)
Races - Two or more races(%)
Races - Two or more races(% change since 2000)
Races - Other race alone (%)
Races - Other race alone (% change since 2000)
Racial diversity
Place of birth - Born in state of residence (%)
Place of birth - Born in state of residence (%) - White
Place of birth - Born in state of residence (%) - Black or African American
Place of birth - Born in state of residence (%) - Asian
Place of birth - Born in state of residence (%) - Hispanic or Latino
Place of birth - Born in state of residence (%) - American Indian and Alaska Native
Place of birth - Born in state of residence (%) - Multirace
Place of birth - Born in state of residence (%) - Other Race
Place of birth - Born in other state (%)
Place of birth - Born in other state (%) - White
Place of birth - Born in other state (%) - Black or African American
Place of birth - Born in other state (%) - Asian
Place of birth - Born in other state (%) - Hispanic or Latino
Place of birth - Born in other state (%) - American Indian and Alaska Native
Place of birth - Born in other state (%) - Multirace
Place of birth - Born in other state (%) - Other Race
Place of birth - Native, outside of US (%)
Place of birth - Native, outside of US (%) - White
Place of birth - Native, outside of US (%) - Black or African American
Place of birth - Native, outside of US (%) - Asian
Place of birth - Native, outside of US (%) - Hispanic or Latino
Place of birth - Native, outside of US (%) - American Indian and Alaska Native
Place of birth - Native, outside of US (%) - Multirace
Place of birth - Native, outside of US (%) - Other Race
Place of birth - Foreign born (%)
Place of birth - Foreign born (%) - White
Place of birth - Foreign born (%) - Black or African American
Place of birth - Foreign born (%) - Asian
Place of birth - Foreign born (%) - Hispanic or Latino
Place of birth - Foreign born (%) - American Indian and Alaska Native
Place of birth - Foreign born (%) - Multirace
Place of birth - Foreign born (%) - Other Race
Residents speaking English at home (%)
Residents speaking English at home - Born in the United States (%)
Residents speaking English at home - Native, born elsewhere (%)
Residents speaking English at home - Foreign born (%)
Residents speaking Spanish at home (%)
Residents speaking Spanish at home - Born in the United States (%)
Residents speaking Spanish at home - Native, born elsewhere (%)
Residents speaking Spanish at home - Foreign born (%)
Residents speaking other language at home (%)
Residents speaking other language at home - Born in the United States (%)
Residents speaking other language at home - Native, born elsewhere (%)
Residents speaking other language at home - Foreign born (%)
Marital status - Never married (%)
Marital status - Now married (%)
Marital status - Separated (%)
Marital status - Widowed (%)
Marital status - Divorced (%)
Ancestries Reported - Arab (%)
Ancestries Reported - Czech (%)
Ancestries Reported - Danish (%)
Ancestries Reported - Dutch (%)
Ancestries Reported - English (%)
Ancestries Reported - French (%)
Ancestries Reported - French Canadian (%)
Ancestries Reported - German (%)
Ancestries Reported - Greek (%)
Ancestries Reported - Hungarian (%)
Ancestries Reported - Irish (%)
Ancestries Reported - Italian (%)
Ancestries Reported - Lithuanian (%)
Ancestries Reported - Norwegian (%)
Ancestries Reported - Polish (%)
Ancestries Reported - Portuguese (%)
Ancestries Reported - Russian (%)
Ancestries Reported - Scotch-Irish (%)
Ancestries Reported - Scottish (%)
Ancestries Reported - Slovak (%)
Ancestries Reported - Subsaharan African (%)
Ancestries Reported - Swedish (%)
Ancestries Reported - Swiss (%)
Ancestries Reported - Ukrainian (%)
Ancestries Reported - United States (%)
Ancestries Reported - Welsh (%)
Ancestries Reported - West Indian (%)
Ancestries Reported - Other (%)
Geographical mobility - Same house 1 year ago (%)
Geographical mobility - Same house 1 year ago (%) - White
Geographical mobility - Same house 1 year ago (%) - Black or African American
Geographical mobility - Same house 1 year ago (%) - Asian
Geographical mobility - Same house 1 year ago (%) - Hispanic or Latino
Geographical mobility - Same house 1 year ago (%) - American Indian and Alaska Native
Geographical mobility - Same house 1 year ago (%) - Multirace
Geographical mobility - Same house 1 year ago (%) - Other Race
Geographical mobility - Moved within same county (%)
Geographical mobility - Moved within same county (%) - White
Geographical mobility - Moved within same county (%) - Black or African American
Geographical mobility - Moved within same county (%) - Asian
Geographical mobility - Moved within same county (%) - Hispanic or Latino
Geographical mobility - Moved within same county (%) - American Indian and Alaska Native
Geographical mobility - Moved within same county (%) - Multirace
Geographical mobility - Moved within same county (%) - Other Race
Geographical mobility - Moved from different county within same state (%)
Geographical mobility - Moved from different county within same state (%) - White
Geographical mobility - Moved from different county within same state (%) - Black or African American
Geographical mobility - Moved from different county within same state (%) - Asian
Geographical mobility - Moved from different county within same state (%) - Hispanic or Latino
Geographical mobility - Moved from different county within same state (%) - American Indian and Alaska Native
Geographical mobility - Moved from different county within same state (%) - Multirace
Geographical mobility - Moved from different county within same state (%) - Other Race
Geographical mobility - Moved from different state (%)
Geographical mobility - Moved from different state (%) - White
Geographical mobility - Moved from different state (%) - Black or African American
Geographical mobility - Moved from different state (%) - Asian
Geographical mobility - Moved from different state (%) - Hispanic or Latino
Geographical mobility - Moved from different state (%) - American Indian and Alaska Native
Geographical mobility - Moved from different state (%) - Multirace
Geographical mobility - Moved from different state (%) - Other Race
Geographical mobility - Moved from abroad (%)
Geographical mobility - Moved from abroad (%) - White
Geographical mobility - Moved from abroad (%) - Black or African American
Geographical mobility - Moved from abroad (%) - Asian
Geographical mobility - Moved from abroad (%) - Hispanic or Latino
Geographical mobility - Moved from abroad (%) - American Indian and Alaska Native
Geographical mobility - Moved from abroad (%) - Multirace
Geographical mobility - Moved from abroad (%) - Other Race
Place of birth for the foreign-born population - Ireland (%)
Place of birth for the foreign-born population - Denmark (%)
Place of birth for the foreign-born population - Norway (%)
Place of birth for the foreign-born population - Sweden (%)
Place of birth for the foreign-born population - United Kingdom (%)
Place of birth for the foreign-born population - England (%)
Place of birth for the foreign-born population - Scotland (%)
Place of birth for the foreign-born population - Other Northern Europe (%)
Place of birth for the foreign-born population - Austria (%)
Place of birth for the foreign-born population - Belgium (%)
Place of birth for the foreign-born population - France (%)
Place of birth for the foreign-born population - Germany (%)
Place of birth for the foreign-born population - Netherlands (%)
Place of birth for the foreign-born population - Switzerland (%)
Place of birth for the foreign-born population - Other Western Europe (%)
Place of birth for the foreign-born population - Greece (%)
Place of birth for the foreign-born population - Italy (%)
Place of birth for the foreign-born population - Portugal (%)
Place of birth for the foreign-born population - Spain (%)
Place of birth for the foreign-born population - Other Southern Europe (%)
Place of birth for the foreign-born population - Albania (%)
Place of birth for the foreign-born population - Belarus (%)
Place of birth for the foreign-born population - Bosnia and Herzegovina (%)
Place of birth for the foreign-born population - Bulgaria (%)
Place of birth for the foreign-born population - Croatia (%)
Place of birth for the foreign-born population - Czechoslovakia (%)
Place of birth for the foreign-born population - Hungary (%)
Place of birth for the foreign-born population - Latvia (%)
Place of birth for the foreign-born population - Lithuania (%)
Place of birth for the foreign-born population - North Macedonia (Macedonia) (%)
Place of birth for the foreign-born population - Moldova (%)
Place of birth for the foreign-born population - Poland (%)
Place of birth for the foreign-born population - Romania (%)
Place of birth for the foreign-born population - Russia (%)
Place of birth for the foreign-born population - Serbia (%)
Place of birth for the foreign-born population - Ukraine (%)
Place of birth for the foreign-born population - Other Eastern Europe (%)
Place of birth for the foreign-born population - China (%)
Place of birth for the foreign-born population - Hong Kong (%)
Place of birth for the foreign-born population - Taiwan (%)
Place of birth for the foreign-born population - Japan (%)
Place of birth for the foreign-born population - Korea (%)
Place of birth for the foreign-born population - Other Eastern Asia (%)
Place of birth for the foreign-born population - Afghanistan (%)
Place of birth for the foreign-born population - Bangladesh (%)
Place of birth for the foreign-born population - India (%)
Place of birth for the foreign-born population - Iran (%)
Place of birth for the foreign-born population - Kazakhstan (%)
Place of birth for the foreign-born population - Nepal (%)
Place of birth for the foreign-born population - Pakistan (%)
Place of birth for the foreign-born population - Sri Lanka (%)
Place of birth for the foreign-born population - Uzbekistan (%)
Place of birth for the foreign-born population - Other South Central Asia (%)
Place of birth for the foreign-born population - Burma (%)
Place of birth for the foreign-born population - Cambodia (%)
Place of birth for the foreign-born population - Indonesia (%)
Place of birth for the foreign-born population - Laos (%)
Place of birth for the foreign-born population - Malaysia (%)
Place of birth for the foreign-born population - Philippines (%)
Place of birth for the foreign-born population - Singapore (%)
Place of birth for the foreign-born population - Thailand (%)
Place of birth for the foreign-born population - Vietnam (%)
Place of birth for the foreign-born population - Other South Eastern Asia (%)
Place of birth for the foreign-born population - Armenia (%)
Place of birth for the foreign-born population - Iraq (%)
Place of birth for the foreign-born population - Israel (%)
Place of birth for the foreign-born population - Jordan (%)
Place of birth for the foreign-born population - Kuwait (%)
Place of birth for the foreign-born population - Lebanon (%)
Place of birth for the foreign-born population - Saudi Arabia (%)
Place of birth for the foreign-born population - Syria (%)
Place of birth for the foreign-born population - Turkey (%)
Place of birth for the foreign-born population - Yemen (%)
Place of birth for the foreign-born population - Other Western Asia (%)
Place of birth for the foreign-born population - Eritrea (%)
Place of birth for the foreign-born population - Ethiopia (%)
Place of birth for the foreign-born population - Kenya (%)
Place of birth for the foreign-born population - Somalia (%)
Place of birth for the foreign-born population - Uganda (%)
Place of birth for the foreign-born population - Zimbabwe (%)
Place of birth for the foreign-born population - Other Eastern Africa (%)
Place of birth for the foreign-born population - Cameroon (%)
Place of birth for the foreign-born population - Congo (%)
Place of birth for the foreign-born population - Democratic Republic of Congo (Zaire) (%)
Place of birth for the foreign-born population - Other Middle Africa (%)
Place of birth for the foreign-born population - Egypt (%)
Place of birth for the foreign-born population - Morocco (%)
Place of birth for the foreign-born population - Sudan (%)
Place of birth for the foreign-born population - Other Northern Africa (%)
Place of birth for the foreign-born population - South Africa (%)
Place of birth for the foreign-born population - Other Southern Africa (%)
Place of birth for the foreign-born population - Cabo Verde (%)
Place of birth for the foreign-born population - Ghana (%)
Place of birth for the foreign-born population - Liberia (%)
Place of birth for the foreign-born population - Nigeria (%)
Place of birth for the foreign-born population - Senegal (%)
Place of birth for the foreign-born population - Sierra Leone (%)
Place of birth for the foreign-born population - Other Western Africa (%)
Place of birth for the foreign-born population - Australia (%)
Place of birth for the foreign-born population - New Zealand (%)
Place of birth for the foreign-born population - Fiji (%)
Place of birth for the foreign-born population - Micronesia (%)
Place of birth for the foreign-born population - Bahamas (%)
Place of birth for the foreign-born population - Barbados (%)
Place of birth for the foreign-born population - Cuba (%)
Place of birth for the foreign-born population - Dominica (%)
Place of birth for the foreign-born population - Dominican Republic (%)
Place of birth for the foreign-born population - Grenada (%)
Place of birth for the foreign-born population - Haiti (%)
Place of birth for the foreign-born population - Jamaica (%)
Place of birth for the foreign-born population - St. Vincent and the Grenadines (%)
Place of birth for the foreign-born population - Trinidad and Tobago (%)
Place of birth for the foreign-born population - West Indies (%)
Place of birth for the foreign-born population - Other Caribbean (%)
Place of birth for the foreign-born population - Belize (%)
Place of birth for the foreign-born population - Costa Rica (%)
Place of birth for the foreign-born population - El Salvador (%)
Place of birth for the foreign-born population - Guatemala (%)
Place of birth for the foreign-born population - Honduras (%)
Place of birth for the foreign-born population - Mexico (%)
Place of birth for the foreign-born population - Nicaragua (%)
Place of birth for the foreign-born population - Panama (%)
Place of birth for the foreign-born population - Other Central America (%)
Place of birth for the foreign-born population - Argentina (%)
Place of birth for the foreign-born population - Bolivia (%)
Place of birth for the foreign-born population - Brazil (%)
Place of birth for the foreign-born population - Chile (%)
Place of birth for the foreign-born population - Colombia (%)
Place of birth for the foreign-born population - Ecuador (%)
Place of birth for the foreign-born population - Guyana (%)
Place of birth for the foreign-born population - Peru (%)
Place of birth for the foreign-born population - Uruguay (%)
Place of birth for the foreign-born population - Venezuela (%)
Place of birth for the foreign-born population - Other South America (%)
Place of birth for the foreign-born population - Canada (%)
Place of birth for the foreign-born population - Other Northern America (%)
Place of birth for the foreign-born population - Other (%)
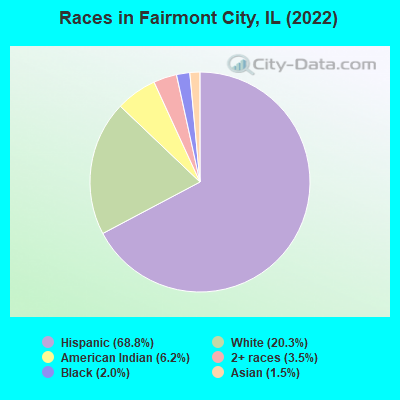
According to 2022 data, the most numerous races in Fairmont City, IL are White alone (424 residents), Hispanic (1,437 residents), and Black alone (42 residents). 44.5% of Fairmont City residents speak English at home. 23.3% of Fairmont City, IL residents are foreign-born (22.9% born in Latin America), which is 39.9% greater than the foreign-born rate of 14.0% across the entire state of Illinois.
Race distribution in Fairmont City
2000 2022
8,424,140 67.8% White alone 1,856,152 14.9% Black alone 1,530,262 12.3% Hispanic 419,916 3.4% Asian alone 153,996 1.2% Two or more races 13,479 0.1% Other race alone 18,232 0.1% American Indian alone 3,116 0.03% Native Hawaiian and Other
7,356,301 58.5% White alone 2,299,726 18.3% Hispanic 1,660,423 13.2% Black alone 747,296 5.9% Asian alone 458,599 3.6% Two or more races 45,386 0.4% Other race alone 10,405 0.08% American Indian alone 3,896 0.03% Native Hawaiian and Other
Income and house value in Fairmont City Median household income in 2022 $51,479 White non-Hispanic householders$55,610 American Indian and Alaska Native householders$84,913 Some other race householders$85,615 Two or more races householders$40,972 Hispanic or Latino race householdersMedian 2022 house value $87,967 White Non-Hispanic householders$110,210 Black or African American householders $190,362 Asian householders$76,746 Some other race householders$111,612 Two or more races householders$93,377 Hispanic or Latino householders
Median age by race in Fairmont City
52.6 Median age for White residents54.8 47.3 -672,397,325.0 Median age for Black or African American residents-649,999,999.4 -678,819,443.8 49.6 Median age for American Indian / Alaska Native residents45.5 59.0 -673,665,791.1 Median age for Asian residents-816,993,463.2 -606,918,238.4 -593,236,714.4 Median age for Native Hawaiian / Pacific Islander residents-666,666,666.0 -576,015,108.0 41.5 Median age for Other race residents45.7 45.5 49.1 Median age for Two or more races residents50.1 48.3 54.9 Median age for White alone residents61.0 51.2 39.4 Median age for Hispanic or Latino residents48.6 36.3
Owner/renter occupied households by race in Fairmont City
House owners and renters - White residents 289 76.1% Owner occupied91 23.9% Renter occupiedHouse owners and renters - Black or African American residents 2 100.0% Renter occupiedHouse owners and renters - American Indian / Alaska Native residents 19 29.0% Owner occupied46 71.0% Renter occupiedHouse owners and renters - Other race residents 221 63.8% Owner occupied125 36.2% Renter occupiedHouse owners and renters - Two or more races residents 73 100.0% Owner occupiedHouse owners and renters - White alone residents 137 63.5% Owner occupied79 36.5% Renter occupiedHouse owners and renters - Hispanic or Latino residents 315 65.4% Owner occupied167 34.6% Renter occupied
Language usage in Fairmont City
English speakers - Total 44.5% of residents of Fairmont City speak English at home.
68.2% of residents speak Spanish at home 705 51.7% Speak English very well659 48.3% Speak English less than very well
English speakers - Born in the United States 57.7% of residents of Fairmont City speak English at home.
55.7% of residents speak Spanish at home 137 70.3% Speak English very well58 29.7% Speak English less than very well
English speakers - Native, born elsewhere 29.5% of residents of Fairmont City speak English at home.
67.0% of residents speak Spanish at home 75 100.0% Speak English very well
English speakers - Foreign-born 0.0% of residents of Fairmont City speak English at home.
116.1% of residents speak Spanish at home 261 48.9% Speak English very well273 51.1% Speak English less than very well
White (Caucasian) - Speak another language Native:
16.9% (113)Foreign-born:
79.1% (71)
American Indian / Alaska Native - Speak another language Native:
100.0% (130)Foreign-born:
100.0% (268)
Other race - Speak another language Native:
64.9% (521)Foreign-born:
100.0% (195)
Two or more races - Speak another language Native:
51.0% (120)Foreign-born:
100.0% (26)
Hispanic or Latino - Speak another language Native:
61.4% (618)Foreign-born:
100.0% (324)
Foreign-born residents in Fairmont City 487 residents are foreign born (22.9% Latin America ).
This city:
23.3%Illinois:
14.1%
Marital status for residents in Fairmont City Marital status - White (Caucasian) population 15 years and over
Males 27.0% Never married35.0% Now married3.8% Separated1.3% Widowed32.9% DivorcedFemales 27.9% Never married48.5% Now married2.4% Separated14.2% Widowed7.0% DivorcedWomen who gave birth in the past 12 months Now married:
100.0% (6)Unmarried:
0.0% (0)
Women who did not give birth in the past 12 months Now married:
51.8% (94)Unmarried:
48.2% (88)
Marital status - Black or African American population 15 years and over
Males 0.0% Never married100.0% Now married0.0% Separated0.0% Widowed0.0% DivorcedFemales 100.0% Never married0.0% Now married0.0% Separated0.0% Widowed0.0% DivorcedWomen who did not give birth in the past 12 months Now married:
0.0% (0)Unmarried:
100.0% (40)
Marital status - American Indian / Alaska Native population 15 years and over
Males 6.0% Never married18.1% Now married30.2% Separated0.0% Widowed45.6% DivorcedFemales 21.5% Never married11.4% Now married0.0% Separated0.0% Widowed67.1% DivorcedWomen who did not give birth in the past 12 months Now married:
0.0% (0)Unmarried:
100.0% (28)
Marital status - Other race population 15 years and over
Males 44.9% Never married50.6% Now married0.0% Separated0.0% Widowed4.4% DivorcedFemales 32.7% Never married33.3% Now married0.0% Separated5.4% Widowed28.6% DivorcedWomen who gave birth in the past 12 months Now married:
100.0% (6)Unmarried:
0.0% (0)
Women who did not give birth in the past 12 months Now married:
36.7% (76)Unmarried:
63.3% (130)
Marital status - Two or more races population 15 years and over
Males 16.9% Never married69.5% Now married0.0% Separated0.0% Widowed13.6% DivorcedFemales 24.4% Never married57.3% Now married0.0% Separated18.3% Widowed0.0% DivorcedWomen who gave birth in the past 12 months Now married:
0.0% (0)Unmarried:
100.0% (4)
Women who did not give birth in the past 12 months Now married:
75.6% (48)Unmarried:
24.4% (15)
Marital status - White alone, not Hispanic / Latino population 15 years and over
Males 20.0% Never married35.0% Now married10.0% Separated3.6% Widowed31.4% DivorcedFemales 26.9% Never married43.3% Now married3.4% Separated19.8% Widowed6.7% DivorcedWomen who gave birth in the past 12 months Now married:
96.8% (1)Unmarried:
0.0% (0)
Women who did not give birth in the past 12 months Now married:
48.8% (61)Unmarried:
51.2% (64)
Marital status - Hispanic or Latino population 15 years and over
Males 36.2% Never married48.1% Now married0.8% Separated0.0% Widowed14.8% DivorcedFemales 31.7% Never married43.7% Now married0.0% Separated6.2% Widowed18.4% DivorcedWomen who gave birth in the past 12 months Now married:
76.9% (11)Unmarried:
23.1% (3)
Women who did not give birth in the past 12 months Now married:
44.9% (148)Unmarried:
55.1% (182)
Ancestries in Fairmont City
22 2.0% American10 0.9% German8 0.7% English5 0.4% Austrian4 0.4% Polish3 0.3% French1 0.09% Italian
Children Nativity (place of birth) in Fairmont City
Children under 6 years - Living with two parents Both parents native 49 100.0% NativeBoth parents foreign-born 3 100.0% NativeOne native, one foreign-born parent 9 100.0% NativeChildren under 6 years - Living with one parent Native parent 52 100.0% NativeForeign-born parent 22 100.0% NativeChildren 6 to 17 years - Living with two parents Both parents native 85 100.0% NativeBoth parents foreign-born 71 100.0% NativeOne native, one foreign-born parent 19 100.0% NativeChildren 6 to 17 years - Living with one parent Native parent 60 100.0% NativeForeign-born parent 35 50.8% Native34 49.2% Foreign-born
Place of birth for residents in Fairmont City 487 Americas487 Latin America487 Central America
Grandparents responsible for own grandchildren in Fairmont City
Grandparents (30 to 59 years) American Indian / Alaska Native 16 100.0% Not responsible for grandchildrenOther race 8 100.0% Not responsible for grandchildrenHispanic or Latino 25 100.0% Not responsible for grandchildren
Grandparents (60 years and over) American Indian / Alaska Native 57 100.0% Not responsible for grandchildrenOther race 15 100.0% Not responsible for grandchildrenHispanic or Latino 24 100.0% Not responsible for grandchildren