Races in Fairview Park, Ohio (OH) Detailed Stats
Data:
Races - White alone (%)
Races - White alone (% change since 2000)
Races - Black alone (%)
Races - Black alone (% change since 2000)
Races - American Indian alone (%)
Races - American Indian alone (% change since 2000)
Races - Asian alone (%)
Races - Asian alone (% change since 2000)
Races - Hispanic (%)
Races - Hispanic (% change since 2000)
Races - Native Hawaiian and Other Pacific Islander alone (%)
Races - Native Hawaiian and Other Pacific Islander alone (% change since 2000)
Races - Two or more races(%)
Races - Two or more races(% change since 2000)
Races - Other race alone (%)
Races - Other race alone (% change since 2000)
Racial diversity
Place of birth - Born in state of residence (%)
Place of birth - Born in state of residence (%) - White
Place of birth - Born in state of residence (%) - Black or African American
Place of birth - Born in state of residence (%) - Asian
Place of birth - Born in state of residence (%) - Hispanic or Latino
Place of birth - Born in state of residence (%) - American Indian and Alaska Native
Place of birth - Born in state of residence (%) - Multirace
Place of birth - Born in state of residence (%) - Other Race
Place of birth - Born in other state (%)
Place of birth - Born in other state (%) - White
Place of birth - Born in other state (%) - Black or African American
Place of birth - Born in other state (%) - Asian
Place of birth - Born in other state (%) - Hispanic or Latino
Place of birth - Born in other state (%) - American Indian and Alaska Native
Place of birth - Born in other state (%) - Multirace
Place of birth - Born in other state (%) - Other Race
Place of birth - Native, outside of US (%)
Place of birth - Native, outside of US (%) - White
Place of birth - Native, outside of US (%) - Black or African American
Place of birth - Native, outside of US (%) - Asian
Place of birth - Native, outside of US (%) - Hispanic or Latino
Place of birth - Native, outside of US (%) - American Indian and Alaska Native
Place of birth - Native, outside of US (%) - Multirace
Place of birth - Native, outside of US (%) - Other Race
Place of birth - Foreign born (%)
Place of birth - Foreign born (%) - White
Place of birth - Foreign born (%) - Black or African American
Place of birth - Foreign born (%) - Asian
Place of birth - Foreign born (%) - Hispanic or Latino
Place of birth - Foreign born (%) - American Indian and Alaska Native
Place of birth - Foreign born (%) - Multirace
Place of birth - Foreign born (%) - Other Race
Residents speaking English at home (%)
Residents speaking English at home - Born in the United States (%)
Residents speaking English at home - Native, born elsewhere (%)
Residents speaking English at home - Foreign born (%)
Residents speaking Spanish at home (%)
Residents speaking Spanish at home - Born in the United States (%)
Residents speaking Spanish at home - Native, born elsewhere (%)
Residents speaking Spanish at home - Foreign born (%)
Residents speaking other language at home (%)
Residents speaking other language at home - Born in the United States (%)
Residents speaking other language at home - Native, born elsewhere (%)
Residents speaking other language at home - Foreign born (%)
Marital status - Never married (%)
Marital status - Now married (%)
Marital status - Separated (%)
Marital status - Widowed (%)
Marital status - Divorced (%)
Ancestries Reported - Arab (%)
Ancestries Reported - Czech (%)
Ancestries Reported - Danish (%)
Ancestries Reported - Dutch (%)
Ancestries Reported - English (%)
Ancestries Reported - French (%)
Ancestries Reported - French Canadian (%)
Ancestries Reported - German (%)
Ancestries Reported - Greek (%)
Ancestries Reported - Hungarian (%)
Ancestries Reported - Irish (%)
Ancestries Reported - Italian (%)
Ancestries Reported - Lithuanian (%)
Ancestries Reported - Norwegian (%)
Ancestries Reported - Polish (%)
Ancestries Reported - Portuguese (%)
Ancestries Reported - Russian (%)
Ancestries Reported - Scotch-Irish (%)
Ancestries Reported - Scottish (%)
Ancestries Reported - Slovak (%)
Ancestries Reported - Subsaharan African (%)
Ancestries Reported - Swedish (%)
Ancestries Reported - Swiss (%)
Ancestries Reported - Ukrainian (%)
Ancestries Reported - United States (%)
Ancestries Reported - Welsh (%)
Ancestries Reported - West Indian (%)
Ancestries Reported - Other (%)
Geographical mobility - Same house 1 year ago (%)
Geographical mobility - Same house 1 year ago (%) - White
Geographical mobility - Same house 1 year ago (%) - Black or African American
Geographical mobility - Same house 1 year ago (%) - Asian
Geographical mobility - Same house 1 year ago (%) - Hispanic or Latino
Geographical mobility - Same house 1 year ago (%) - American Indian and Alaska Native
Geographical mobility - Same house 1 year ago (%) - Multirace
Geographical mobility - Same house 1 year ago (%) - Other Race
Geographical mobility - Moved within same county (%)
Geographical mobility - Moved within same county (%) - White
Geographical mobility - Moved within same county (%) - Black or African American
Geographical mobility - Moved within same county (%) - Asian
Geographical mobility - Moved within same county (%) - Hispanic or Latino
Geographical mobility - Moved within same county (%) - American Indian and Alaska Native
Geographical mobility - Moved within same county (%) - Multirace
Geographical mobility - Moved within same county (%) - Other Race
Geographical mobility - Moved from different county within same state (%)
Geographical mobility - Moved from different county within same state (%) - White
Geographical mobility - Moved from different county within same state (%) - Black or African American
Geographical mobility - Moved from different county within same state (%) - Asian
Geographical mobility - Moved from different county within same state (%) - Hispanic or Latino
Geographical mobility - Moved from different county within same state (%) - American Indian and Alaska Native
Geographical mobility - Moved from different county within same state (%) - Multirace
Geographical mobility - Moved from different county within same state (%) - Other Race
Geographical mobility - Moved from different state (%)
Geographical mobility - Moved from different state (%) - White
Geographical mobility - Moved from different state (%) - Black or African American
Geographical mobility - Moved from different state (%) - Asian
Geographical mobility - Moved from different state (%) - Hispanic or Latino
Geographical mobility - Moved from different state (%) - American Indian and Alaska Native
Geographical mobility - Moved from different state (%) - Multirace
Geographical mobility - Moved from different state (%) - Other Race
Geographical mobility - Moved from abroad (%)
Geographical mobility - Moved from abroad (%) - White
Geographical mobility - Moved from abroad (%) - Black or African American
Geographical mobility - Moved from abroad (%) - Asian
Geographical mobility - Moved from abroad (%) - Hispanic or Latino
Geographical mobility - Moved from abroad (%) - American Indian and Alaska Native
Geographical mobility - Moved from abroad (%) - Multirace
Geographical mobility - Moved from abroad (%) - Other Race
Place of birth for the foreign-born population - Ireland (%)
Place of birth for the foreign-born population - Denmark (%)
Place of birth for the foreign-born population - Norway (%)
Place of birth for the foreign-born population - Sweden (%)
Place of birth for the foreign-born population - United Kingdom (%)
Place of birth for the foreign-born population - England (%)
Place of birth for the foreign-born population - Scotland (%)
Place of birth for the foreign-born population - Other Northern Europe (%)
Place of birth for the foreign-born population - Austria (%)
Place of birth for the foreign-born population - Belgium (%)
Place of birth for the foreign-born population - France (%)
Place of birth for the foreign-born population - Germany (%)
Place of birth for the foreign-born population - Netherlands (%)
Place of birth for the foreign-born population - Switzerland (%)
Place of birth for the foreign-born population - Other Western Europe (%)
Place of birth for the foreign-born population - Greece (%)
Place of birth for the foreign-born population - Italy (%)
Place of birth for the foreign-born population - Portugal (%)
Place of birth for the foreign-born population - Spain (%)
Place of birth for the foreign-born population - Other Southern Europe (%)
Place of birth for the foreign-born population - Albania (%)
Place of birth for the foreign-born population - Belarus (%)
Place of birth for the foreign-born population - Bosnia and Herzegovina (%)
Place of birth for the foreign-born population - Bulgaria (%)
Place of birth for the foreign-born population - Croatia (%)
Place of birth for the foreign-born population - Czechoslovakia (%)
Place of birth for the foreign-born population - Hungary (%)
Place of birth for the foreign-born population - Latvia (%)
Place of birth for the foreign-born population - Lithuania (%)
Place of birth for the foreign-born population - North Macedonia (Macedonia) (%)
Place of birth for the foreign-born population - Moldova (%)
Place of birth for the foreign-born population - Poland (%)
Place of birth for the foreign-born population - Romania (%)
Place of birth for the foreign-born population - Russia (%)
Place of birth for the foreign-born population - Serbia (%)
Place of birth for the foreign-born population - Ukraine (%)
Place of birth for the foreign-born population - Other Eastern Europe (%)
Place of birth for the foreign-born population - China (%)
Place of birth for the foreign-born population - Hong Kong (%)
Place of birth for the foreign-born population - Taiwan (%)
Place of birth for the foreign-born population - Japan (%)
Place of birth for the foreign-born population - Korea (%)
Place of birth for the foreign-born population - Other Eastern Asia (%)
Place of birth for the foreign-born population - Afghanistan (%)
Place of birth for the foreign-born population - Bangladesh (%)
Place of birth for the foreign-born population - India (%)
Place of birth for the foreign-born population - Iran (%)
Place of birth for the foreign-born population - Kazakhstan (%)
Place of birth for the foreign-born population - Nepal (%)
Place of birth for the foreign-born population - Pakistan (%)
Place of birth for the foreign-born population - Sri Lanka (%)
Place of birth for the foreign-born population - Uzbekistan (%)
Place of birth for the foreign-born population - Other South Central Asia (%)
Place of birth for the foreign-born population - Burma (%)
Place of birth for the foreign-born population - Cambodia (%)
Place of birth for the foreign-born population - Indonesia (%)
Place of birth for the foreign-born population - Laos (%)
Place of birth for the foreign-born population - Malaysia (%)
Place of birth for the foreign-born population - Philippines (%)
Place of birth for the foreign-born population - Singapore (%)
Place of birth for the foreign-born population - Thailand (%)
Place of birth for the foreign-born population - Vietnam (%)
Place of birth for the foreign-born population - Other South Eastern Asia (%)
Place of birth for the foreign-born population - Armenia (%)
Place of birth for the foreign-born population - Iraq (%)
Place of birth for the foreign-born population - Israel (%)
Place of birth for the foreign-born population - Jordan (%)
Place of birth for the foreign-born population - Kuwait (%)
Place of birth for the foreign-born population - Lebanon (%)
Place of birth for the foreign-born population - Saudi Arabia (%)
Place of birth for the foreign-born population - Syria (%)
Place of birth for the foreign-born population - Turkey (%)
Place of birth for the foreign-born population - Yemen (%)
Place of birth for the foreign-born population - Other Western Asia (%)
Place of birth for the foreign-born population - Eritrea (%)
Place of birth for the foreign-born population - Ethiopia (%)
Place of birth for the foreign-born population - Kenya (%)
Place of birth for the foreign-born population - Somalia (%)
Place of birth for the foreign-born population - Uganda (%)
Place of birth for the foreign-born population - Zimbabwe (%)
Place of birth for the foreign-born population - Other Eastern Africa (%)
Place of birth for the foreign-born population - Cameroon (%)
Place of birth for the foreign-born population - Congo (%)
Place of birth for the foreign-born population - Democratic Republic of Congo (Zaire) (%)
Place of birth for the foreign-born population - Other Middle Africa (%)
Place of birth for the foreign-born population - Egypt (%)
Place of birth for the foreign-born population - Morocco (%)
Place of birth for the foreign-born population - Sudan (%)
Place of birth for the foreign-born population - Other Northern Africa (%)
Place of birth for the foreign-born population - South Africa (%)
Place of birth for the foreign-born population - Other Southern Africa (%)
Place of birth for the foreign-born population - Cabo Verde (%)
Place of birth for the foreign-born population - Ghana (%)
Place of birth for the foreign-born population - Liberia (%)
Place of birth for the foreign-born population - Nigeria (%)
Place of birth for the foreign-born population - Senegal (%)
Place of birth for the foreign-born population - Sierra Leone (%)
Place of birth for the foreign-born population - Other Western Africa (%)
Place of birth for the foreign-born population - Australia (%)
Place of birth for the foreign-born population - New Zealand (%)
Place of birth for the foreign-born population - Fiji (%)
Place of birth for the foreign-born population - Micronesia (%)
Place of birth for the foreign-born population - Bahamas (%)
Place of birth for the foreign-born population - Barbados (%)
Place of birth for the foreign-born population - Cuba (%)
Place of birth for the foreign-born population - Dominica (%)
Place of birth for the foreign-born population - Dominican Republic (%)
Place of birth for the foreign-born population - Grenada (%)
Place of birth for the foreign-born population - Haiti (%)
Place of birth for the foreign-born population - Jamaica (%)
Place of birth for the foreign-born population - St. Vincent and the Grenadines (%)
Place of birth for the foreign-born population - Trinidad and Tobago (%)
Place of birth for the foreign-born population - West Indies (%)
Place of birth for the foreign-born population - Other Caribbean (%)
Place of birth for the foreign-born population - Belize (%)
Place of birth for the foreign-born population - Costa Rica (%)
Place of birth for the foreign-born population - El Salvador (%)
Place of birth for the foreign-born population - Guatemala (%)
Place of birth for the foreign-born population - Honduras (%)
Place of birth for the foreign-born population - Mexico (%)
Place of birth for the foreign-born population - Nicaragua (%)
Place of birth for the foreign-born population - Panama (%)
Place of birth for the foreign-born population - Other Central America (%)
Place of birth for the foreign-born population - Argentina (%)
Place of birth for the foreign-born population - Bolivia (%)
Place of birth for the foreign-born population - Brazil (%)
Place of birth for the foreign-born population - Chile (%)
Place of birth for the foreign-born population - Colombia (%)
Place of birth for the foreign-born population - Ecuador (%)
Place of birth for the foreign-born population - Guyana (%)
Place of birth for the foreign-born population - Peru (%)
Place of birth for the foreign-born population - Uruguay (%)
Place of birth for the foreign-born population - Venezuela (%)
Place of birth for the foreign-born population - Other South America (%)
Place of birth for the foreign-born population - Canada (%)
Place of birth for the foreign-born population - Other Northern America (%)
Place of birth for the foreign-born population - Other (%)
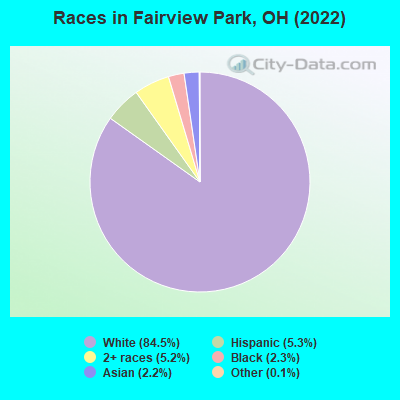
According to 2022 data, the most numerous races in Fairview Park, OH are White alone (14,236 residents), Black alone (385 residents), and Two or more races (875 residents). 91.8% of Fairview Park residents speak English at home. 5.4% of Fairview Park, OH residents are foreign-born (3.2% born in Asia, 1.5% born in Europe), which is 25.5% greater than the foreign-born rate of 4.0% across the entire state of Ohio.
Race distribution in Fairview Park
2000 2022
9,538,111 84.0% White alone 1,290,662 11.4% Black alone 217,123 1.9% Hispanic 137,770 1.2% Two or more races 131,670 1.2% Asian alone 21,985 0.2% American Indian alone 13,483 0.1% Other race alone 2,336 0.02% Native Hawaiian and Other
8,948,793 76.1% White alone 1,401,403 11.9% Black alone 529,291 4.5% Two or more races 517,232 4.4% Hispanic 293,387 2.5% Asian alone 52,805 0.4% Other race alone 9,785 0.08% American Indian alone 3,362 0.03% Native Hawaiian and Other
Income and house value in Fairview Park Median household income in 2022 $76,180 White non-Hispanic householders$56,074 Black householders$83,260 Asian householders$59,066 Some other race householders$90,244 Two or more races householders$64,571 Hispanic or Latino race householdersMedian 2022 house value $238,846 White Non-Hispanic householders$329,291 Black or African American householders $279,590 Asian householders$197,575 Some other race householders$194,413 Two or more races householders$206,356 Hispanic or Latino householders
Median age by race in Fairview Park
41.2 Median age for White residents37.9 46.5 36.9 Median age for Black or African American residents35.7 49.0 -545,601,290.8 Median age for American Indian / Alaska Native residents-734,374,999.3 -499,999,999.5 50.3 Median age for Asian residents35.8 50.7 -706,093,189.3 Median age for Native Hawaiian / Pacific Islander residents-750,242,953.6 -805,394,989.6 48.3 Median age for Other race residents42.9 39.1 13.6 Median age for Two or more races residents10.5 21.8 41.4 Median age for White alone residents38.2 46.4 35.3 Median age for Hispanic or Latino residents39.9 18.0
Owner/renter occupied households by race in Fairview Park
House owners and renters - White residents 5,067 71.6% Owner occupied2,013 28.4% Renter occupiedHouse owners and renters - Black or African American residents 34 27.8% Owner occupied89 72.2% Renter occupiedHouse owners and renters - Asian residents 84 72.3% Owner occupied32 27.7% Renter occupiedHouse owners and renters - Other race residents 71 55.0% Owner occupied58 45.0% Renter occupiedHouse owners and renters - Two or more races residents 151 60.1% Owner occupied100 39.9% Renter occupiedHouse owners and renters - White alone residents 5,033 71.9% Owner occupied1,971 28.1% Renter occupiedHouse owners and renters - Hispanic or Latino residents 211 52.7% Owner occupied189 47.3% Renter occupied
Language usage in Fairview Park
English speakers - Total 91.8% of residents of Fairview Park speak English at home.
2.1% of residents speak Spanish at home 227 66.8% Speak English very well113 33.2% Speak English less than very well6.1% of residents speak other language at home 746 75.6% Speak English very well241 24.4% Speak English less than very well
English speakers - Born in the United States 96.1% of residents of Fairview Park speak English at home.
1.2% of residents speak Spanish at home 25 100.0% Speak English very well2.2% of residents speak other language at home 47 100.0% Speak English very well
English speakers - Native, born elsewhere 39.3% of residents of Fairview Park speak English at home.
53.6% of residents speak Spanish at home 92 81.4% Speak English very well21 18.6% Speak English less than very well2.4% of residents speak other language at home 5 100.0% Speak English very well
English speakers - Foreign-born 15.3% of residents of Fairview Park speak English at home.
6.8% of residents speak Spanish at home 24 40.7% Speak English very well35 59.3% Speak English less than very well78.7% of residents speak other language at home 475 69.3% Speak English very well210 30.7% Speak English less than very well
White (Caucasian) - Speak only English Native:
98.7% (13,139)Foreign-born:
13.0% (65)
White (Caucasian) - Speak another language Native:
1.8% (244)Foreign-born:
86.6% (431)
Asian - Speak only English Native:
44.2% (55)Foreign-born:
27.3% (66)
Asian - Speak another language Native:
56.3% (70)Foreign-born:
72.9% (176)
Other race - Speak another language Native:
43.8% (93)Foreign-born:
100.0% (43)
Two or more races - Speak only English Native:
82.0% (975)Foreign-born:
47.4% (12)
Two or more races - Speak another language Native:
16.8% (200)Foreign-born:
50.6% (13)
White alone - Speak only English Native:
97.9% (12,970)Foreign-born:
12.9% (66)
White alone - Speak another language Native:
2.0% (262)Foreign-born:
87.2% (445)
Hispanic or Latino - Speak another language Native:
33.1% (269)Foreign-born:
100.0% (62)
Foreign-born residents in Fairview Park 905 residents are foreign born (3.2% Asia , 1.5% Europe ).
Marital status for residents in Fairview Park Marital status - White (Caucasian) population 15 years and over
Males 38.3% Never married50.7% Now married1.3% Separated2.6% Widowed7.1% DivorcedFemales 31.1% Never married45.5% Now married1.9% Separated7.8% Widowed13.7% DivorcedWomen who gave birth in the past 12 months Now married:
96.8% (198)Unmarried:
3.2% (7)
Women who did not give birth in the past 12 months Now married:
39.5% (1,135)Unmarried:
60.5% (1,739)
Marital status - Black or African American population 15 years and over
Males 41.0% Never married32.0% Now married11.8% Separated0.0% Widowed15.2% DivorcedFemales 35.9% Never married30.7% Now married0.0% Separated22.9% Widowed10.5% DivorcedWomen who gave birth in the past 12 months Now married:
100.0% (10)Unmarried:
0.0% (0)
Women who did not give birth in the past 12 months Now married:
46.9% (23)Unmarried:
53.1% (26)
Marital status - Asian population 15 years and over
Males 46.9% Never married53.1% Now married0.0% Separated0.0% Widowed0.0% DivorcedFemales 21.3% Never married71.3% Now married0.0% Separated7.3% Widowed0.0% DivorcedWomen who did not give birth in the past 12 months Now married:
61.7% (84)Unmarried:
38.3% (52)
Marital status - Other race population 15 years and over
Males 30.0% Never married60.6% Now married0.0% Separated0.0% Widowed9.4% DivorcedFemales 27.9% Never married41.9% Now married0.0% Separated0.0% Widowed30.2% DivorcedWomen who gave birth in the past 12 months Now married:
100.0% (6)Unmarried:
0.0% (0)
Women who did not give birth in the past 12 months Now married:
0.0% (0)Unmarried:
100.0% (35)
Marital status - Two or more races population 15 years and over
Males 27.7% Never married45.2% Now married16.9% Separated0.0% Widowed10.2% DivorcedFemales 55.6% Never married42.0% Now married0.0% Separated2.3% Widowed0.0% DivorcedWomen who gave birth in the past 12 months Now married:
100.0% (41)Unmarried:
0.0% (0)
Women who did not give birth in the past 12 months Now married:
29.5% (104)Unmarried:
70.5% (249)
Marital status - White alone, not Hispanic / Latino population 15 years and over
Males 37.5% Never married51.2% Now married1.3% Separated2.6% Widowed7.3% DivorcedFemales 31.3% Never married45.2% Now married1.9% Separated7.9% Widowed13.7% DivorcedWomen who gave birth in the past 12 months Now married:
96.8% (203)Unmarried:
3.2% (7)
Women who did not give birth in the past 12 months Now married:
39.3% (1,149)Unmarried:
60.7% (1,778)
Marital status - Hispanic or Latino population 15 years and over
Males 36.4% Never married52.7% Now married6.8% Separated0.0% Widowed4.1% DivorcedFemales 18.7% Never married69.7% Now married0.0% Separated0.0% Widowed11.6% DivorcedWomen who gave birth in the past 12 months Now married:
100.0% (4)Unmarried:
0.0% (0)
Women who did not give birth in the past 12 months Now married:
54.1% (62)Unmarried:
45.9% (52)
Ancestries in Fairview Park
1,178 19.1% Irish853 13.9% German380 6.2% Polish379 6.2% Italian261 4.2% American209 3.4% Albanian185 3.0% English176 2.9% Palestinian171 2.8% European170 2.8% Hungarian153 2.5% Slovak93 1.5% Scottish92 1.5% Iranian92 1.5% Greek90 1.5% Jordanian66 1.1% Eastern European60 1.0% Bulgarian56 0.9% Czech47 0.8% French46 0.7% Welsh30 0.5% Norwegian25 0.4% British21 0.3% Canadian19 0.3% Romanian18 0.3% Haitian14 0.2% Danish12 0.2% Swiss11 0.2% Czechoslovakian10 0.2% Slovene9 0.1% Belgian9 0.1% Swedish7 0.1% Latvian6 0.10% Russian5 0.08% Ukrainian5 0.08% West Indian4 0.06% Croatian4 0.06% Scandinavian4 0.06% Slavic3 0.05% Syrian
Geographical mobility in Fairview Park Same house 1 year ago 12,638 89.2% White (Caucasian)307 82.1% Black or African American18 100.0% American Indian / Alaska Native365 98.7% Asian163 63.7% Other race1,218 90.2% Two or more races12,575 89.0% White alone, not Hispanic / Latino637 71.6% Hispanic or LatinoMoved within same county 1,108 7.8% White / Caucasian34 9.1% Black or African American92 35.9% Other race111 8.2% Two or more races1,121 7.9% White alone, not Hispanic / Latino226 25.4% Hispanic or LatinoMoved within same state 195 1.4% White / Caucasian24 6.3% Black or African American7 0.5% Two or more races196 1.4% White alone, not Hispanic / LatinoMoved from different state 129 0.9% White / Caucasian9 2.3% Black or African American126 0.9% White alone, not Hispanic / Latino15 1.7% Hispanic or LatinoMoved from abroad 44 0.3% White57 0.4% White alone, not Hispanic / Latino
Children Nativity (place of birth) in Fairview Park
Children under 6 years - Living with two parents Both parents native 860 100.0% NativeBoth parents foreign-born 11 100.0% NativeChildren under 6 years - Living with one parent Native parent 157 100.0% NativeChildren 6 to 17 years - Living with two parents Both parents native 1,270 100.0% NativeBoth parents foreign-born 77 100.0% NativeOne native, one foreign-born parent 66 100.0% NativeChildren 6 to 17 years - Living with one parent Native parent 749 99.0% Native7 1.0% Foreign-bornForeign-born parent 96 67.3% Native47 32.7% Foreign-born
Grandparents responsible for own grandchildren in Fairview Park
Grandparents (30 to 59 years) White / Caucasian 9 34.4% Responsible for grandchildren18 65.6% Not responsible for grandchildrenWhite alone, not Hispanic / Latino 10 35.8% Responsible for grandchildren17 64.2% Not responsible for grandchildrenGrandparents (60 years and over) White / Caucasian 64 33.9% Responsible for grandchildren125 66.1% Not responsible for grandchildrenWhite alone, not Hispanic / Latino 65 33.4% Responsible for grandchildren130 66.6% Not responsible for grandchildren