Races in Fairview Shores, Florida (FL) Detailed Stats
Data:
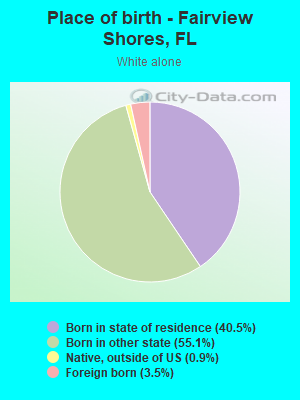
Races - White alone (%)
Races - White alone (% change since 2000)
Races - Black alone (%)
Races - Black alone (% change since 2000)
Races - American Indian alone (%)
Races - American Indian alone (% change since 2000)
Races - Asian alone (%)
Races - Asian alone (% change since 2000)
Races - Hispanic (%)
Races - Hispanic (% change since 2000)
Races - Native Hawaiian and Other Pacific Islander alone (%)
Races - Native Hawaiian and Other Pacific Islander alone (% change since 2000)
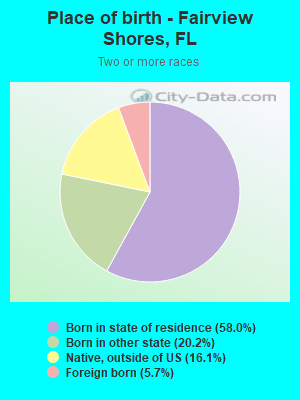
Races - Two or more races(%)
Races - Two or more races(% change since 2000)
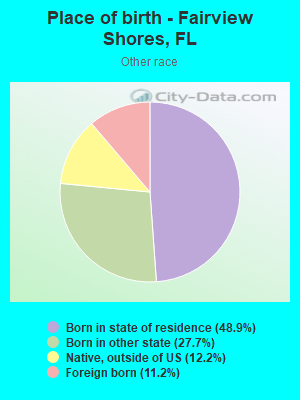
Races - Other race alone (%)
Races - Other race alone (% change since 2000)
Racial diversity
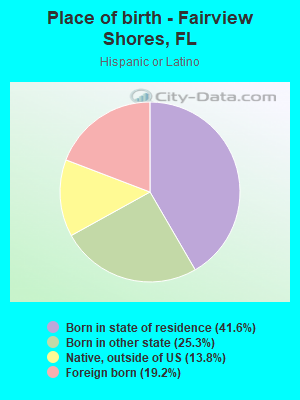
Place of birth - Born in state of residence (%)
Place of birth - Born in state of residence (%) - White
Place of birth - Born in state of residence (%) - Black or African American
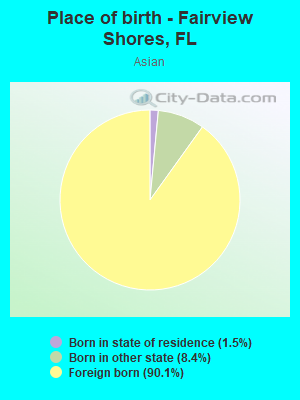
Place of birth - Born in state of residence (%) - Asian
Place of birth - Born in state of residence (%) - Hispanic or Latino
Place of birth - Born in state of residence (%) - American Indian and Alaska Native
Place of birth - Born in state of residence (%) - Multirace
Place of birth - Born in state of residence (%) - Other Race
Place of birth - Born in other state (%)
Place of birth - Born in other state (%) - White
Place of birth - Born in other state (%) - Black or African American
Place of birth - Born in other state (%) - Asian
Place of birth - Born in other state (%) - Hispanic or Latino
Place of birth - Born in other state (%) - American Indian and Alaska Native
Place of birth - Born in other state (%) - Multirace
Place of birth - Born in other state (%) - Other Race
Place of birth - Native, outside of US (%)
Place of birth - Native, outside of US (%) - White
Place of birth - Native, outside of US (%) - Black or African American
Place of birth - Native, outside of US (%) - Asian
Place of birth - Native, outside of US (%) - Hispanic or Latino
Place of birth - Native, outside of US (%) - American Indian and Alaska Native
Place of birth - Native, outside of US (%) - Multirace
Place of birth - Native, outside of US (%) - Other Race
Place of birth - Foreign born (%)
Place of birth - Foreign born (%) - White
Place of birth - Foreign born (%) - Black or African American
Place of birth - Foreign born (%) - Asian
Place of birth - Foreign born (%) - Hispanic or Latino
Place of birth - Foreign born (%) - American Indian and Alaska Native
Place of birth - Foreign born (%) - Multirace
Place of birth - Foreign born (%) - Other Race
Residents speaking English at home (%)
Residents speaking English at home - Born in the United States (%)
Residents speaking English at home - Native, born elsewhere (%)
Residents speaking English at home - Foreign born (%)
Residents speaking Spanish at home (%)
Residents speaking Spanish at home - Born in the United States (%)
Residents speaking Spanish at home - Native, born elsewhere (%)
Residents speaking Spanish at home - Foreign born (%)
Residents speaking other language at home (%)
Residents speaking other language at home - Born in the United States (%)
Residents speaking other language at home - Native, born elsewhere (%)
Residents speaking other language at home - Foreign born (%)
Marital status - Never married (%)
Marital status - Now married (%)
Marital status - Separated (%)
Marital status - Widowed (%)
Marital status - Divorced (%)
Ancestries Reported - Arab (%)
Ancestries Reported - Czech (%)
Ancestries Reported - Danish (%)
Ancestries Reported - Dutch (%)
Ancestries Reported - English (%)
Ancestries Reported - French (%)
Ancestries Reported - French Canadian (%)
Ancestries Reported - German (%)
Ancestries Reported - Greek (%)
Ancestries Reported - Hungarian (%)
Ancestries Reported - Irish (%)
Ancestries Reported - Italian (%)
Ancestries Reported - Lithuanian (%)
Ancestries Reported - Norwegian (%)
Ancestries Reported - Polish (%)
Ancestries Reported - Portuguese (%)
Ancestries Reported - Russian (%)
Ancestries Reported - Scotch-Irish (%)
Ancestries Reported - Scottish (%)
Ancestries Reported - Slovak (%)
Ancestries Reported - Subsaharan African (%)
Ancestries Reported - Swedish (%)
Ancestries Reported - Swiss (%)
Ancestries Reported - Ukrainian (%)
Ancestries Reported - United States (%)
Ancestries Reported - Welsh (%)
Ancestries Reported - West Indian (%)
Ancestries Reported - Other (%)
Geographical mobility - Same house 1 year ago (%)
Geographical mobility - Same house 1 year ago (%) - White
Geographical mobility - Same house 1 year ago (%) - Black or African American
Geographical mobility - Same house 1 year ago (%) - Asian
Geographical mobility - Same house 1 year ago (%) - Hispanic or Latino
Geographical mobility - Same house 1 year ago (%) - American Indian and Alaska Native
Geographical mobility - Same house 1 year ago (%) - Multirace
Geographical mobility - Same house 1 year ago (%) - Other Race
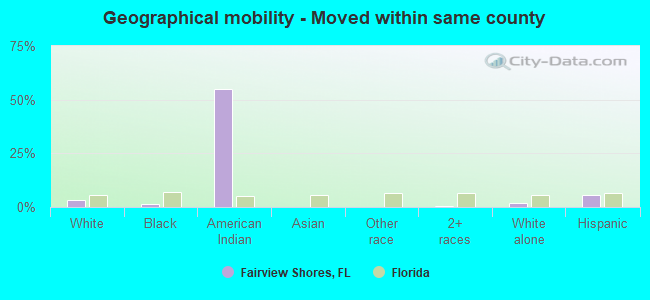
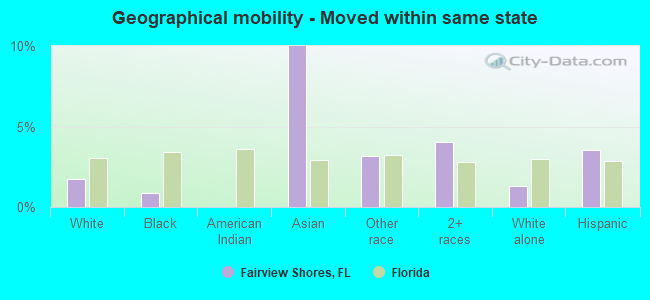
Geographical mobility - Moved within same county (%)
Geographical mobility - Moved within same county (%) - White
Geographical mobility - Moved within same county (%) - Black or African American
Geographical mobility - Moved within same county (%) - Asian
Geographical mobility - Moved within same county (%) - Hispanic or Latino
Geographical mobility - Moved within same county (%) - American Indian and Alaska Native
Geographical mobility - Moved within same county (%) - Multirace
Geographical mobility - Moved within same county (%) - Other Race
Geographical mobility - Moved from different county within same state (%)
Geographical mobility - Moved from different county within same state (%) - White
Geographical mobility - Moved from different county within same state (%) - Black or African American
Geographical mobility - Moved from different county within same state (%) - Asian
Geographical mobility - Moved from different county within same state (%) - Hispanic or Latino
Geographical mobility - Moved from different county within same state (%) - American Indian and Alaska Native
Geographical mobility - Moved from different county within same state (%) - Multirace
Geographical mobility - Moved from different county within same state (%) - Other Race
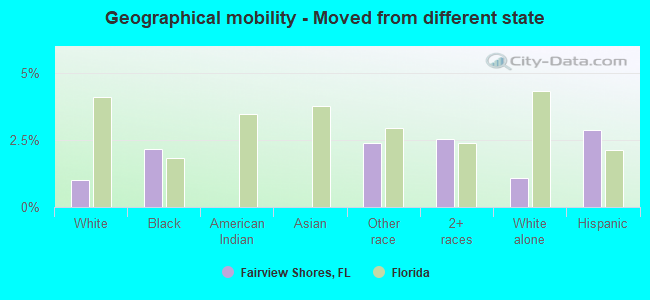
Geographical mobility - Moved from different state (%)
Geographical mobility - Moved from different state (%) - White
Geographical mobility - Moved from different state (%) - Black or African American
Geographical mobility - Moved from different state (%) - Asian
Geographical mobility - Moved from different state (%) - Hispanic or Latino
Geographical mobility - Moved from different state (%) - American Indian and Alaska Native
Geographical mobility - Moved from different state (%) - Multirace
Geographical mobility - Moved from different state (%) - Other Race
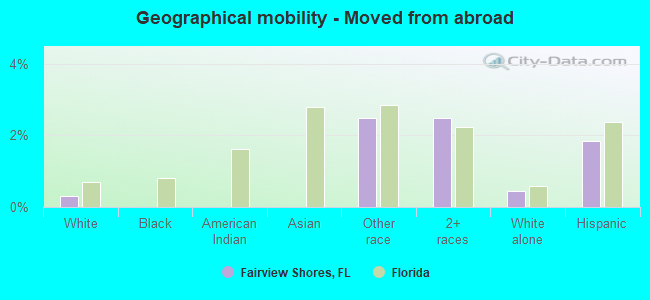
Geographical mobility - Moved from abroad (%)
Geographical mobility - Moved from abroad (%) - White
Geographical mobility - Moved from abroad (%) - Black or African American
Geographical mobility - Moved from abroad (%) - Asian
Geographical mobility - Moved from abroad (%) - Hispanic or Latino
Geographical mobility - Moved from abroad (%) - American Indian and Alaska Native
Geographical mobility - Moved from abroad (%) - Multirace
Geographical mobility - Moved from abroad (%) - Other Race
Place of birth for the foreign-born population - Ireland (%)
Place of birth for the foreign-born population - Denmark (%)
Place of birth for the foreign-born population - Norway (%)
Place of birth for the foreign-born population - Sweden (%)
Place of birth for the foreign-born population - United Kingdom (%)
Place of birth for the foreign-born population - England (%)
Place of birth for the foreign-born population - Scotland (%)
Place of birth for the foreign-born population - Other Northern Europe (%)
Place of birth for the foreign-born population - Austria (%)
Place of birth for the foreign-born population - Belgium (%)
Place of birth for the foreign-born population - France (%)
Place of birth for the foreign-born population - Germany (%)
Place of birth for the foreign-born population - Netherlands (%)
Place of birth for the foreign-born population - Switzerland (%)
Place of birth for the foreign-born population - Other Western Europe (%)
Place of birth for the foreign-born population - Greece (%)
Place of birth for the foreign-born population - Italy (%)
Place of birth for the foreign-born population - Portugal (%)
Place of birth for the foreign-born population - Spain (%)
Place of birth for the foreign-born population - Other Southern Europe (%)
Place of birth for the foreign-born population - Albania (%)
Place of birth for the foreign-born population - Belarus (%)
Place of birth for the foreign-born population - Bosnia and Herzegovina (%)
Place of birth for the foreign-born population - Bulgaria (%)
Place of birth for the foreign-born population - Croatia (%)
Place of birth for the foreign-born population - Czechoslovakia (%)
Place of birth for the foreign-born population - Hungary (%)
Place of birth for the foreign-born population - Latvia (%)
Place of birth for the foreign-born population - Lithuania (%)
Place of birth for the foreign-born population - North Macedonia (Macedonia) (%)
Place of birth for the foreign-born population - Moldova (%)
Place of birth for the foreign-born population - Poland (%)
Place of birth for the foreign-born population - Romania (%)
Place of birth for the foreign-born population - Russia (%)
Place of birth for the foreign-born population - Serbia (%)
Place of birth for the foreign-born population - Ukraine (%)
Place of birth for the foreign-born population - Other Eastern Europe (%)
Place of birth for the foreign-born population - China (%)
Place of birth for the foreign-born population - Hong Kong (%)
Place of birth for the foreign-born population - Taiwan (%)
Place of birth for the foreign-born population - Japan (%)
Place of birth for the foreign-born population - Korea (%)
Place of birth for the foreign-born population - Other Eastern Asia (%)
Place of birth for the foreign-born population - Afghanistan (%)
Place of birth for the foreign-born population - Bangladesh (%)
Place of birth for the foreign-born population - India (%)
Place of birth for the foreign-born population - Iran (%)
Place of birth for the foreign-born population - Kazakhstan (%)
Place of birth for the foreign-born population - Nepal (%)
Place of birth for the foreign-born population - Pakistan (%)
Place of birth for the foreign-born population - Sri Lanka (%)
Place of birth for the foreign-born population - Uzbekistan (%)
Place of birth for the foreign-born population - Other South Central Asia (%)
Place of birth for the foreign-born population - Burma (%)
Place of birth for the foreign-born population - Cambodia (%)
Place of birth for the foreign-born population - Indonesia (%)
Place of birth for the foreign-born population - Laos (%)
Place of birth for the foreign-born population - Malaysia (%)
Place of birth for the foreign-born population - Philippines (%)
Place of birth for the foreign-born population - Singapore (%)
Place of birth for the foreign-born population - Thailand (%)
Place of birth for the foreign-born population - Vietnam (%)
Place of birth for the foreign-born population - Other South Eastern Asia (%)
Place of birth for the foreign-born population - Armenia (%)
Place of birth for the foreign-born population - Iraq (%)
Place of birth for the foreign-born population - Israel (%)
Place of birth for the foreign-born population - Jordan (%)
Place of birth for the foreign-born population - Kuwait (%)
Place of birth for the foreign-born population - Lebanon (%)
Place of birth for the foreign-born population - Saudi Arabia (%)
Place of birth for the foreign-born population - Syria (%)
Place of birth for the foreign-born population - Turkey (%)
Place of birth for the foreign-born population - Yemen (%)
Place of birth for the foreign-born population - Other Western Asia (%)
Place of birth for the foreign-born population - Eritrea (%)
Place of birth for the foreign-born population - Ethiopia (%)
Place of birth for the foreign-born population - Kenya (%)
Place of birth for the foreign-born population - Somalia (%)
Place of birth for the foreign-born population - Uganda (%)
Place of birth for the foreign-born population - Zimbabwe (%)
Place of birth for the foreign-born population - Other Eastern Africa (%)
Place of birth for the foreign-born population - Cameroon (%)
Place of birth for the foreign-born population - Congo (%)
Place of birth for the foreign-born population - Democratic Republic of Congo (Zaire) (%)
Place of birth for the foreign-born population - Other Middle Africa (%)
Place of birth for the foreign-born population - Egypt (%)
Place of birth for the foreign-born population - Morocco (%)
Place of birth for the foreign-born population - Sudan (%)
Place of birth for the foreign-born population - Other Northern Africa (%)
Place of birth for the foreign-born population - South Africa (%)
Place of birth for the foreign-born population - Other Southern Africa (%)
Place of birth for the foreign-born population - Cabo Verde (%)
Place of birth for the foreign-born population - Ghana (%)
Place of birth for the foreign-born population - Liberia (%)
Place of birth for the foreign-born population - Nigeria (%)
Place of birth for the foreign-born population - Senegal (%)
Place of birth for the foreign-born population - Sierra Leone (%)
Place of birth for the foreign-born population - Other Western Africa (%)
Place of birth for the foreign-born population - Australia (%)
Place of birth for the foreign-born population - New Zealand (%)
Place of birth for the foreign-born population - Fiji (%)
Place of birth for the foreign-born population - Micronesia (%)
Place of birth for the foreign-born population - Bahamas (%)
Place of birth for the foreign-born population - Barbados (%)
Place of birth for the foreign-born population - Cuba (%)
Place of birth for the foreign-born population - Dominica (%)
Place of birth for the foreign-born population - Dominican Republic (%)
Place of birth for the foreign-born population - Grenada (%)
Place of birth for the foreign-born population - Haiti (%)
Place of birth for the foreign-born population - Jamaica (%)
Place of birth for the foreign-born population - St. Vincent and the Grenadines (%)
Place of birth for the foreign-born population - Trinidad and Tobago (%)
Place of birth for the foreign-born population - West Indies (%)
Place of birth for the foreign-born population - Other Caribbean (%)
Place of birth for the foreign-born population - Belize (%)
Place of birth for the foreign-born population - Costa Rica (%)
Place of birth for the foreign-born population - El Salvador (%)
Place of birth for the foreign-born population - Guatemala (%)
Place of birth for the foreign-born population - Honduras (%)
Place of birth for the foreign-born population - Mexico (%)
Place of birth for the foreign-born population - Nicaragua (%)
Place of birth for the foreign-born population - Panama (%)
Place of birth for the foreign-born population - Other Central America (%)
Place of birth for the foreign-born population - Argentina (%)
Place of birth for the foreign-born population - Bolivia (%)
Place of birth for the foreign-born population - Brazil (%)
Place of birth for the foreign-born population - Chile (%)
Place of birth for the foreign-born population - Colombia (%)
Place of birth for the foreign-born population - Ecuador (%)
Place of birth for the foreign-born population - Guyana (%)
Place of birth for the foreign-born population - Peru (%)
Place of birth for the foreign-born population - Uruguay (%)
Place of birth for the foreign-born population - Venezuela (%)
Place of birth for the foreign-born population - Other South America (%)
Place of birth for the foreign-born population - Canada (%)
Place of birth for the foreign-born population - Other Northern America (%)
Place of birth for the foreign-born population - Other (%)
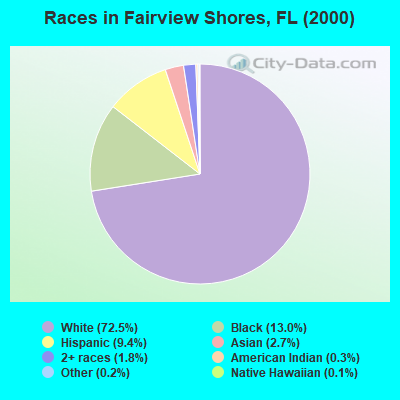
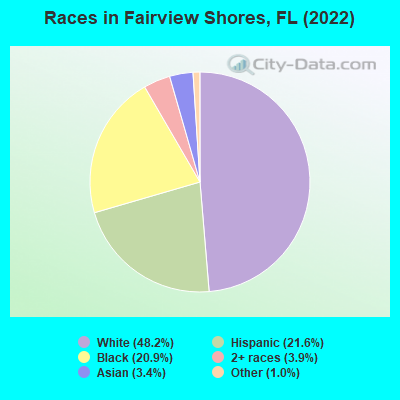
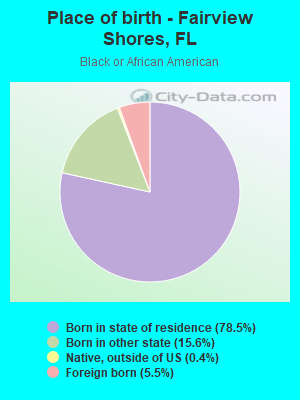
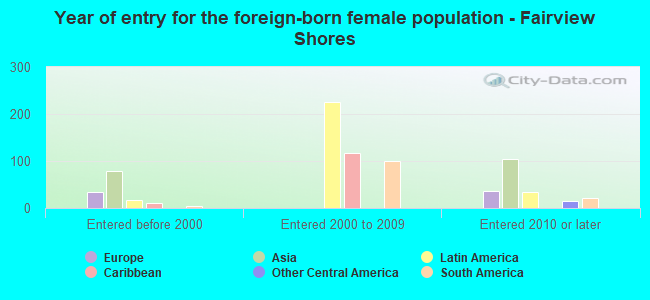
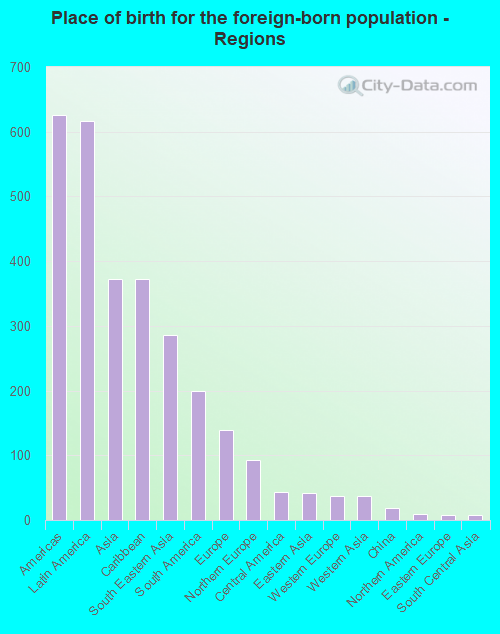
According to 2022 data, the most numerous races in Fairview Shores, FL are White alone (5,397 residents), Hispanic (2,416 residents), and Black alone (2,346 residents). 79.3% of Fairview Shores residents speak English at home. 10.2% of Fairview Shores, FL residents are foreign-born (5.3% born in Latin America, 3.2% born in Asia, 1.2% born in Europe), which is 106.6% less than the foreign-born rate of 21.0% across the entire state of Florida.
Race distribution in Fairview Shores
2000 2022
10,458,509 65.4% White alone 2,682,715 16.8% Hispanic 2,264,268 14.2% Black alone 261,693 1.6% Asian alone 236,954 1.5% Two or more races 42,358 0.3% American Indian alone 28,994 0.2% Other race alone 6,887 0.04% Native Hawaiian and Other
11,309,403 50.8% White alone 6,025,039 27.1% Hispanic 3,241,015 14.6% Black alone 861,630 3.9% Two or more races 623,692 2.8% Asian alone 152,054 0.7% Other race alone 22,504 0.1% American Indian alone 9,486 0.04% Native Hawaiian and Other
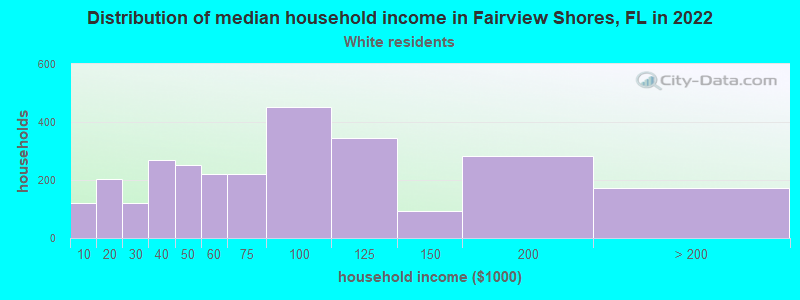
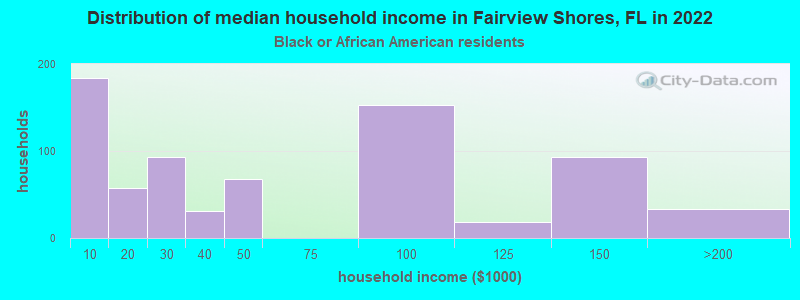
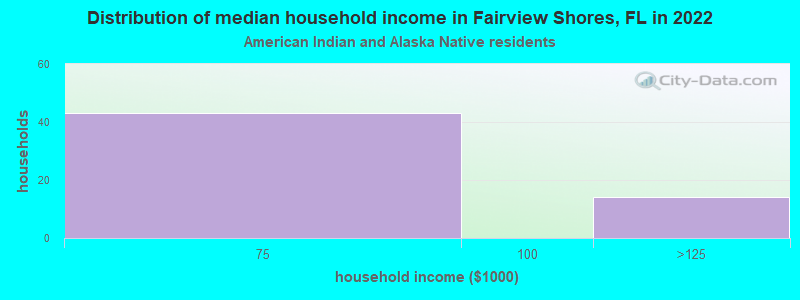
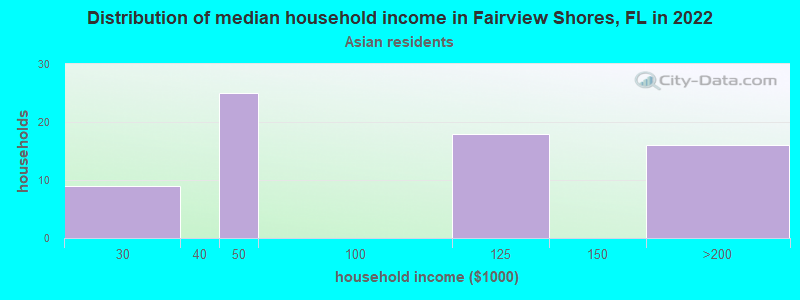
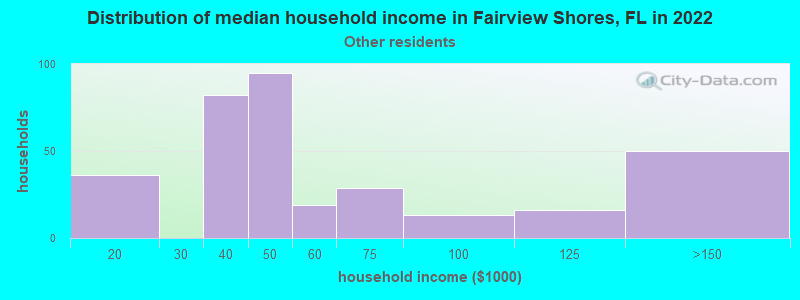
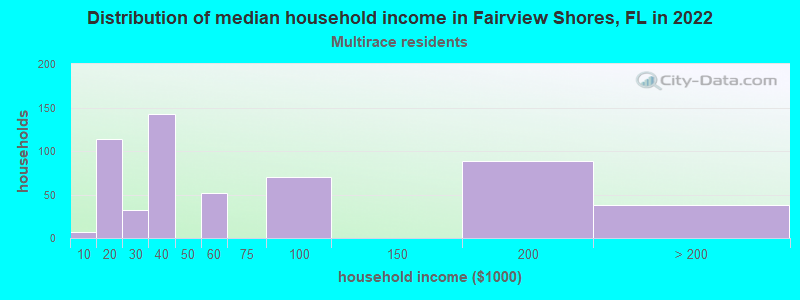
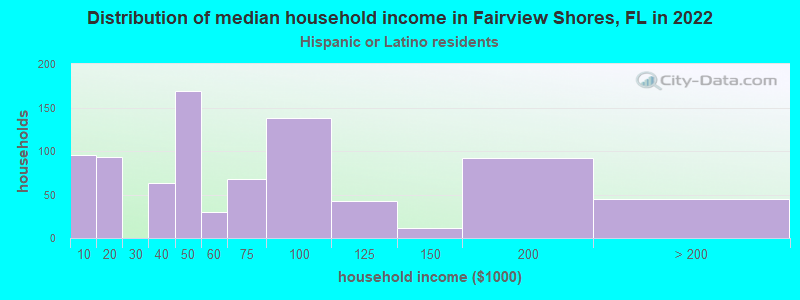
Income and house value in Fairview Shores Median household income in 2022 $66,672 White non-Hispanic householders$46,421 Some other race householders$39,448 Two or more races householders$51,088 Hispanic or Latino race householdersMedian 2022 house value $341,097 White Non-Hispanic householders$320,267 Black or African American householders $312,456 Asian householders$252,568 Some other race householders$329,566 Two or more races householders$333,658 Hispanic or Latino householders
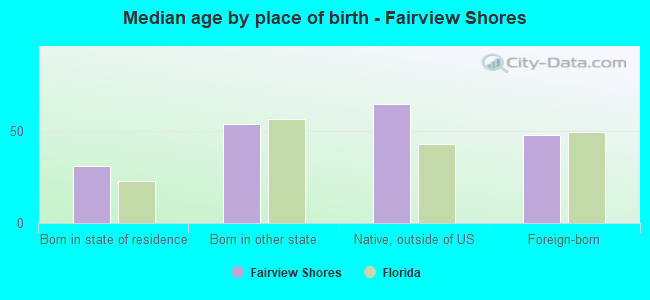
Median age by race in Fairview Shores
52.4 Median age for White residents50.5 54.5 35.5 Median age for Black or African American residents26.8 36.1 -614,300,100.1 Median age for American Indian / Alaska Native residents-735,632,183.2 -529,680,364.8 43.1 Median age for Asian residents39.6 44.1 -679,790,025.6 Median age for Native Hawaiian / Pacific Islander residents-1,327,635,326.3 -611,111,110.5 29.4 Median age for Other race residents28.7 30.0 28.5 Median age for Two or more races residents16.3 33.7 53.8 Median age for White alone residents49.6 57.0 31.2 Median age for Hispanic or Latino residents27.2 32.6
Owner/renter occupied households by race in Fairview Shores
House owners and renters - White residents 1,932 69.2% Owner occupied858 30.8% Renter occupiedHouse owners and renters - Black or African American residents 75 9.1% Owner occupied752 90.9% Renter occupiedHouse owners and renters - American Indian / Alaska Native residents 15 28.5% Owner occupied37 71.5% Renter occupiedHouse owners and renters - Asian residents 22 31.0% Owner occupied48 69.0% Renter occupiedHouse owners and renters - Other race residents 48 14.7% Owner occupied278 85.3% Renter occupiedHouse owners and renters - Two or more races residents 190 35.6% Owner occupied343 64.4% Renter occupiedHouse owners and renters - White alone residents 2,085 73.2% Owner occupied762 26.8% Renter occupiedHouse owners and renters - Hispanic or Latino residents 171 20.9% Owner occupied650 79.1% Renter occupied
Language usage in Fairview Shores
English speakers - Total 79.3% of residents of Fairview Shores speak English at home.
14.0% of residents speak Spanish at home 1,095 74.5% Speak English very well375 25.5% Speak English less than very well6.6% of residents speak other language at home 389 55.9% Speak English very well307 44.1% Speak English less than very well
English speakers - Born in the United States 91.0% of residents of Fairview Shores speak English at home.
7.9% of residents speak Spanish at home 325 100.0% Speak English very well0.9% of residents speak other language at home 38 100.0% Speak English very well
English speakers - Native, born elsewhere 20.7% of residents of Fairview Shores speak English at home.
79.3% of residents speak Spanish at home 225 68.4% Speak English very well104 31.6% Speak English less than very well
English speakers - Foreign-born 13.5% of residents of Fairview Shores speak English at home.
40.4% of residents speak Spanish at home 223 47.6% Speak English very well245 52.4% Speak English less than very well46.0% of residents speak other language at home 239 44.8% Speak English very well294 55.2% Speak English less than very well
White (Caucasian) - Speak only English Native:
100.0% (4,812)Foreign-born:
6.1% (18)
White (Caucasian) - Speak another language Native:
4.3% (208)Foreign-born:
91.2% (273)
Black or African American - Speak only English Native:
95.4% (2,163)Foreign-born:
10.3% (14)
Black or African American - Speak another language Native:
3.7% (83)Foreign-born:
84.7% (114)
Asian - Speak only English Native:
100.0% (40)Foreign-born:
36.7% (125)
Other race - Speak another language Native:
34.2% (172)Foreign-born:
100.0% (81)
Two or more races - Speak another language Native:
56.6% (763)Foreign-born:
100.0% (109)
White alone - Speak only English Native:
96.7% (4,782)Foreign-born:
7.2% (13)
White alone - Speak another language Native:
3.4% (168)Foreign-born:
97.9% (182)
Hispanic or Latino - Speak only English Native:
52.1% (886)Foreign-born:
1.9% (9)
Hispanic or Latino - Speak another language Native:
51.0% (867)Foreign-born:
98.5% (469)
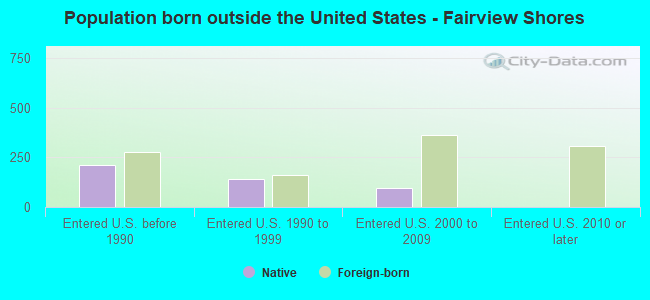
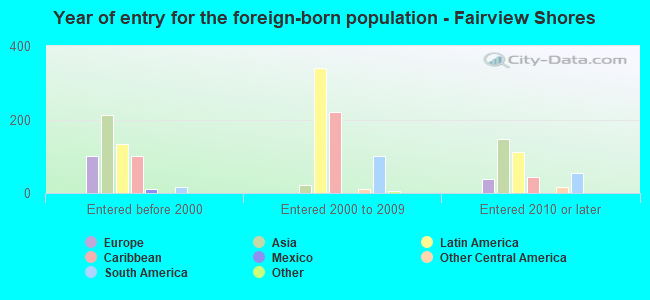
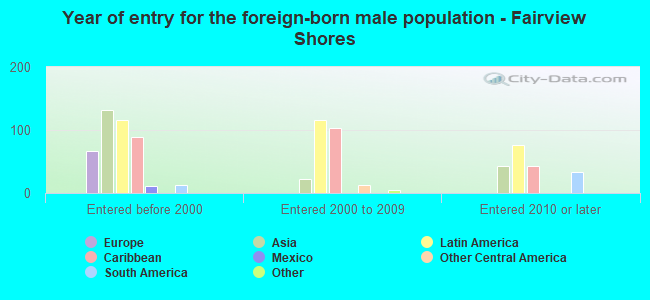
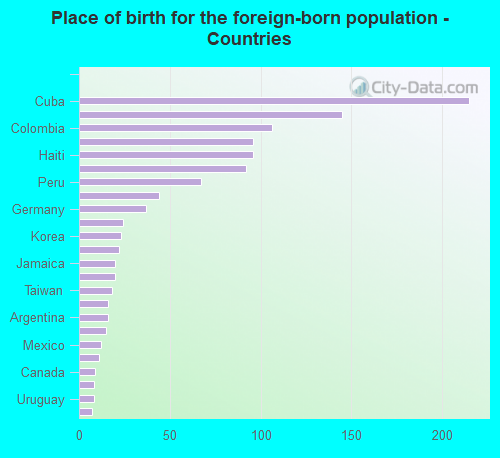
Foreign-born residents in Fairview Shores 1,139 residents are foreign born (5.3% Latin America , 3.2% Asia , 1.2% Europe ).
This city:
10.2%Florida:
21.1%
Marital status for residents in Fairview Shores Marital status - White (Caucasian) population 15 years and over
Males 38.1% Never married41.6% Now married0.1% Separated6.7% Widowed13.5% DivorcedFemales 26.7% Never married49.6% Now married1.7% Separated8.5% Widowed13.4% DivorcedWomen who gave birth in the past 12 months Now married:
100.0% (40)Unmarried:
0.0% (0)
Women who did not give birth in the past 12 months Now married:
43.2% (390)Unmarried:
56.8% (512)
Marital status - Black or African American population 15 years and over
Males 54.9% Never married37.8% Now married0.0% Separated0.0% Widowed7.2% DivorcedFemales 62.2% Never married10.8% Now married1.6% Separated11.1% Widowed14.4% DivorcedWomen who gave birth in the past 12 months Now married:
0.0% (0)Unmarried:
100.0% (83)
Women who did not give birth in the past 12 months Now married:
13.3% (118)Unmarried:
86.7% (772)
Marital status - Asian population 15 years and over
Males 33.8% Never married41.8% Now married0.0% Separated0.0% Widowed24.4% DivorcedFemales 26.2% Never married73.8% Now married0.0% Separated0.0% Widowed0.0% DivorcedWomen who did not give birth in the past 12 months Now married:
57.0% (46)Unmarried:
43.0% (34)
Marital status - Other race population 15 years and over
Males 47.2% Never married32.9% Now married0.0% Separated12.4% Widowed7.5% DivorcedFemales 22.3% Never married48.4% Now married29.3% Separated0.0% Widowed0.0% DivorcedWomen who gave birth in the past 12 months Now married:
100.0% (36)Unmarried:
0.0% (0)
Women who did not give birth in the past 12 months Now married:
62.2% (70)Unmarried:
37.8% (43)
Marital status - Two or more races population 15 years and over
Males 50.7% Never married46.9% Now married2.4% Separated0.0% Widowed0.0% DivorcedFemales 31.5% Never married38.1% Now married13.2% Separated11.3% Widowed5.9% DivorcedWomen who did not give birth in the past 12 months Now married:
46.3% (178)Unmarried:
53.7% (206)
Marital status - White alone, not Hispanic / Latino population 15 years and over
Males 38.7% Never married42.1% Now married0.1% Separated5.7% Widowed13.5% DivorcedFemales 28.1% Never married47.8% Now married0.9% Separated9.9% Widowed13.2% DivorcedWomen who gave birth in the past 12 months Now married:
100.0% (38)Unmarried:
0.0% (0)
Women who did not give birth in the past 12 months Now married:
38.2% (341)Unmarried:
61.8% (551)
Marital status - Hispanic or Latino population 15 years and over
Males 41.6% Never married41.4% Now married0.0% Separated9.6% Widowed7.4% DivorcedFemales 26.1% Never married53.3% Now married9.0% Separated4.4% Widowed7.1% DivorcedWomen who gave birth in the past 12 months Now married:
100.0% (36)Unmarried:
0.0% (0)
Women who did not give birth in the past 12 months Now married:
60.8% (308)Unmarried:
39.2% (198)
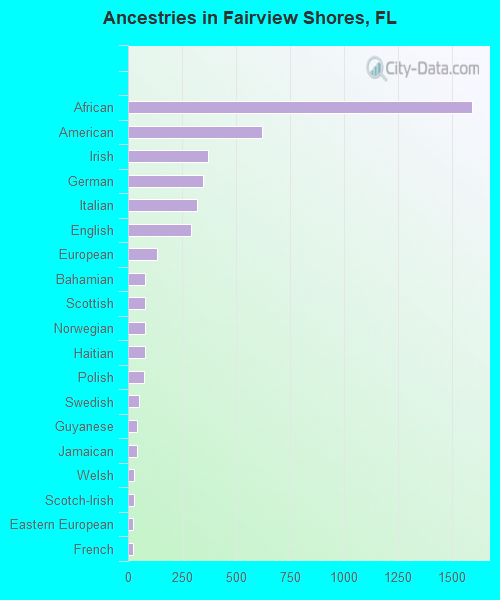
Ancestries in Fairview Shores
1,594 24.6% African621 9.6% American370 5.7% Irish347 5.4% German320 4.9% Italian290 4.5% English136 2.1% European81 1.2% Bahamian79 1.2% Scottish77 1.2% Norwegian77 1.2% Haitian74 1.1% Polish51 0.8% Swedish44 0.7% Guyanese41 0.6% Jamaican27 0.4% Welsh26 0.4% Scotch-Irish22 0.3% Eastern European21 0.3% French10 0.2% Hungarian9 0.1% Czechoslovakian8 0.1% Egyptian5 0.08% Syrian4 0.06% Dutch3 0.05% British
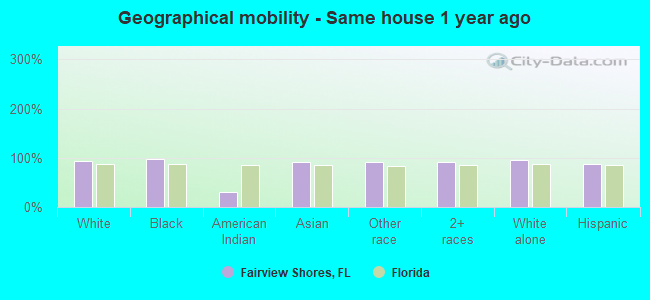
Geographical mobility in Fairview Shores Same house 1 year ago 4,890 94.0% White (Caucasian)2,368 97.8% Black or African American16 29.5% American Indian / Alaska Native349 91.2% Asian648 91.6% Other race1,785 91.9% Two or more races5,149 96.1% White alone, not Hispanic / Latino2,079 86.6% Hispanic or LatinoMoved within same county 158 3.0% White / Caucasian38 1.6% Black or African American30 55.2% American Indian / Alaska Native12 0.6% Two or more races90 1.7% White alone, not Hispanic / Latino129 5.4% Hispanic or LatinoMoved within same state 90 1.7% White / Caucasian20 0.8% Black or African American38 10.0% Asian22 3.2% Other race78 4.0% Two or more races71 1.3% White alone, not Hispanic / Latino85 3.5% Hispanic or LatinoMoved from different state 53 1.0% White / Caucasian53 2.2% Black or African American17 2.4% Other race49 2.5% Two or more races58 1.1% White alone, not Hispanic / Latino69 2.9% Hispanic or LatinoMoved from abroad 15 0.3% White18 2.5% Other race48 2.5% Two or more races24 0.4% White alone, not Hispanic / Latino44 1.8% Hispanic or Latino
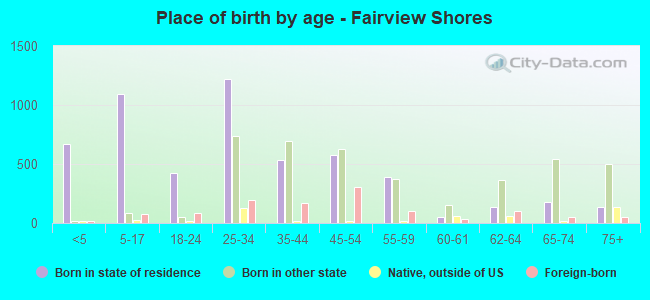
Children Nativity (place of birth) in Fairview Shores
Children under 6 years - Living with two parents Both parents native 505 100.0% NativeOne native, one foreign-born parent 60 100.0% NativeChildren under 6 years - Living with one parent Native parent 111 100.0% NativeForeign-born parent 7 100.0% NativeChildren 6 to 17 years - Living with two parents Both parents native 605 100.0% Native0 0.0% Foreign-bornBoth parents foreign-born 60 63.7% Native34 36.3% Foreign-bornOne native, one foreign-born parent 56 100.0% NativeChildren 6 to 17 years - Living with one parent Native parent 347 100.0% NativeForeign-born parent 31 49.1% Native32 50.9% Foreign-born
Grandparents responsible for own grandchildren in Fairview Shores
Grandparents (30 to 59 years) White / Caucasian 23 100.0% Not responsible for grandchildrenBlack or African American 81 100.0% Not responsible for grandchildrenWhite alone, not Hispanic / Latino 28 100.0% Not responsible for grandchildrenHispanic or Latino 6 100.0% Not responsible for grandchildrenGrandparents (60 years and over) White / Caucasian 12 23.2% Responsible for grandchildren38 76.8% Not responsible for grandchildrenBlack or African American 14 100.0% Not responsible for grandchildrenWhite alone, not Hispanic / Latino 17 24.3% Responsible for grandchildren52 75.7% Not responsible for grandchildren