Races in Fairview, Texas (TX) Detailed Stats
Ancestries, Foreign-born residents, place of birth
Settings
X


Recent posts about races in Fairview, Texas on our local forum with over 2,400,000 registered users:
 | House in Stonebriar CC-Thoughts? (15 replies) |
| buy house in McKinney, Allen, Plano (12 replies) |
| will prosper become the next southlake or park cities? (61 replies) |
| Family of 6 relocating to Dallas - Need Guidance (64 replies) |
| Richardson vs Prosper (25 replies) |
| Golf Course Communities/Country Club Developments (18 replies) |
Latest news about races in Fairview, TX collected exclusively by city-data.com from local newspapers, TV, and radio stations
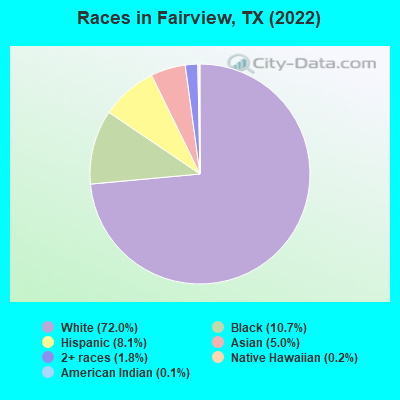
According to 2022 data, the most numerous races in Fairview, TX are Hispanic (899 residents), White alone (8,001 residents), and Black alone (1,193 residents). 88.9% of Fairview residents speak English at home. 11.3% of Fairview, TX residents are foreign-born (4.0% born in Asia, 3.2% born in Latin America, 2.2% born in Africa, 1.9% born in Europe), which is 50.2% less than the foreign-born rate of 17.0% across the entire state of Texas.
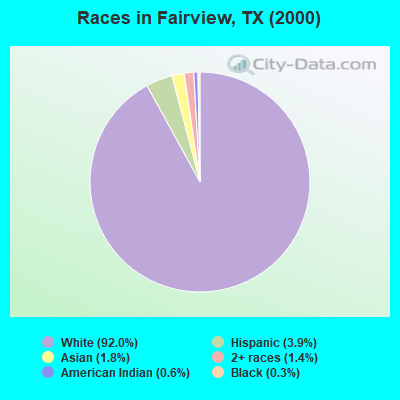
Race distribution in Fairview
2000
2022

- 2,43392.0%White alone
- 1033.9%Hispanic
- 481.8%Asian alone
- 371.4%Two or more races
- 160.6%American Indian alone
- 70.3%Black alone
-
- 8,00172.0%White alone
- 1,19310.7%Black alone
- 8998.1%Hispanic
- 5535.0%Asian alone
- 1991.8%Two or more races
- 230.2%Native Hawaiian and Other
Pacific Islander alone - 120.1%American Indian alone
2000
2022
-
- 10,933,31352.4%White alone
- 6,669,66632.0%Hispanic
- 2,364,25511.3%Black alone
- 554,4452.7%Asian alone
- 230,5671.1%Two or more races
- 68,8590.3%American Indian alone
- 19,9580.10%Other race alone
- 10,7570.05%Native Hawaiian and Other
Pacific Islander alone

-
- 12,070,64240.2%Hispanic
- 11,683,43038.9%White alone
- 3,508,70611.7%Black alone
- 1,608,1735.4%Asian alone
- 956,5603.2%Two or more races
- 125,7630.4%Other race alone
- 47,0230.2%American Indian alone
- 29,2750.10%Native Hawaiian and Other
Pacific Islander alone

Income and house value in Fairview
- Median household income in 2022
- $118,451White non-Hispanic householders
- $49,710Black householders
- $89,542Asian householders
- $105,775Two or more races householders
- $138,169Hispanic or Latino race householders
- Median 2022 house value
- $597,282White Non-Hispanic householders
- $263,478Black or African American householders
- $670,673Asian householders
- $431,147Two or more races householders
- $598,815Hispanic or Latino householders
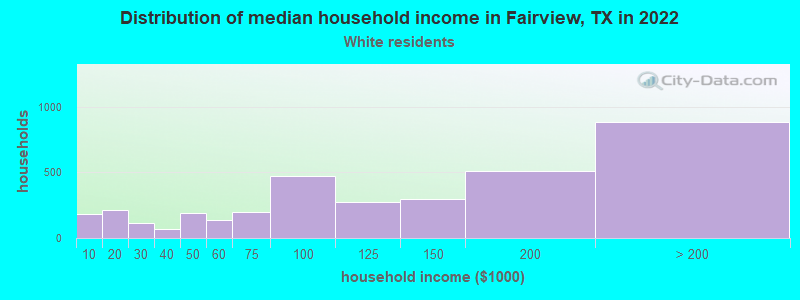
Household income for White non-Hispanic householders
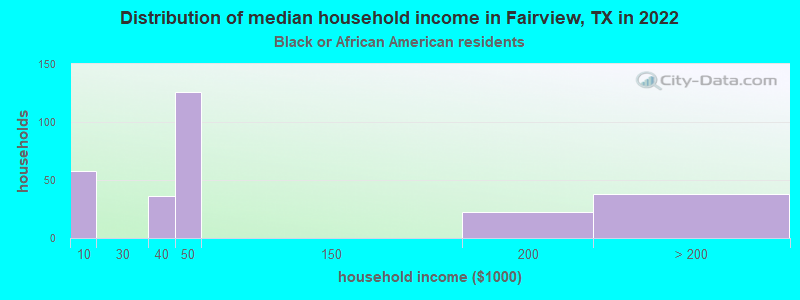
Household income for Black householders
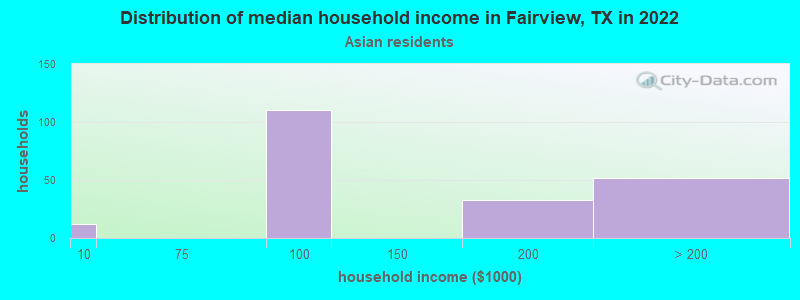
Household income for Asian householders
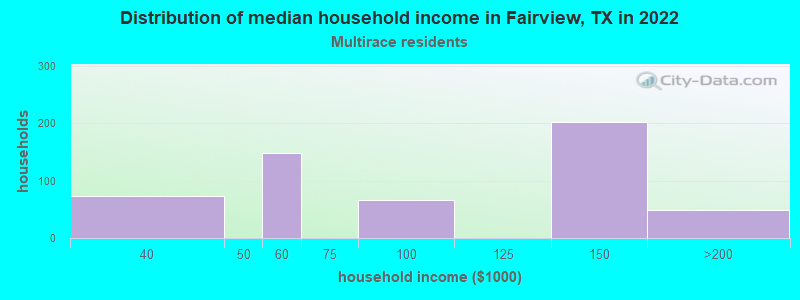
Household income for Two or more races householders
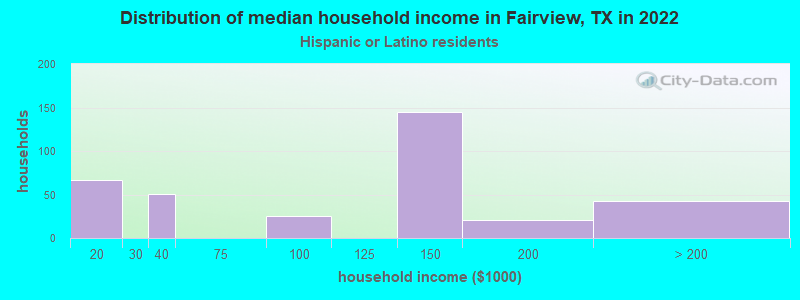
Household income for Hispanic or Latino race householders
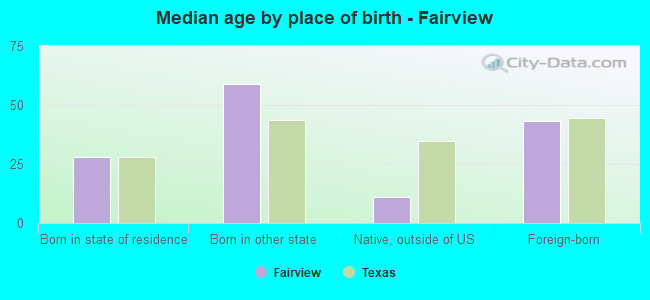
Median age by race in Fairview
- 59.9Median age for White residents
- 60.4Males
- 59.2Females
- 13.7Median age for Black or African American residents
- 34.4Males
- 9.1Females
- -825,102,879.8Median age for American Indian / Alaska Native residents
- -724,137,930.3Males
- -737,899,542.6Females
- 48.6Median age for Asian residents
- 47.2Males
- 50.8Females
- -819,226,749.4Median age for Native Hawaiian / Pacific Islander residents
- -770,894,787.8Males
- -577,777,777.2Females
- -683,281,411.6Median age for Other race residents
- -691,903,259.0Males
- -670,769,230.1Females
- 44.3Median age for Two or more races residents
- 46.0Males
- 42.9Females
- 58.7Median age for White alone residents
- 59.3Males
- 58.1Females
- 41.7Median age for Hispanic or Latino residents
- 44.0Males
- 28.3Females
Owner/renter occupied households by race in Fairview
- House owners and renters - White residents
- 2,85078.9%Owner occupied
- 76321.1%Renter occupied
- House owners and renters - Black or African American residents
- 228.3%Owner occupied
- 24391.7%Renter occupied
- House owners and renters - Asian residents
- 11655.5%Owner occupied
- 9344.5%Renter occupied
- House owners and renters - Native Hawaiian / Pacific Islander residents
- 23100.0%Owner occupied
- House owners and renters - Other race residents
- 24100.0%Renter occupied
- House owners and renters - Two or more races residents
- 28061.0%Owner occupied
- 17939.0%Renter occupied
- House owners and renters - White alone residents
- 2,91980.5%Owner occupied
- 70919.5%Renter occupied
- House owners and renters - Hispanic or Latino residents
- 13141.0%Owner occupied
- 18959.0%Renter occupied
Language usage in Fairview
- English speakers - Total
- 88.9% of residents of Fairview speak English at home.
- 5.5% of residents speak Spanish at home
- 53391.6%Speak English very well
- 498.4%Speak English less than very well
- 5.2% of residents speak other language at home
- 37368.4%Speak English very well
- 17231.6%Speak English less than very well
- English speakers - Born in the United States
- 98.7% of residents of Fairview speak English at home.
- 0.1% of residents speak Spanish at home
- 6100.0%Speak English very well
- 1.1% of residents speak other language at home
- 49100.0%Speak English very well
- English speakers - Native, born elsewhere
- 88.6% of residents of Fairview speak English at home.
- 7.6% of residents speak other language at home
- 16100.0%Speak English very well
- English speakers - Foreign-born
- 36.4% of residents of Fairview speak English at home.
- 31.6% of residents speak Spanish at home
- 37588.9%Speak English very well
- 4711.1%Speak English less than very well
- 34.9% of residents speak other language at home
- 29663.4%Speak English very well
- 17136.6%Speak English less than very well
White (Caucasian) - Speak only English
| Native: | 99.9% (7,500) |
| Foreign-born: | 30.8% (73) |
White (Caucasian) - Speak another language
| Native: | 1.2% (88) |
| Foreign-born: | 70.5% (167) |
Black or African American - Speak only English
| Native: | 100.0% (632) |
| Foreign-born: | 77.1% (205) |
Asian - Speak only English
| Native: | 97.1% (87) |
| Foreign-born: | 24.6% (114) |
Two or more races - Speak only English
| Native: | 61.5% (363) |
| Foreign-born: | 18.4% (81) |
Two or more races - Speak another language
| Native: | 38.8% (229) |
| Foreign-born: | 81.2% (359) |
White alone - Speak only English
| Native: | 98.5% (7,491) |
| Foreign-born: | 37.1% (71) |
White alone - Speak another language
| Native: | 1.4% (108) |
| Foreign-born: | 61.9% (118) |
Hispanic or Latino - Speak only English
| Native: | 68.3% (332) |
| Foreign-born: | 5.5% (21) |
Hispanic or Latino - Speak another language
| Native: | 34.5% (168) |
| Foreign-born: | 94.5% (361) |
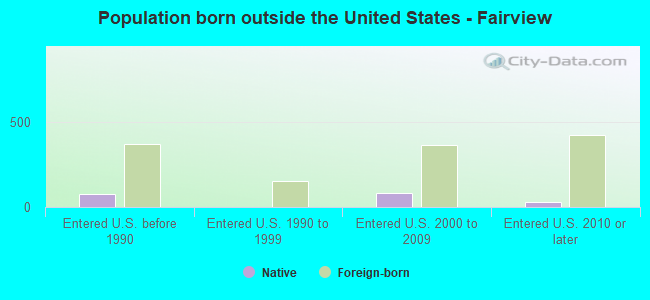
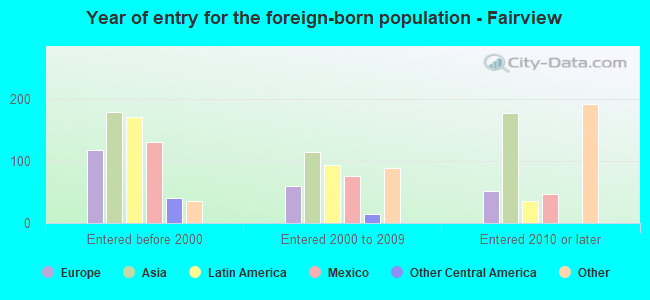
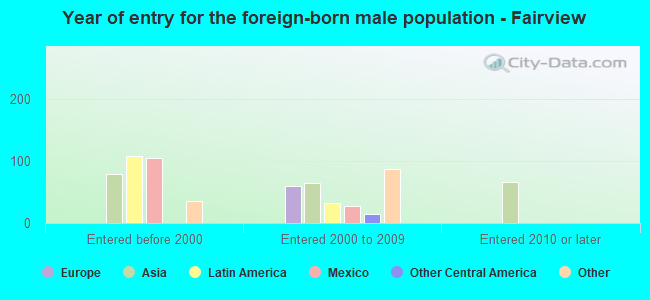
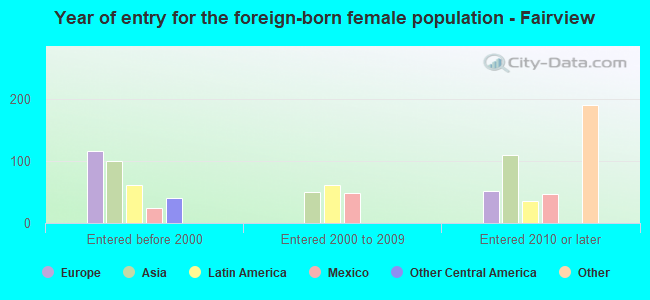
Foreign-born residents in Fairview
1,258 residents are foreign born (4.0% Asia, 3.2% Latin America, 2.2% Africa, 1.9% Europe).
| This city: | 11.3% |
| Texas: | 17.1% |
Marital status for residents in Fairview
Marital status - White (Caucasian) population 15 years and over
- Males
- 18.9%Never married
- 76.6%Now married
- 0.0%Separated
- 1.4%Widowed
- 3.0%Divorced
- Females
- 17.3%Never married
- 60.1%Now married
- 0.5%Separated
- 12.8%Widowed
- 9.4%Divorced
Women who gave birth in the past 12 months
| Now married: | 100.0% (15) |
| Unmarried: | 0.0% (0) |
Women who did not give birth in the past 12 months
| Now married: | 48.3% (611) |
| Unmarried: | 51.7% (654) |
Marital status - Black or African American population 15 years and over
- Males
- 0.0%Never married
- 100.0%Now married
- 0.0%Separated
- 0.0%Widowed
- 0.0%Divorced
- Females
- 32.2%Never married
- 54.6%Now married
- 0.0%Separated
- 0.0%Widowed
- 13.2%Divorced
Women who did not give birth in the past 12 months
| Now married: | 62.9% (132) |
| Unmarried: | 37.1% (78) |
Marital status - Asian population 15 years and over
- Males
- 13.3%Never married
- 63.9%Now married
- 0.0%Separated
- 0.0%Widowed
- 22.9%Divorced
- Females
- 14.7%Never married
- 63.4%Now married
- 0.0%Separated
- 15.4%Widowed
- 6.6%Divorced
Women who did not give birth in the past 12 months
| Now married: | 62.1% (111) |
| Unmarried: | 37.9% (68) |
Marital status - Two or more races population 15 years and over
- Males
- 45.2%Never married
- 54.8%Now married
- 0.0%Separated
- 0.0%Widowed
- 0.0%Divorced
- Females
- 0.0%Never married
- 79.4%Now married
- 0.0%Separated
- 11.6%Widowed
- 9.0%Divorced
Women who did not give birth in the past 12 months
| Now married: | 100.0% (241) |
| Unmarried: | 0.0% (0) |
Marital status - White alone, not Hispanic / Latino population 15 years and over
- Males
- 16.2%Never married
- 79.2%Now married
- 0.0%Separated
- 1.5%Widowed
- 3.1%Divorced
- Females
- 17.7%Never married
- 60.8%Now married
- 0.5%Separated
- 11.4%Widowed
- 9.6%Divorced
Women who gave birth in the past 12 months
| Now married: | 100.0% (15) |
| Unmarried: | 0.0% (0) |
Women who did not give birth in the past 12 months
| Now married: | 47.4% (611) |
| Unmarried: | 52.6% (678) |
Marital status - Hispanic or Latino population 15 years and over
- Males
- 45.4%Never married
- 54.6%Now married
- 0.0%Separated
- 0.0%Widowed
- 0.0%Divorced
- Females
- 0.0%Never married
- 63.0%Now married
- 0.0%Separated
- 37.0%Widowed
- 0.0%Divorced
Women who did not give birth in the past 12 months
| Now married: | 100.0% (169) |
| Unmarried: | 0.0% (0) |
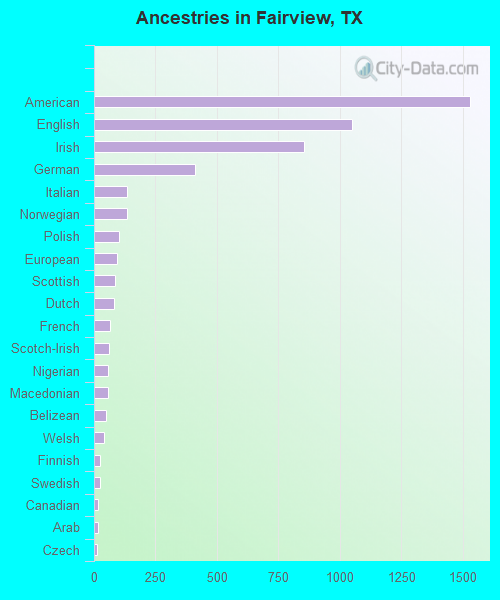
Ancestries in Fairview

- 1,53122.0%American
- 1,05115.1%English
- 85512.3%Irish
- 4115.9%German
- 1341.9%Italian
- 1331.9%Norwegian
- 1021.5%Polish
- 941.3%European
- 861.2%Scottish
- 831.2%Dutch
- 640.9%French
- 620.9%Scotch-Irish
- 590.8%Nigerian
- 580.8%Macedonian
- 480.7%Belizean
- 410.6%Welsh
- 260.4%Finnish
- 260.4%Swedish
- 170.2%Canadian
- 150.2%Arab
- 140.2%Czech
- 130.2%British
- 90.1%Croatian
- 70.1%Hungarian
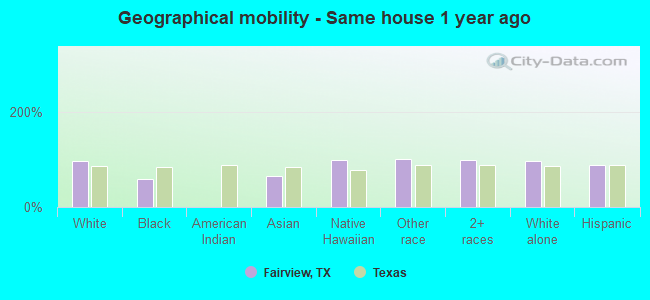
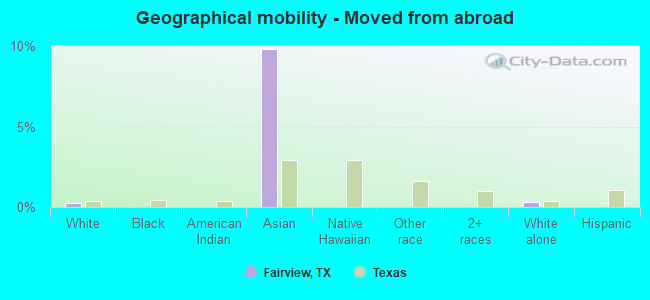
Geographical mobility in Fairview

- Same house 1 year ago
- 7,58296.9%White (Caucasian)
- 75257.8%Black or African American
- 35364.0%Asian
- 1998.2%Native Hawaiian / Pacific Islander
- 24100.0%Other race
- 97298.7%Two or more races
- 7,71596.9%White alone, not Hispanic / Latino
- 77787.2%Hispanic or Latino
-
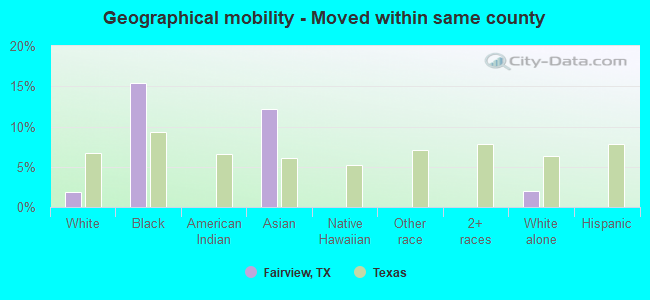
- Moved within same county
- 1431.8%White / Caucasian
- 20015.4%Black or African American
- 6712.1%Asian
- 1541.9%White alone, not Hispanic / Latino
-
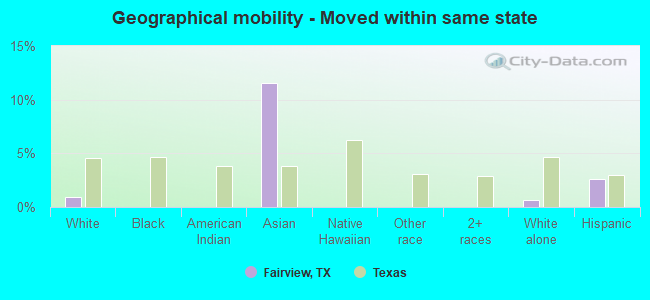
- Moved within same state
- 720.9%White / Caucasian
- 6411.5%Asian
- 520.7%White alone, not Hispanic / Latino
- 242.6%Hispanic or Latino
-
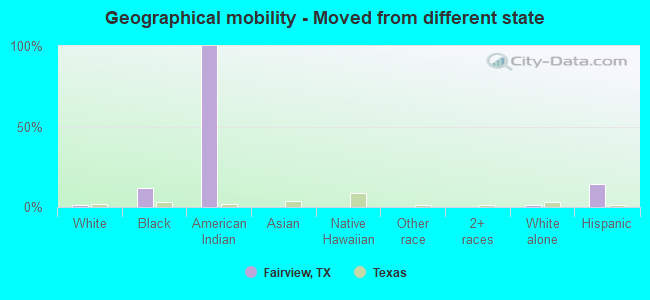
- Moved from different state
- 1141.5%White / Caucasian
- 15612.0%Black or African American
- 25100.0%American Indian / Alaska Native
- 1171.5%White alone, not Hispanic / Latino
- 12714.2%Hispanic or Latino
-
- Moved from abroad
- 190.2%White
- 549.8%Asian
- 240.3%White alone, not Hispanic / Latino
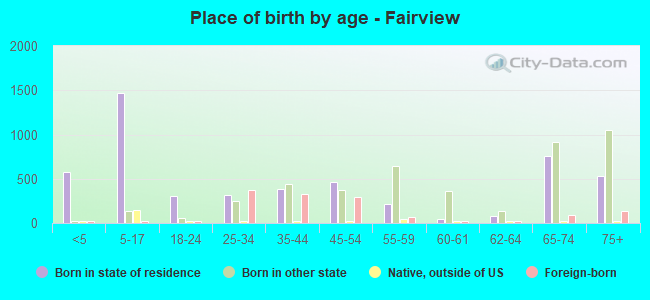
Children Nativity (place of birth) in Fairview
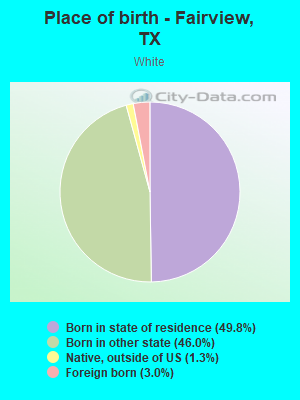
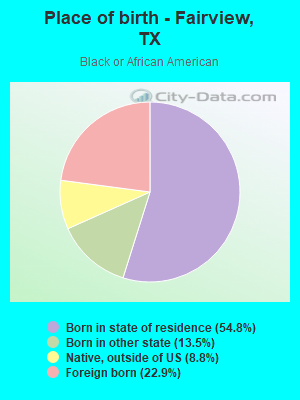
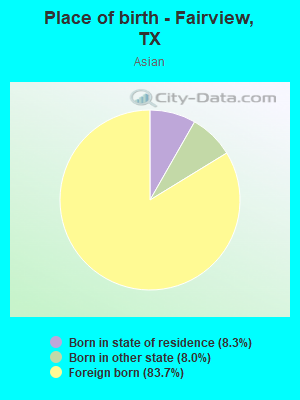
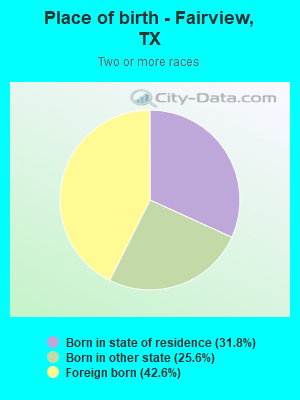
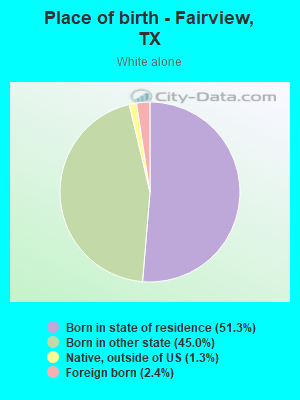
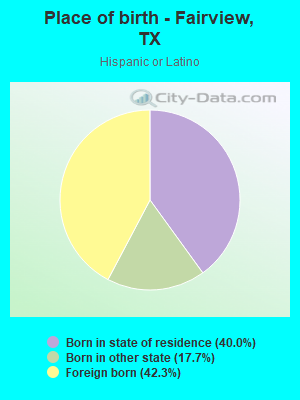
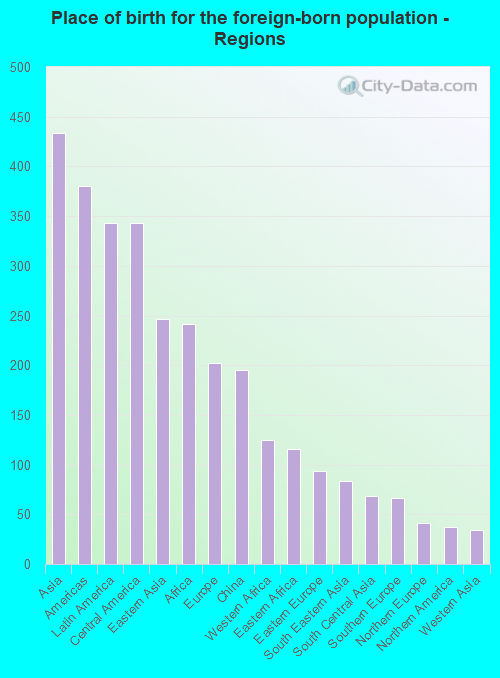
Place of birth for residents in Fairview
![Place of birth for the foreign-born population - Regions]()
- 434Asia
- 380Americas
- 343Latin America
- 343Central America
- 246Eastern Asia
- 241Africa
- 202Europe
- 195China
- 125Western Africa
- 116Eastern Africa
- 94Eastern Europe
- 84South Eastern Asia
- 68South Central Asia
- 66Southern Europe
- 41Northern Europe
- 37Northern America
- 34Western Asia
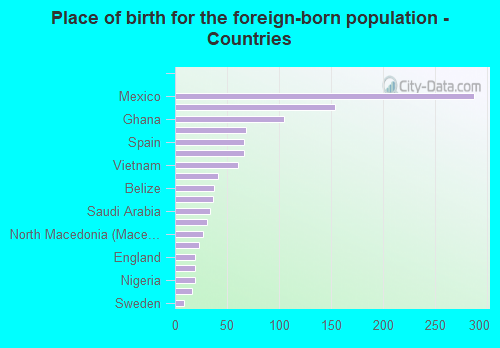
![Place of birth for the foreign-born population - Countries]()
- 288Mexico
- 154China
- 105Ghana
- 68India
- 66Spain
- 66Poland
- 61Vietnam
- 41Taiwan
- 38Belize
- 37Canada
- 34Saudi Arabia
- 31Japan
- 27North Macedonia (Macedonia)
- 23Thailand
- 19England
- 19Korea
- 19Nigeria
- 16El Salvador
- 9Sweden
Zip codes: 75069.