Races in Fall River, Massachusetts (MA) Detailed Stats
Data:
Races - White alone (%)
Races - White alone (% change since 2000)
Races - Black alone (%)
Races - Black alone (% change since 2000)
Races - American Indian alone (%)
Races - American Indian alone (% change since 2000)
Races - Asian alone (%)
Races - Asian alone (% change since 2000)
Races - Hispanic (%)
Races - Hispanic (% change since 2000)
Races - Native Hawaiian and Other Pacific Islander alone (%)
Races - Native Hawaiian and Other Pacific Islander alone (% change since 2000)
Races - Two or more races(%)
Races - Two or more races(% change since 2000)
Races - Other race alone (%)
Races - Other race alone (% change since 2000)
Racial diversity
Place of birth - Born in state of residence (%)
Place of birth - Born in state of residence (%) - White
Place of birth - Born in state of residence (%) - Black or African American
Place of birth - Born in state of residence (%) - Asian
Place of birth - Born in state of residence (%) - Hispanic or Latino
Place of birth - Born in state of residence (%) - American Indian and Alaska Native
Place of birth - Born in state of residence (%) - Multirace
Place of birth - Born in state of residence (%) - Other Race
Place of birth - Born in other state (%)
Place of birth - Born in other state (%) - White
Place of birth - Born in other state (%) - Black or African American
Place of birth - Born in other state (%) - Asian
Place of birth - Born in other state (%) - Hispanic or Latino
Place of birth - Born in other state (%) - American Indian and Alaska Native
Place of birth - Born in other state (%) - Multirace
Place of birth - Born in other state (%) - Other Race
Place of birth - Native, outside of US (%)
Place of birth - Native, outside of US (%) - White
Place of birth - Native, outside of US (%) - Black or African American
Place of birth - Native, outside of US (%) - Asian
Place of birth - Native, outside of US (%) - Hispanic or Latino
Place of birth - Native, outside of US (%) - American Indian and Alaska Native
Place of birth - Native, outside of US (%) - Multirace
Place of birth - Native, outside of US (%) - Other Race
Place of birth - Foreign born (%)
Place of birth - Foreign born (%) - White
Place of birth - Foreign born (%) - Black or African American
Place of birth - Foreign born (%) - Asian
Place of birth - Foreign born (%) - Hispanic or Latino
Place of birth - Foreign born (%) - American Indian and Alaska Native
Place of birth - Foreign born (%) - Multirace
Place of birth - Foreign born (%) - Other Race
Residents speaking English at home (%)
Residents speaking English at home - Born in the United States (%)
Residents speaking English at home - Native, born elsewhere (%)
Residents speaking English at home - Foreign born (%)
Residents speaking Spanish at home (%)
Residents speaking Spanish at home - Born in the United States (%)
Residents speaking Spanish at home - Native, born elsewhere (%)
Residents speaking Spanish at home - Foreign born (%)
Residents speaking other language at home (%)
Residents speaking other language at home - Born in the United States (%)
Residents speaking other language at home - Native, born elsewhere (%)
Residents speaking other language at home - Foreign born (%)
Marital status - Never married (%)
Marital status - Now married (%)
Marital status - Separated (%)
Marital status - Widowed (%)
Marital status - Divorced (%)
Ancestries Reported - Arab (%)
Ancestries Reported - Czech (%)
Ancestries Reported - Danish (%)
Ancestries Reported - Dutch (%)
Ancestries Reported - English (%)
Ancestries Reported - French (%)
Ancestries Reported - French Canadian (%)
Ancestries Reported - German (%)
Ancestries Reported - Greek (%)
Ancestries Reported - Hungarian (%)
Ancestries Reported - Irish (%)
Ancestries Reported - Italian (%)
Ancestries Reported - Lithuanian (%)
Ancestries Reported - Norwegian (%)
Ancestries Reported - Polish (%)
Ancestries Reported - Portuguese (%)
Ancestries Reported - Russian (%)
Ancestries Reported - Scotch-Irish (%)
Ancestries Reported - Scottish (%)
Ancestries Reported - Slovak (%)
Ancestries Reported - Subsaharan African (%)
Ancestries Reported - Swedish (%)
Ancestries Reported - Swiss (%)
Ancestries Reported - Ukrainian (%)
Ancestries Reported - United States (%)
Ancestries Reported - Welsh (%)
Ancestries Reported - West Indian (%)
Ancestries Reported - Other (%)
Geographical mobility - Same house 1 year ago (%)
Geographical mobility - Same house 1 year ago (%) - White
Geographical mobility - Same house 1 year ago (%) - Black or African American
Geographical mobility - Same house 1 year ago (%) - Asian
Geographical mobility - Same house 1 year ago (%) - Hispanic or Latino
Geographical mobility - Same house 1 year ago (%) - American Indian and Alaska Native
Geographical mobility - Same house 1 year ago (%) - Multirace
Geographical mobility - Same house 1 year ago (%) - Other Race
Geographical mobility - Moved within same county (%)
Geographical mobility - Moved within same county (%) - White
Geographical mobility - Moved within same county (%) - Black or African American
Geographical mobility - Moved within same county (%) - Asian
Geographical mobility - Moved within same county (%) - Hispanic or Latino
Geographical mobility - Moved within same county (%) - American Indian and Alaska Native
Geographical mobility - Moved within same county (%) - Multirace
Geographical mobility - Moved within same county (%) - Other Race
Geographical mobility - Moved from different county within same state (%)
Geographical mobility - Moved from different county within same state (%) - White
Geographical mobility - Moved from different county within same state (%) - Black or African American
Geographical mobility - Moved from different county within same state (%) - Asian
Geographical mobility - Moved from different county within same state (%) - Hispanic or Latino
Geographical mobility - Moved from different county within same state (%) - American Indian and Alaska Native
Geographical mobility - Moved from different county within same state (%) - Multirace
Geographical mobility - Moved from different county within same state (%) - Other Race
Geographical mobility - Moved from different state (%)
Geographical mobility - Moved from different state (%) - White
Geographical mobility - Moved from different state (%) - Black or African American
Geographical mobility - Moved from different state (%) - Asian
Geographical mobility - Moved from different state (%) - Hispanic or Latino
Geographical mobility - Moved from different state (%) - American Indian and Alaska Native
Geographical mobility - Moved from different state (%) - Multirace
Geographical mobility - Moved from different state (%) - Other Race
Geographical mobility - Moved from abroad (%)
Geographical mobility - Moved from abroad (%) - White
Geographical mobility - Moved from abroad (%) - Black or African American
Geographical mobility - Moved from abroad (%) - Asian
Geographical mobility - Moved from abroad (%) - Hispanic or Latino
Geographical mobility - Moved from abroad (%) - American Indian and Alaska Native
Geographical mobility - Moved from abroad (%) - Multirace
Geographical mobility - Moved from abroad (%) - Other Race
Place of birth for the foreign-born population - Ireland (%)
Place of birth for the foreign-born population - Denmark (%)
Place of birth for the foreign-born population - Norway (%)
Place of birth for the foreign-born population - Sweden (%)
Place of birth for the foreign-born population - United Kingdom (%)
Place of birth for the foreign-born population - England (%)
Place of birth for the foreign-born population - Scotland (%)
Place of birth for the foreign-born population - Other Northern Europe (%)
Place of birth for the foreign-born population - Austria (%)
Place of birth for the foreign-born population - Belgium (%)
Place of birth for the foreign-born population - France (%)
Place of birth for the foreign-born population - Germany (%)
Place of birth for the foreign-born population - Netherlands (%)
Place of birth for the foreign-born population - Switzerland (%)
Place of birth for the foreign-born population - Other Western Europe (%)
Place of birth for the foreign-born population - Greece (%)
Place of birth for the foreign-born population - Italy (%)
Place of birth for the foreign-born population - Portugal (%)
Place of birth for the foreign-born population - Spain (%)
Place of birth for the foreign-born population - Other Southern Europe (%)
Place of birth for the foreign-born population - Albania (%)
Place of birth for the foreign-born population - Belarus (%)
Place of birth for the foreign-born population - Bosnia and Herzegovina (%)
Place of birth for the foreign-born population - Bulgaria (%)
Place of birth for the foreign-born population - Croatia (%)
Place of birth for the foreign-born population - Czechoslovakia (%)
Place of birth for the foreign-born population - Hungary (%)
Place of birth for the foreign-born population - Latvia (%)
Place of birth for the foreign-born population - Lithuania (%)
Place of birth for the foreign-born population - North Macedonia (Macedonia) (%)
Place of birth for the foreign-born population - Moldova (%)
Place of birth for the foreign-born population - Poland (%)
Place of birth for the foreign-born population - Romania (%)
Place of birth for the foreign-born population - Russia (%)
Place of birth for the foreign-born population - Serbia (%)
Place of birth for the foreign-born population - Ukraine (%)
Place of birth for the foreign-born population - Other Eastern Europe (%)
Place of birth for the foreign-born population - China (%)
Place of birth for the foreign-born population - Hong Kong (%)
Place of birth for the foreign-born population - Taiwan (%)
Place of birth for the foreign-born population - Japan (%)
Place of birth for the foreign-born population - Korea (%)
Place of birth for the foreign-born population - Other Eastern Asia (%)
Place of birth for the foreign-born population - Afghanistan (%)
Place of birth for the foreign-born population - Bangladesh (%)
Place of birth for the foreign-born population - India (%)
Place of birth for the foreign-born population - Iran (%)
Place of birth for the foreign-born population - Kazakhstan (%)
Place of birth for the foreign-born population - Nepal (%)
Place of birth for the foreign-born population - Pakistan (%)
Place of birth for the foreign-born population - Sri Lanka (%)
Place of birth for the foreign-born population - Uzbekistan (%)
Place of birth for the foreign-born population - Other South Central Asia (%)
Place of birth for the foreign-born population - Burma (%)
Place of birth for the foreign-born population - Cambodia (%)
Place of birth for the foreign-born population - Indonesia (%)
Place of birth for the foreign-born population - Laos (%)
Place of birth for the foreign-born population - Malaysia (%)
Place of birth for the foreign-born population - Philippines (%)
Place of birth for the foreign-born population - Singapore (%)
Place of birth for the foreign-born population - Thailand (%)
Place of birth for the foreign-born population - Vietnam (%)
Place of birth for the foreign-born population - Other South Eastern Asia (%)
Place of birth for the foreign-born population - Armenia (%)
Place of birth for the foreign-born population - Iraq (%)
Place of birth for the foreign-born population - Israel (%)
Place of birth for the foreign-born population - Jordan (%)
Place of birth for the foreign-born population - Kuwait (%)
Place of birth for the foreign-born population - Lebanon (%)
Place of birth for the foreign-born population - Saudi Arabia (%)
Place of birth for the foreign-born population - Syria (%)
Place of birth for the foreign-born population - Turkey (%)
Place of birth for the foreign-born population - Yemen (%)
Place of birth for the foreign-born population - Other Western Asia (%)
Place of birth for the foreign-born population - Eritrea (%)
Place of birth for the foreign-born population - Ethiopia (%)
Place of birth for the foreign-born population - Kenya (%)
Place of birth for the foreign-born population - Somalia (%)
Place of birth for the foreign-born population - Uganda (%)
Place of birth for the foreign-born population - Zimbabwe (%)
Place of birth for the foreign-born population - Other Eastern Africa (%)
Place of birth for the foreign-born population - Cameroon (%)
Place of birth for the foreign-born population - Congo (%)
Place of birth for the foreign-born population - Democratic Republic of Congo (Zaire) (%)
Place of birth for the foreign-born population - Other Middle Africa (%)
Place of birth for the foreign-born population - Egypt (%)
Place of birth for the foreign-born population - Morocco (%)
Place of birth for the foreign-born population - Sudan (%)
Place of birth for the foreign-born population - Other Northern Africa (%)
Place of birth for the foreign-born population - South Africa (%)
Place of birth for the foreign-born population - Other Southern Africa (%)
Place of birth for the foreign-born population - Cabo Verde (%)
Place of birth for the foreign-born population - Ghana (%)
Place of birth for the foreign-born population - Liberia (%)
Place of birth for the foreign-born population - Nigeria (%)
Place of birth for the foreign-born population - Senegal (%)
Place of birth for the foreign-born population - Sierra Leone (%)
Place of birth for the foreign-born population - Other Western Africa (%)
Place of birth for the foreign-born population - Australia (%)
Place of birth for the foreign-born population - New Zealand (%)
Place of birth for the foreign-born population - Fiji (%)
Place of birth for the foreign-born population - Micronesia (%)
Place of birth for the foreign-born population - Bahamas (%)
Place of birth for the foreign-born population - Barbados (%)
Place of birth for the foreign-born population - Cuba (%)
Place of birth for the foreign-born population - Dominica (%)
Place of birth for the foreign-born population - Dominican Republic (%)
Place of birth for the foreign-born population - Grenada (%)
Place of birth for the foreign-born population - Haiti (%)
Place of birth for the foreign-born population - Jamaica (%)
Place of birth for the foreign-born population - St. Vincent and the Grenadines (%)
Place of birth for the foreign-born population - Trinidad and Tobago (%)
Place of birth for the foreign-born population - West Indies (%)
Place of birth for the foreign-born population - Other Caribbean (%)
Place of birth for the foreign-born population - Belize (%)
Place of birth for the foreign-born population - Costa Rica (%)
Place of birth for the foreign-born population - El Salvador (%)
Place of birth for the foreign-born population - Guatemala (%)
Place of birth for the foreign-born population - Honduras (%)
Place of birth for the foreign-born population - Mexico (%)
Place of birth for the foreign-born population - Nicaragua (%)
Place of birth for the foreign-born population - Panama (%)
Place of birth for the foreign-born population - Other Central America (%)
Place of birth for the foreign-born population - Argentina (%)
Place of birth for the foreign-born population - Bolivia (%)
Place of birth for the foreign-born population - Brazil (%)
Place of birth for the foreign-born population - Chile (%)
Place of birth for the foreign-born population - Colombia (%)
Place of birth for the foreign-born population - Ecuador (%)
Place of birth for the foreign-born population - Guyana (%)
Place of birth for the foreign-born population - Peru (%)
Place of birth for the foreign-born population - Uruguay (%)
Place of birth for the foreign-born population - Venezuela (%)
Place of birth for the foreign-born population - Other South America (%)
Place of birth for the foreign-born population - Canada (%)
Place of birth for the foreign-born population - Other Northern America (%)
Place of birth for the foreign-born population - Other (%)
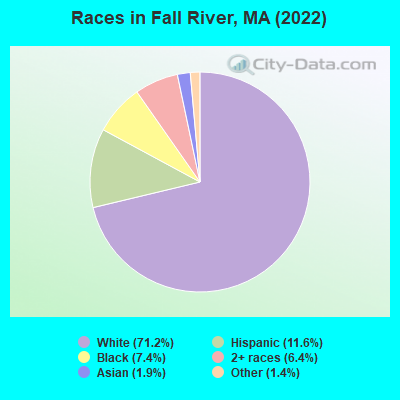
According to 2022 data, the most numerous races in Fall River, MA are White alone (66,747 residents), Hispanic (10,904 residents), and Asian alone (1,777 residents). 65.8% of Fall River residents speak English at home. 22.5% of Fall River, MA residents are foreign-born (11.6% born in Europe, 6.4% born in Latin America), which is 20.2% greater than the foreign-born rate of 18.0% across the entire state of Massachusetts.
Race distribution in Fall River
2000 2022
82,274 89.5% White alone 3,040 3.3% Hispanic 2,097 2.3% Black alone 1,980 2.2% Asian alone 2,061 2.2% Two or more races 323 0.4% Other race alone 147 0.2% American Indian alone 16 0.02% Native Hawaiian and Other
66,747 71.2% White alone 10,904 11.6% Hispanic 6,962 7.4% Black alone 6,031 6.4% Two or more races 1,777 1.9% Asian alone 1,268 1.4% Other race alone
2000 2022
5,198,359 81.9% White alone 428,729 6.8% Hispanic 318,329 5.0% Black alone 236,786 3.7% Asian alone 110,338 1.7% Two or more races 43,586 0.7% Other race alone 11,264 0.2% American Indian alone 1,706 0.03% Native Hawaiian and Other
4,676,627 67.0% White alone 911,038 13.0% Hispanic 501,463 7.2% Asian alone 459,740 6.6% Black alone 341,889 4.9% Two or more races 84,403 1.2% Other race alone 5,838 0.08% American Indian alone 976 0.01% Native Hawaiian and Other
Income and house value in Fall River Median household income in 2022 $49,180 White non-Hispanic householders$50,479 Black householders$90,748 Asian householders$33,345 Some other race householders$39,681 Two or more races householders$33,105 Hispanic or Latino race householdersMedian 2022 house value $357,665 White Non-Hispanic householders$364,942 Black or African American householders$303,220 American Indian or Alaska Native householders $380,306 Asian householders$376,532 Some other race householders$381,114 Two or more races householders$366,560 Hispanic or Latino householders
Median age by race in Fall River
47.0 Median age for White residents43.1 50.9 29.0 Median age for Black or African American residents34.2 27.5 -666,666,666.0 Median age for American Indian / Alaska Native residents-666,666,666.0 -666,666,666.0 32.6 Median age for Asian residents22.2 37.0 24.7 Median age for Native Hawaiian / Pacific Islander residents-666,666,666.0 -666,666,666.0 32.1 Median age for Other race residents33.2 31.4 34.3 Median age for Two or more races residents35.2 32.9 47.3 Median age for White alone residents43.7 51.1 27.6 Median age for Hispanic or Latino residents26.9 29.2
Owner/renter occupied households by race in Fall River
House owners and renters - White residents 13,106 39.9% Owner occupied19,705 60.1% Renter occupiedHouse owners and renters - Black or African American residents 975 41.8% Owner occupied1,360 58.2% Renter occupiedHouse owners and renters - American Indian / Alaska Native residents 102 59.0% Owner occupied70 41.0% Renter occupiedHouse owners and renters - Asian residents 93 20.8% Owner occupied354 79.2% Renter occupiedHouse owners and renters - Other race residents 568 23.4% Owner occupied1,858 76.6% Renter occupiedHouse owners and renters - Two or more races residents 818 22.8% Owner occupied2,775 77.2% Renter occupiedHouse owners and renters - White alone residents 13,106 40.4% Owner occupied19,359 59.6% Renter occupiedHouse owners and renters - Hispanic or Latino residents 716 18.9% Owner occupied3,069 81.1% Renter occupied
Language usage in Fall River
English speakers - Total 65.8% of residents of Fall River speak English at home.
8.4% of residents speak Spanish at home 4,240 56.6% Speak English very well3,256 43.4% Speak English less than very well25.8% of residents speak other language at home 14,420 63.0% Speak English very well8,468 37.0% Speak English less than very well
English speakers - Born in the United States 78.8% of residents of Fall River speak English at home.
15.8% of residents speak Spanish at home 1,661 83.5% Speak English very well328 16.5% Speak English less than very well5.3% of residents speak other language at home 660 98.2% Speak English very well12 1.8% Speak English less than very well
English speakers - Native, born elsewhere 21.3% of residents of Fall River speak English at home.
58.3% of residents speak Spanish at home 829 50.7% Speak English very well805 49.3% Speak English less than very well20.3% of residents speak other language at home 569 100.0% Speak English very well
English speakers - Foreign-born 8.4% of residents of Fall River speak English at home.
13.7% of residents speak Spanish at home 651 25.2% Speak English very well1,932 74.8% Speak English less than very well77.9% of residents speak other language at home 6,295 42.9% Speak English very well8,374 57.1% Speak English less than very well
White (Caucasian) - Speak only English Native:
88.4% (48,499)Foreign-born:
9.8% (991)
White (Caucasian) - Speak another language Native:
11.6% (6,366)Foreign-born:
90.2% (9,083)
Black or African American - Speak only English Native:
72.1% (3,136)Foreign-born:
11.4% (268)
Black or African American - Speak another language Native:
27.9% (1,213)Foreign-born:
88.6% (2,075)
American Indian / Alaska Native - Speak another language Native:
35.0% (49)Foreign-born:
100.0% (52)
Asian - Speak only English Native:
50.0% (408)Foreign-born:
21.5% (193)
Asian - Speak another language Native:
50.0% (408)Foreign-born:
78.5% (706)
Native Hawaiian / Pacific Islander - Speak another language Native:
100.0% (56)Foreign-born:
100.0% (29)
Other race - Speak only English Native:
28.7% (1,354)Foreign-born:
2.4% (47)
Other race - Speak another language Native:
71.3% (3,362)Foreign-born:
97.6% (1,892)
Two or more races - Speak only English Native:
68.8% (3,518)Foreign-born:
2.1% (73)
Two or more races - Speak another language Native:
31.2% (1,595)Foreign-born:
97.9% (3,425)
White alone - Speak only English Native:
89.0% (48,458)Foreign-born:
8.1% (778)
White alone - Speak another language Native:
11.0% (6,014)Foreign-born:
91.9% (8,856)
Hispanic or Latino - Speak only English Native:
34.3% (2,544)Foreign-born:
8.0% (213)
Hispanic or Latino - Speak another language Native:
65.7% (4,871)Foreign-born:
92.0% (2,438)
Foreign-born residents in Fall River 21,237 residents are foreign born (11.6% Europe , 6.4% Latin America ).
This city:
22.5%Massachusetts:
17.6%
Marital status for residents in Fall River Marital status - White (Caucasian) population 15 years and over
Males 45.7% Never married31.7% Now married2.9% Separated3.3% Widowed16.4% DivorcedFemales 33.6% Never married28.3% Now married3.1% Separated14.7% Widowed20.4% DivorcedWomen who gave birth in the past 12 months Now married:
62.1% (768)Unmarried:
37.9% (468)
Women who did not give birth in the past 12 months Now married:
27.4% (3,569)Unmarried:
72.6% (9,454)
Marital status - Black or African American population 15 years and over
Males 51.3% Never married31.2% Now married5.5% Separated0.0% Widowed12.0% DivorcedFemales 57.3% Never married25.8% Now married1.9% Separated0.0% Widowed14.9% DivorcedWomen who gave birth in the past 12 months Now married:
45.4% (117)Unmarried:
54.6% (141)
Women who did not give birth in the past 12 months Now married:
26.0% (558)Unmarried:
74.0% (1,584)
Marital status - American Indian / Alaska Native population 15 years and over
Males 77.9% Never married22.1% Now married0.0% Separated0.0% Widowed0.0% DivorcedFemales 41.9% Never married20.3% Now married0.0% Separated0.0% Widowed37.8% DivorcedWomen who did not give birth in the past 12 months Now married:
0.0% (0)Unmarried:
100.0% (57)
Marital status - Asian population 15 years and over
Males 43.7% Never married51.0% Now married0.8% Separated0.4% Widowed4.1% DivorcedFemales 28.0% Never married58.1% Now married2.4% Separated4.3% Widowed7.1% DivorcedWomen who gave birth in the past 12 months Now married:
100.0% (29)Unmarried:
0.0% (0)
Women who did not give birth in the past 12 months Now married:
43.7% (254)Unmarried:
56.3% (327)
Marital status - Native Hawaiian / Pacific Islander population 15 years and over
Males 100.0% Never married0.0% Now married0.0% Separated0.0% Widowed0.0% DivorcedFemales 100.0% Never married0.0% Now married0.0% Separated0.0% Widowed0.0% DivorcedWomen who gave birth in the past 12 months Now married:
0.0% (0)Unmarried:
100.0% (25)
Women who did not give birth in the past 12 months Now married:
0.0% (0)Unmarried:
100.0% (29)
Marital status - Other race population 15 years and over
Males 36.6% Never married45.2% Now married1.5% Separated2.1% Widowed14.6% DivorcedFemales 48.0% Never married38.4% Now married1.9% Separated5.7% Widowed6.0% DivorcedWomen who gave birth in the past 12 months Now married:
18.3% (15)Unmarried:
81.7% (66)
Women who did not give birth in the past 12 months Now married:
42.3% (879)Unmarried:
57.7% (1,200)
Marital status - Two or more races population 15 years and over
Males 27.2% Never married63.2% Now married0.0% Separated1.0% Widowed8.7% DivorcedFemales 38.8% Never married39.0% Now married3.5% Separated1.8% Widowed16.9% DivorcedWomen who gave birth in the past 12 months Now married:
100.0% (186)Unmarried:
0.0% (0)
Women who did not give birth in the past 12 months Now married:
37.6% (932)Unmarried:
62.4% (1,550)
Marital status - White alone, not Hispanic / Latino population 15 years and over
Males 45.2% Never married32.0% Now married2.9% Separated3.3% Widowed16.6% DivorcedFemales 33.2% Never married28.1% Now married3.1% Separated14.9% Widowed20.7% DivorcedWomen who gave birth in the past 12 months Now married:
67.7% (768)Unmarried:
32.3% (367)
Women who did not give birth in the past 12 months Now married:
27.8% (3,569)Unmarried:
72.2% (9,286)
Marital status - Hispanic or Latino population 15 years and over
Males 56.4% Never married34.7% Now married0.7% Separated1.1% Widowed7.0% DivorcedFemales 53.2% Never married30.1% Now married2.2% Separated4.0% Widowed10.5% DivorcedWomen who gave birth in the past 12 months Now married:
22.4% (59)Unmarried:
77.6% (204)
Women who did not give birth in the past 12 months Now married:
31.9% (1,091)Unmarried:
68.1% (2,331)
Ancestries in Fall River
23,141 44.8% Portuguese2,236 4.3% Brazilian2,205 4.3% Irish2,097 4.1% English1,733 3.4% Cape Verdean1,557 3.0% American1,353 2.6% French Canadian1,322 2.6% Italian1,170 2.3% French571 1.1% Haitian306 0.6% German300 0.6% Polish295 0.6% Nigerian194 0.4% African173 0.3% Jamaican171 0.3% European99 0.2% Trinidadian and Tobagonian97 0.2% Lebanese86 0.2% Russian83 0.2% Belgian81 0.2% Canadian79 0.2% Senegalese78 0.2% Ukrainian73 0.1% Ghanaian64 0.1% Greek61 0.1% West Indian56 0.1% Moroccan54 0.1% Norwegian53 0.1% Lithuanian49 0.09% Eastern European48 0.09% Danish41 0.08% Iranian37 0.07% Swedish31 0.06% Scottish29 0.06% Northern European25 0.05% Dutch24 0.05% Egyptian24 0.05% Albanian20 0.04% British19 0.04% Ugandan19 0.04% Belizean18 0.03% Scotch-Irish11 0.02% Romanian11 0.02% Barbadian7 0.01% Austrian5 0.01% Swiss5 0.01% Czechoslovakian4 0.01% Guyanese
Geographical mobility in Fall River Same house 1 year ago 59,491 89.4% White (Caucasian)6,335 80.2% Black or African American200 98.1% American Indian / Alaska Native2,208 83.7% Asian56 65.7% Native Hawaiian / Pacific Islander4,463 73.2% Other race9,495 85.1% Two or more races58,658 89.2% White alone, not Hispanic / Latino8,139 76.0% Hispanic or LatinoMoved within same county 4,606 6.9% White / Caucasian349 4.4% Black or African American6 3.0% American Indian / Alaska Native461 17.5% Asian1,338 22.0% Other race568 5.1% Two or more races4,606 7.0% White alone, not Hispanic / Latino1,683 15.7% Hispanic or LatinoMoved within same state 1,825 2.7% White / Caucasian530 6.7% Black or African American6 0.2% Asian54 0.9% Other race540 4.8% Two or more races1,825 2.8% White alone, not Hispanic / Latino282 2.6% Hispanic or LatinoMoved from different state 491 0.7% White / Caucasian512 6.5% Black or African American269 4.4% Other race124 1.1% Two or more races491 0.7% White alone, not Hispanic / Latino482 4.5% Hispanic or LatinoMoved from abroad 153 0.2% White76 1.0% Black or African American4 0.1% Asian21 24.7% Native Hawaiian / Pacific Islander74 1.2% Other race387 3.5% Two or more races153 0.2% White alone, not Hispanic / Latino120 1.1% Hispanic or Latino
Children Nativity (place of birth) in Fall River
Children under 6 years - Living with two parents Both parents native 1,534 100.0% NativeBoth parents foreign-born 576 70.7% Native239 29.3% Foreign-bornOne native, one foreign-born parent 116 100.0% NativeChildren under 6 years - Living with one parent Native parent 2,070 100.0% NativeForeign-born parent 336 73.4% Native122 26.6% Foreign-bornChildren 6 to 17 years - Living with two parents Both parents native 1,803 100.0% NativeBoth parents foreign-born 1,449 80.3% Native355 19.7% Foreign-bornOne native, one foreign-born parent 699 100.0% NativeChildren 6 to 17 years - Living with one parent Native parent 6,491 100.0% NativeForeign-born parent 1,828 50.7% Native1,781 49.3% Foreign-born
Place of birth for residents in Fall River 11,153 Europe10,894 Southern Europe6,306 Americas6,118 Latin America4,175 South America2,081 Africa1,777 Western Africa1,696 Asia1,303 Caribbean1,044 South Eastern Asia640 Central America320 South Central Asia301 Eastern Asia263 China187 Northern America135 Northern Europe107 Northern Africa92 Eastern Africa91 Middle Africa65 Eastern Europe57 Western Europe29 Western Asia13 Southern Africa10,767 Portugal4,294 Azores Islands3,220 Brazil1,384 Cabo Verde709 Ecuador549 Haiti545 Dominican Republic539 Cambodia261 Honduras251 China249 India195 El Salvador195 Nigeria186 Vietnam152 Thailand135 Canada129 Colombia127 Italy107 Egypt104 Malaysia102 Senegal88 Ghana87 England83 Dominica70 Mexico68 Guatemala47 Iran46 Argentina46 Germany41 Russia33 Trinidad and Tobago32 Congo31 Japan27 Laos27 Jamaica25 United Kingdom25 Peru25 Venezuela23 Uganda23 Bangladesh20 Singapore19 Cuba19 Ethiopia18 Bolivia18 Israel17 Ireland16 Albania14 Barbados13 South Africa12 Taiwan12 Zimbabwe12 Philippines11 Belize11 Lebanon8 Ukraine7 Austria6 Korea6 Liberia5 Scotland4 Netherlands3 Democratic Republic of Congo (Zaire)
Grandparents responsible for own grandchildren in Fall River
Grandparents (30 to 59 years) White / Caucasian 644 66.1% Responsible for grandchildren331 33.9% Not responsible for grandchildrenBlack or African American 31 28.2% Responsible for grandchildren79 71.8% Not responsible for grandchildrenOther race 144 100.0% Not responsible for grandchildrenTwo or more races 35 80.6% Responsible for grandchildren8 19.4% Not responsible for grandchildrenWhite alone, not Hispanic / Latino 562 62.9% Responsible for grandchildren332 37.1% Not responsible for grandchildrenHispanic or Latino 65 38.1% Responsible for grandchildren107 61.9% Not responsible for grandchildrenGrandparents (60 years and over) White / Caucasian 295 43.6% Responsible for grandchildren382 56.4% Not responsible for grandchildrenBlack or African American 12 100.0% Not responsible for grandchildrenOther race 8 100.0% Not responsible for grandchildrenTwo or more races 44 100.0% Not responsible for grandchildrenWhite alone, not Hispanic / Latino 298 43.5% Responsible for grandchildren386 56.5% Not responsible for grandchildrenHispanic or Latino 10 100.0% Not responsible for grandchildren