Races in Farmingdale, New York (NY) Detailed Stats
Data:
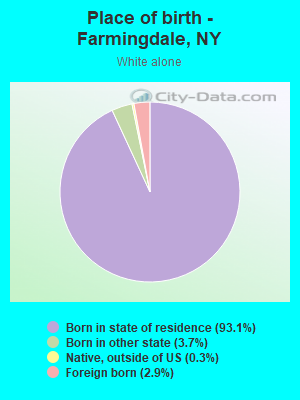
Races - White alone (%)
Races - White alone (% change since 2000)
Races - Black alone (%)
Races - Black alone (% change since 2000)
Races - American Indian alone (%)
Races - American Indian alone (% change since 2000)
Races - Asian alone (%)
Races - Asian alone (% change since 2000)
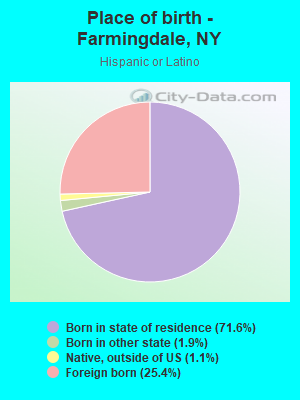
Races - Hispanic (%)
Races - Hispanic (% change since 2000)
Races - Native Hawaiian and Other Pacific Islander alone (%)
Races - Native Hawaiian and Other Pacific Islander alone (% change since 2000)
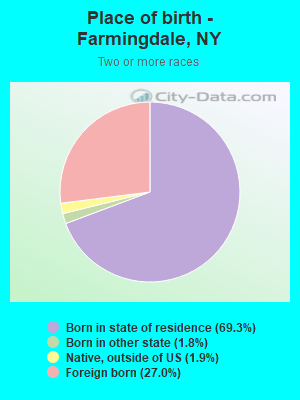
Races - Two or more races(%)
Races - Two or more races(% change since 2000)
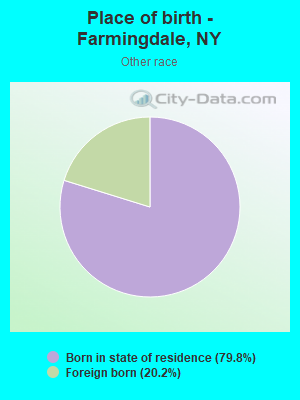
Races - Other race alone (%)
Races - Other race alone (% change since 2000)
Racial diversity
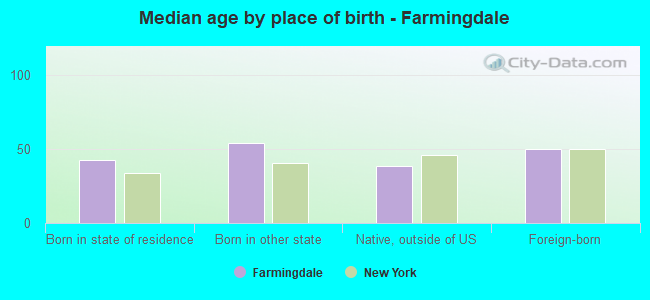
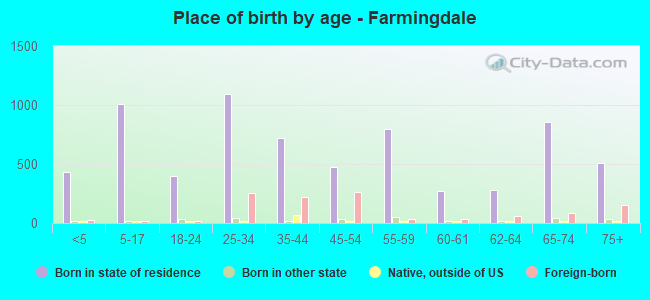
Place of birth - Born in state of residence (%)
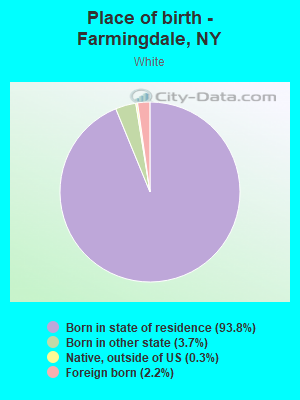
Place of birth - Born in state of residence (%) - White
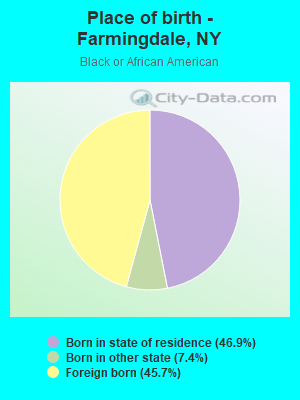
Place of birth - Born in state of residence (%) - Black or African American
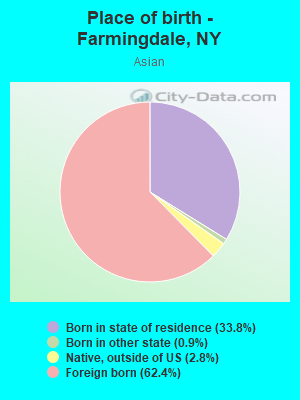
Place of birth - Born in state of residence (%) - Asian
Place of birth - Born in state of residence (%) - Hispanic or Latino
Place of birth - Born in state of residence (%) - American Indian and Alaska Native
Place of birth - Born in state of residence (%) - Multirace
Place of birth - Born in state of residence (%) - Other Race
Place of birth - Born in other state (%)
Place of birth - Born in other state (%) - White
Place of birth - Born in other state (%) - Black or African American
Place of birth - Born in other state (%) - Asian
Place of birth - Born in other state (%) - Hispanic or Latino
Place of birth - Born in other state (%) - American Indian and Alaska Native
Place of birth - Born in other state (%) - Multirace
Place of birth - Born in other state (%) - Other Race
Place of birth - Native, outside of US (%)
Place of birth - Native, outside of US (%) - White
Place of birth - Native, outside of US (%) - Black or African American
Place of birth - Native, outside of US (%) - Asian
Place of birth - Native, outside of US (%) - Hispanic or Latino
Place of birth - Native, outside of US (%) - American Indian and Alaska Native
Place of birth - Native, outside of US (%) - Multirace
Place of birth - Native, outside of US (%) - Other Race
Place of birth - Foreign born (%)
Place of birth - Foreign born (%) - White
Place of birth - Foreign born (%) - Black or African American
Place of birth - Foreign born (%) - Asian
Place of birth - Foreign born (%) - Hispanic or Latino
Place of birth - Foreign born (%) - American Indian and Alaska Native
Place of birth - Foreign born (%) - Multirace
Place of birth - Foreign born (%) - Other Race
Residents speaking English at home (%)
Residents speaking English at home - Born in the United States (%)
Residents speaking English at home - Native, born elsewhere (%)
Residents speaking English at home - Foreign born (%)
Residents speaking Spanish at home (%)
Residents speaking Spanish at home - Born in the United States (%)
Residents speaking Spanish at home - Native, born elsewhere (%)
Residents speaking Spanish at home - Foreign born (%)
Residents speaking other language at home (%)
Residents speaking other language at home - Born in the United States (%)
Residents speaking other language at home - Native, born elsewhere (%)
Residents speaking other language at home - Foreign born (%)
Marital status - Never married (%)
Marital status - Now married (%)
Marital status - Separated (%)
Marital status - Widowed (%)
Marital status - Divorced (%)
Ancestries Reported - Arab (%)
Ancestries Reported - Czech (%)
Ancestries Reported - Danish (%)
Ancestries Reported - Dutch (%)
Ancestries Reported - English (%)
Ancestries Reported - French (%)
Ancestries Reported - French Canadian (%)
Ancestries Reported - German (%)
Ancestries Reported - Greek (%)
Ancestries Reported - Hungarian (%)
Ancestries Reported - Irish (%)
Ancestries Reported - Italian (%)
Ancestries Reported - Lithuanian (%)
Ancestries Reported - Norwegian (%)
Ancestries Reported - Polish (%)
Ancestries Reported - Portuguese (%)
Ancestries Reported - Russian (%)
Ancestries Reported - Scotch-Irish (%)
Ancestries Reported - Scottish (%)
Ancestries Reported - Slovak (%)
Ancestries Reported - Subsaharan African (%)
Ancestries Reported - Swedish (%)
Ancestries Reported - Swiss (%)
Ancestries Reported - Ukrainian (%)
Ancestries Reported - United States (%)
Ancestries Reported - Welsh (%)
Ancestries Reported - West Indian (%)
Ancestries Reported - Other (%)
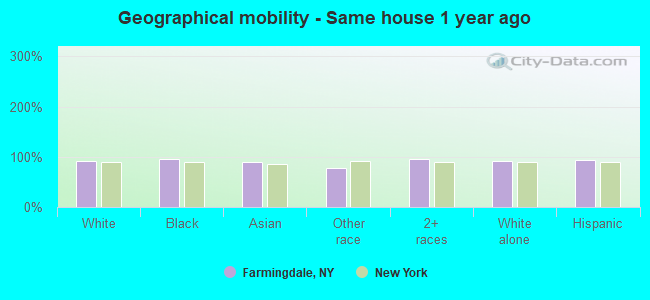
Geographical mobility - Same house 1 year ago (%)
Geographical mobility - Same house 1 year ago (%) - White
Geographical mobility - Same house 1 year ago (%) - Black or African American
Geographical mobility - Same house 1 year ago (%) - Asian
Geographical mobility - Same house 1 year ago (%) - Hispanic or Latino
Geographical mobility - Same house 1 year ago (%) - American Indian and Alaska Native
Geographical mobility - Same house 1 year ago (%) - Multirace
Geographical mobility - Same house 1 year ago (%) - Other Race
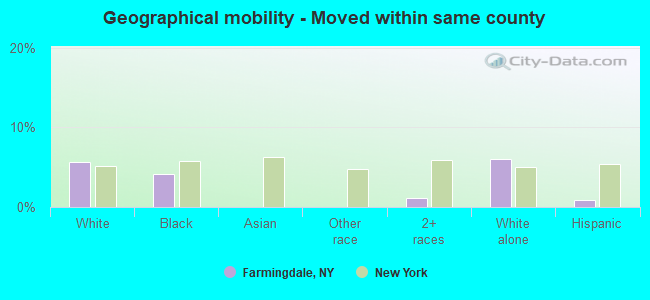
Geographical mobility - Moved within same county (%)
Geographical mobility - Moved within same county (%) - White
Geographical mobility - Moved within same county (%) - Black or African American
Geographical mobility - Moved within same county (%) - Asian
Geographical mobility - Moved within same county (%) - Hispanic or Latino
Geographical mobility - Moved within same county (%) - American Indian and Alaska Native
Geographical mobility - Moved within same county (%) - Multirace
Geographical mobility - Moved within same county (%) - Other Race
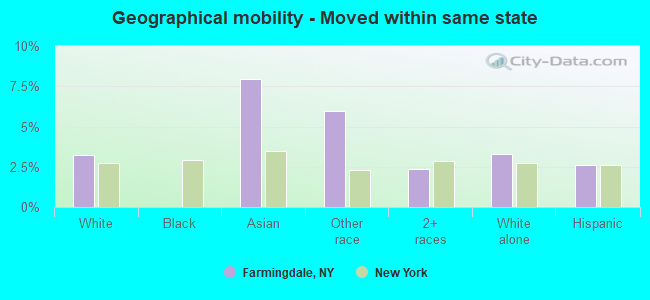
Geographical mobility - Moved from different county within same state (%)
Geographical mobility - Moved from different county within same state (%) - White
Geographical mobility - Moved from different county within same state (%) - Black or African American
Geographical mobility - Moved from different county within same state (%) - Asian
Geographical mobility - Moved from different county within same state (%) - Hispanic or Latino
Geographical mobility - Moved from different county within same state (%) - American Indian and Alaska Native
Geographical mobility - Moved from different county within same state (%) - Multirace
Geographical mobility - Moved from different county within same state (%) - Other Race
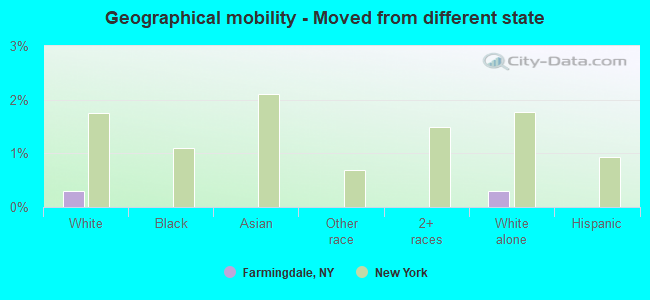
Geographical mobility - Moved from different state (%)
Geographical mobility - Moved from different state (%) - White
Geographical mobility - Moved from different state (%) - Black or African American
Geographical mobility - Moved from different state (%) - Asian
Geographical mobility - Moved from different state (%) - Hispanic or Latino
Geographical mobility - Moved from different state (%) - American Indian and Alaska Native
Geographical mobility - Moved from different state (%) - Multirace
Geographical mobility - Moved from different state (%) - Other Race
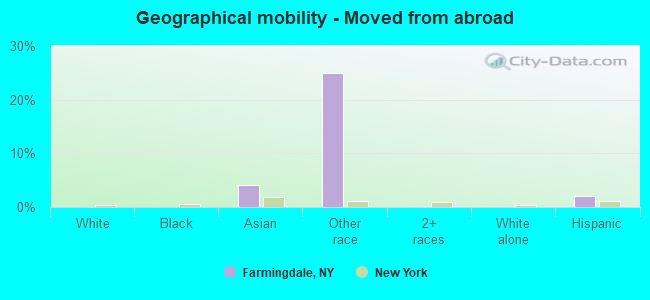
Geographical mobility - Moved from abroad (%)
Geographical mobility - Moved from abroad (%) - White
Geographical mobility - Moved from abroad (%) - Black or African American
Geographical mobility - Moved from abroad (%) - Asian
Geographical mobility - Moved from abroad (%) - Hispanic or Latino
Geographical mobility - Moved from abroad (%) - American Indian and Alaska Native
Geographical mobility - Moved from abroad (%) - Multirace
Geographical mobility - Moved from abroad (%) - Other Race
Place of birth for the foreign-born population - Ireland (%)
Place of birth for the foreign-born population - Denmark (%)
Place of birth for the foreign-born population - Norway (%)
Place of birth for the foreign-born population - Sweden (%)
Place of birth for the foreign-born population - United Kingdom (%)
Place of birth for the foreign-born population - England (%)
Place of birth for the foreign-born population - Scotland (%)
Place of birth for the foreign-born population - Other Northern Europe (%)
Place of birth for the foreign-born population - Austria (%)
Place of birth for the foreign-born population - Belgium (%)
Place of birth for the foreign-born population - France (%)
Place of birth for the foreign-born population - Germany (%)
Place of birth for the foreign-born population - Netherlands (%)
Place of birth for the foreign-born population - Switzerland (%)
Place of birth for the foreign-born population - Other Western Europe (%)
Place of birth for the foreign-born population - Greece (%)
Place of birth for the foreign-born population - Italy (%)
Place of birth for the foreign-born population - Portugal (%)
Place of birth for the foreign-born population - Spain (%)
Place of birth for the foreign-born population - Other Southern Europe (%)
Place of birth for the foreign-born population - Albania (%)
Place of birth for the foreign-born population - Belarus (%)
Place of birth for the foreign-born population - Bosnia and Herzegovina (%)
Place of birth for the foreign-born population - Bulgaria (%)
Place of birth for the foreign-born population - Croatia (%)
Place of birth for the foreign-born population - Czechoslovakia (%)
Place of birth for the foreign-born population - Hungary (%)
Place of birth for the foreign-born population - Latvia (%)
Place of birth for the foreign-born population - Lithuania (%)
Place of birth for the foreign-born population - North Macedonia (Macedonia) (%)
Place of birth for the foreign-born population - Moldova (%)
Place of birth for the foreign-born population - Poland (%)
Place of birth for the foreign-born population - Romania (%)
Place of birth for the foreign-born population - Russia (%)
Place of birth for the foreign-born population - Serbia (%)
Place of birth for the foreign-born population - Ukraine (%)
Place of birth for the foreign-born population - Other Eastern Europe (%)
Place of birth for the foreign-born population - China (%)
Place of birth for the foreign-born population - Hong Kong (%)
Place of birth for the foreign-born population - Taiwan (%)
Place of birth for the foreign-born population - Japan (%)
Place of birth for the foreign-born population - Korea (%)
Place of birth for the foreign-born population - Other Eastern Asia (%)
Place of birth for the foreign-born population - Afghanistan (%)
Place of birth for the foreign-born population - Bangladesh (%)
Place of birth for the foreign-born population - India (%)
Place of birth for the foreign-born population - Iran (%)
Place of birth for the foreign-born population - Kazakhstan (%)
Place of birth for the foreign-born population - Nepal (%)
Place of birth for the foreign-born population - Pakistan (%)
Place of birth for the foreign-born population - Sri Lanka (%)
Place of birth for the foreign-born population - Uzbekistan (%)
Place of birth for the foreign-born population - Other South Central Asia (%)
Place of birth for the foreign-born population - Burma (%)
Place of birth for the foreign-born population - Cambodia (%)
Place of birth for the foreign-born population - Indonesia (%)
Place of birth for the foreign-born population - Laos (%)
Place of birth for the foreign-born population - Malaysia (%)
Place of birth for the foreign-born population - Philippines (%)
Place of birth for the foreign-born population - Singapore (%)
Place of birth for the foreign-born population - Thailand (%)
Place of birth for the foreign-born population - Vietnam (%)
Place of birth for the foreign-born population - Other South Eastern Asia (%)
Place of birth for the foreign-born population - Armenia (%)
Place of birth for the foreign-born population - Iraq (%)
Place of birth for the foreign-born population - Israel (%)
Place of birth for the foreign-born population - Jordan (%)
Place of birth for the foreign-born population - Kuwait (%)
Place of birth for the foreign-born population - Lebanon (%)
Place of birth for the foreign-born population - Saudi Arabia (%)
Place of birth for the foreign-born population - Syria (%)
Place of birth for the foreign-born population - Turkey (%)
Place of birth for the foreign-born population - Yemen (%)
Place of birth for the foreign-born population - Other Western Asia (%)
Place of birth for the foreign-born population - Eritrea (%)
Place of birth for the foreign-born population - Ethiopia (%)
Place of birth for the foreign-born population - Kenya (%)
Place of birth for the foreign-born population - Somalia (%)
Place of birth for the foreign-born population - Uganda (%)
Place of birth for the foreign-born population - Zimbabwe (%)
Place of birth for the foreign-born population - Other Eastern Africa (%)
Place of birth for the foreign-born population - Cameroon (%)
Place of birth for the foreign-born population - Congo (%)
Place of birth for the foreign-born population - Democratic Republic of Congo (Zaire) (%)
Place of birth for the foreign-born population - Other Middle Africa (%)
Place of birth for the foreign-born population - Egypt (%)
Place of birth for the foreign-born population - Morocco (%)
Place of birth for the foreign-born population - Sudan (%)
Place of birth for the foreign-born population - Other Northern Africa (%)
Place of birth for the foreign-born population - South Africa (%)
Place of birth for the foreign-born population - Other Southern Africa (%)
Place of birth for the foreign-born population - Cabo Verde (%)
Place of birth for the foreign-born population - Ghana (%)
Place of birth for the foreign-born population - Liberia (%)
Place of birth for the foreign-born population - Nigeria (%)
Place of birth for the foreign-born population - Senegal (%)
Place of birth for the foreign-born population - Sierra Leone (%)
Place of birth for the foreign-born population - Other Western Africa (%)
Place of birth for the foreign-born population - Australia (%)
Place of birth for the foreign-born population - New Zealand (%)
Place of birth for the foreign-born population - Fiji (%)
Place of birth for the foreign-born population - Micronesia (%)
Place of birth for the foreign-born population - Bahamas (%)
Place of birth for the foreign-born population - Barbados (%)
Place of birth for the foreign-born population - Cuba (%)
Place of birth for the foreign-born population - Dominica (%)
Place of birth for the foreign-born population - Dominican Republic (%)
Place of birth for the foreign-born population - Grenada (%)
Place of birth for the foreign-born population - Haiti (%)
Place of birth for the foreign-born population - Jamaica (%)
Place of birth for the foreign-born population - St. Vincent and the Grenadines (%)
Place of birth for the foreign-born population - Trinidad and Tobago (%)
Place of birth for the foreign-born population - West Indies (%)
Place of birth for the foreign-born population - Other Caribbean (%)
Place of birth for the foreign-born population - Belize (%)
Place of birth for the foreign-born population - Costa Rica (%)
Place of birth for the foreign-born population - El Salvador (%)
Place of birth for the foreign-born population - Guatemala (%)
Place of birth for the foreign-born population - Honduras (%)
Place of birth for the foreign-born population - Mexico (%)
Place of birth for the foreign-born population - Nicaragua (%)
Place of birth for the foreign-born population - Panama (%)
Place of birth for the foreign-born population - Other Central America (%)
Place of birth for the foreign-born population - Argentina (%)
Place of birth for the foreign-born population - Bolivia (%)
Place of birth for the foreign-born population - Brazil (%)
Place of birth for the foreign-born population - Chile (%)
Place of birth for the foreign-born population - Colombia (%)
Place of birth for the foreign-born population - Ecuador (%)
Place of birth for the foreign-born population - Guyana (%)
Place of birth for the foreign-born population - Peru (%)
Place of birth for the foreign-born population - Uruguay (%)
Place of birth for the foreign-born population - Venezuela (%)
Place of birth for the foreign-born population - Other South America (%)
Place of birth for the foreign-born population - Canada (%)
Place of birth for the foreign-born population - Other Northern America (%)
Place of birth for the foreign-born population - Other (%)
Latest news about races in Farmingdale, NY collected exclusively by city-data.com from local newspapers, TV, and radio stations
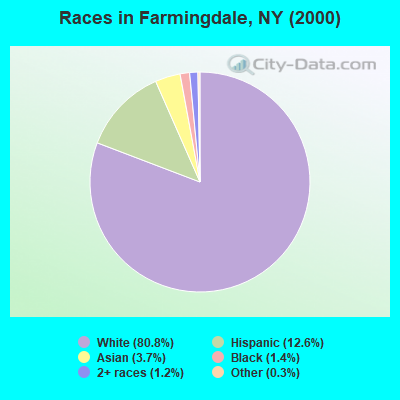
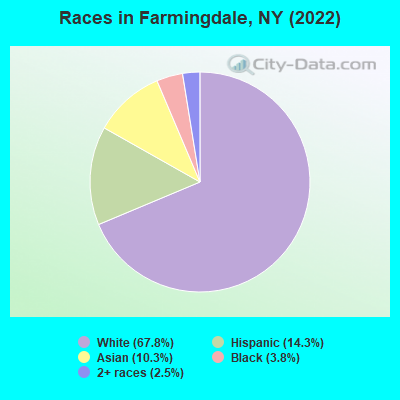
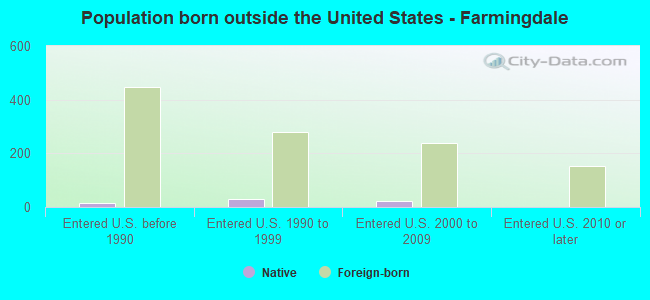
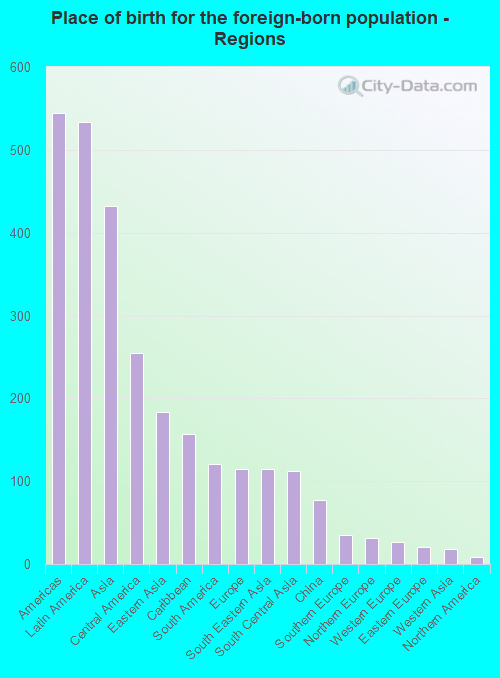
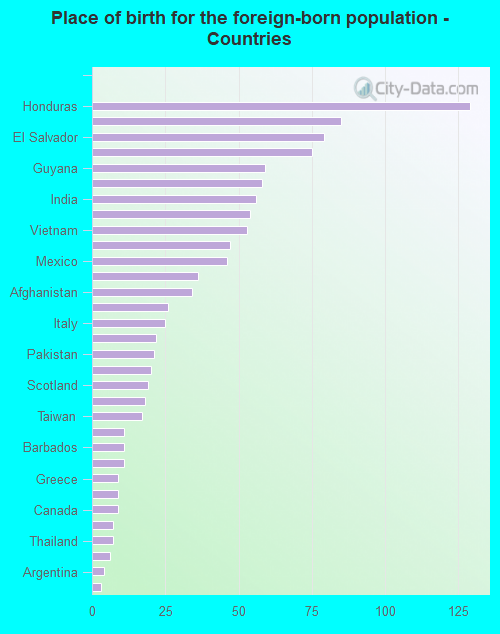
According to 2022 data, the most numerous races in Farmingdale, NY are White alone (5,690 residents), Hispanic (1,204 residents), and Black alone (319 residents). 81.5% of Farmingdale residents speak English at home. 13.0% of Farmingdale, NY residents are foreign-born (6.4% born in Latin America, 5.2% born in Asia, 1.4% born in Europe), which is 69.3% less than the foreign-born rate of 22.0% across the entire state of New York.
Race distribution in Farmingdale
2000 2022
11,760,981 62.0% White alone 2,867,583 15.1% Hispanic 2,812,623 14.8% Black alone 1,035,926 5.5% Asian alone 366,116 1.9% Two or more races 75,499 0.4% Other race alone 52,499 0.3% American Indian alone 5,230 0.03% Native Hawaiian and Other
10,408,933 52.9% White alone 3,867,299 19.7% Hispanic 2,633,840 13.4% Black alone 1,776,286 9.0% Asian alone 732,670 3.7% Two or more races 216,110 1.1% Other race alone 35,082 0.2% American Indian alone 6,931 0.04% Native Hawaiian and Other
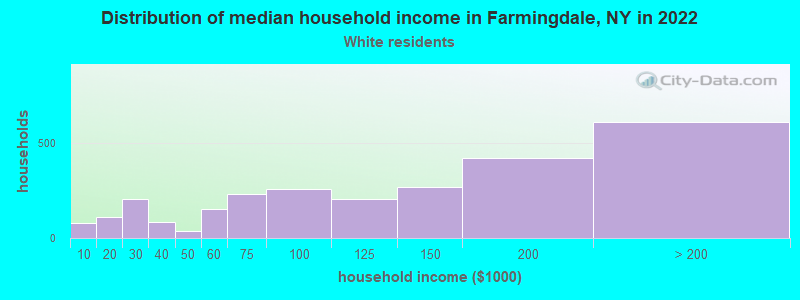
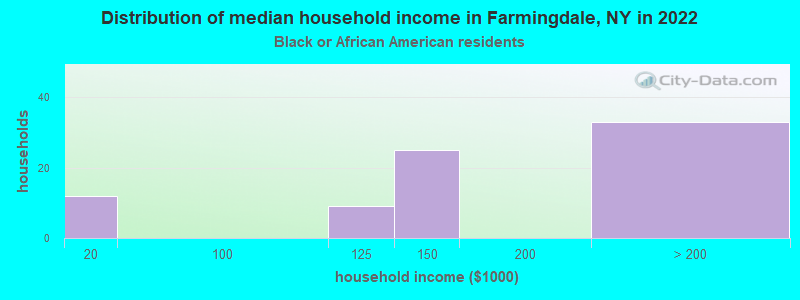
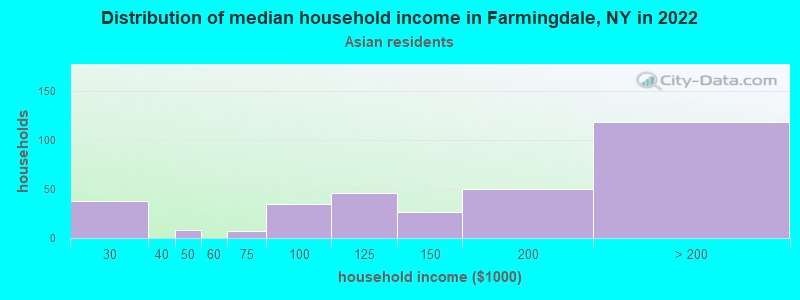
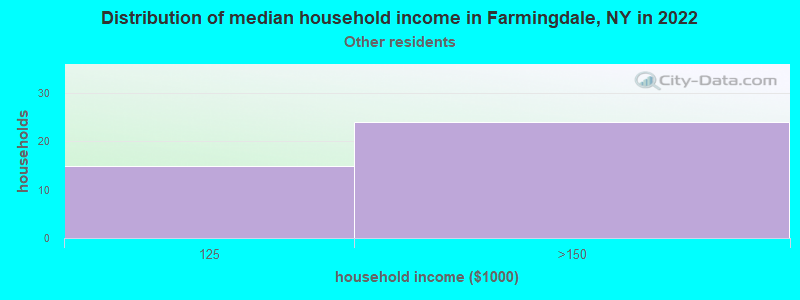
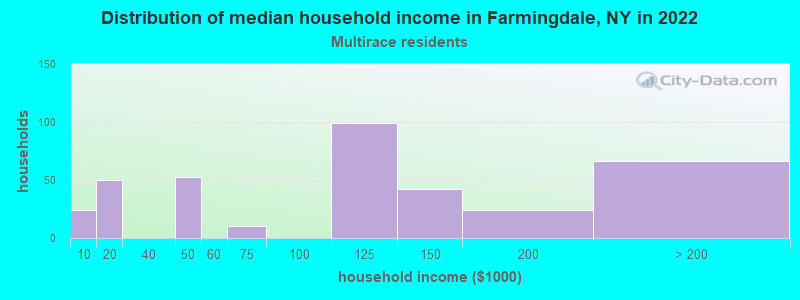
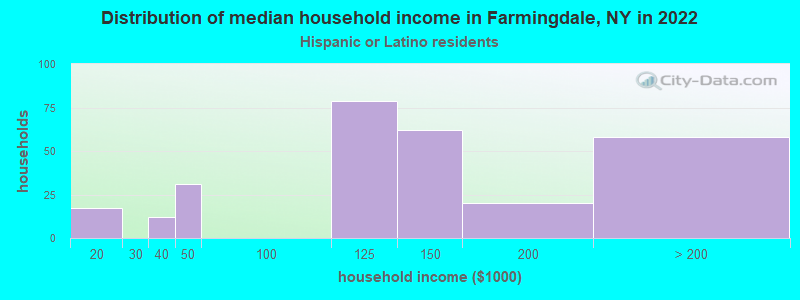
Income and house value in Farmingdale Median household income in 2022 $115,813 White non-Hispanic householders$150,408 Asian householders$113,652 Two or more races householders$117,988 Hispanic or Latino race householdersMedian 2022 house value $561,628 White Non-Hispanic householders$600,315 Black or African American householders $581,372 Asian householders$546,954 Some other race householders$620,326 Hispanic or Latino householders
Median age by race in Farmingdale
53.7 Median age for White residents52.8 56.3 42.4 Median age for Black or African American residents33.3 55.1 -855,158,729.3 Median age for American Indian / Alaska Native residents-607,543,322.5 -837,121,211.3 33.8 Median age for Asian residents37.1 32.8 -487,992,314.6 Median age for Native Hawaiian / Pacific Islander residents-477,502,295.2 -497,387,669.3 28.3 Median age for Other race residents3.1 32.4 39.1 Median age for Two or more races residents33.3 50.3 53.2 Median age for White alone residents51.7 56.4 37.0 Median age for Hispanic or Latino residents40.3 29.4
Owner/renter occupied households by race in Farmingdale
House owners and renters - White residents 1,854 67.9% Owner occupied875 32.1% Renter occupiedHouse owners and renters - Black or African American residents 59 74.6% Owner occupied20 25.4% Renter occupiedHouse owners and renters - Asian residents 251 76.4% Owner occupied78 23.6% Renter occupiedHouse owners and renters - Other race residents 23 61.3% Owner occupied14 38.7% Renter occupiedHouse owners and renters - Two or more races residents 217 60.8% Owner occupied140 39.2% Renter occupiedHouse owners and renters - White alone residents 1,861 66.4% Owner occupied942 33.6% Renter occupiedHouse owners and renters - Hispanic or Latino residents 193 65.9% Owner occupied100 34.1% Renter occupied
Language usage in Farmingdale
English speakers - Total 81.5% of residents of Farmingdale speak English at home.
7.6% of residents speak Spanish at home 417 69.2% Speak English very well186 30.8% Speak English less than very well10.3% of residents speak other language at home 572 69.9% Speak English very well246 30.1% Speak English less than very well
English speakers - Born in the United States 94.0% of residents of Farmingdale speak English at home.
4.1% of residents speak other language at home 11 100.0% Speak English very well
English speakers - Native, born elsewhere 4.2% of residents of Farmingdale speak English at home.
16.9% of residents speak Spanish at home 12 100.0% Speak English very well83.1% of residents speak other language at home 59 100.0% Speak English very well
English speakers - Foreign-born 23.5% of residents of Farmingdale speak English at home.
20.8% of residents speak Spanish at home 57 24.7% Speak English very well174 75.3% Speak English less than very well56.9% of residents speak other language at home 414 65.6% Speak English very well217 34.4% Speak English less than very well
White (Caucasian) - Speak only English Native:
99.7% (5,333)Foreign-born:
47.9% (57)
White (Caucasian) - Speak another language Native:
1.7% (89)Foreign-born:
56.1% (67)
Black or African American - Speak only English Native:
92.1% (158)Foreign-born:
37.7% (54)
Black or African American - Speak another language Native:
7.6% (13)Foreign-born:
62.8% (89)
Asian - Speak only English Native:
47.4% (90)Foreign-born:
15.6% (84)
Asian - Speak another language Native:
52.5% (99)Foreign-born:
83.5% (453)
Other race - Speak another language Native:
93.8% (57)Foreign-born:
100.0% (26)
Two or more races - Speak only English Native:
57.2% (617)Foreign-born:
20.2% (78)
Two or more races - Speak another language Native:
44.9% (484)Foreign-born:
79.5% (309)
White alone - Speak only English Native:
98.7% (5,227)Foreign-born:
39.3% (60)
White alone - Speak another language Native:
1.7% (89)Foreign-born:
60.5% (93)
Hispanic or Latino - Speak only English Native:
53.8% (455)Foreign-born:
21.6% (64)
Hispanic or Latino - Speak another language Native:
46.0% (389)Foreign-born:
78.4% (231)
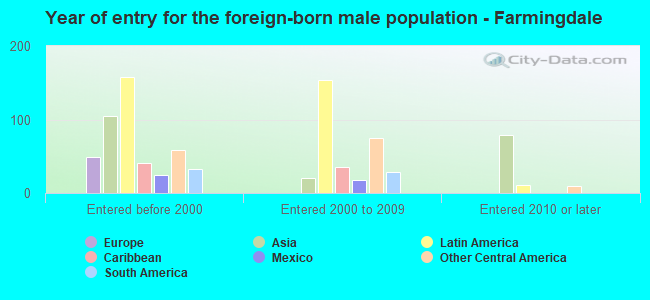
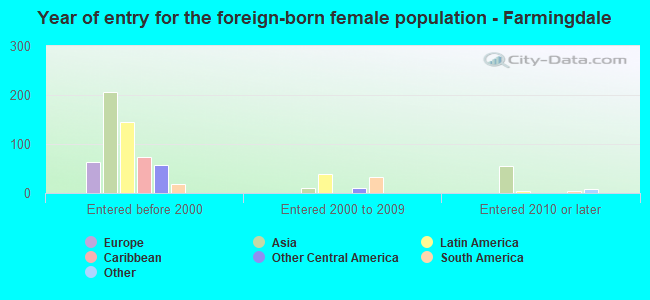
Foreign-born residents in Farmingdale 1,091 residents are foreign born (6.4% Latin America , 5.2% Asia , 1.4% Europe ).
This city:
13.0%New York:
22.6%
Marital status for residents in Farmingdale Marital status - White (Caucasian) population 15 years and over
Males 34.1% Never married49.2% Now married2.6% Separated4.3% Widowed9.7% DivorcedFemales 26.7% Never married40.6% Now married2.2% Separated13.1% Widowed17.4% DivorcedWomen who gave birth in the past 12 months Now married:
100.0% (66)Unmarried:
0.0% (0)
Women who did not give birth in the past 12 months Now married:
41.3% (375)Unmarried:
58.7% (534)
Marital status - Black or African American population 15 years and over
Males 44.7% Never married45.3% Now married0.0% Separated0.0% Widowed10.0% DivorcedFemales 4.5% Never married52.8% Now married13.5% Separated20.2% Widowed9.0% DivorcedWomen who did not give birth in the past 12 months Now married:
0.0% (0)Unmarried:
100.0% (8)
Marital status - Asian population 15 years and over
Males 20.9% Never married63.4% Now married0.0% Separated0.0% Widowed15.7% DivorcedFemales 28.4% Never married63.9% Now married7.8% Separated0.0% Widowed0.0% DivorcedWomen who gave birth in the past 12 months Now married:
100.0% (34)Unmarried:
0.0% (0)
Women who did not give birth in the past 12 months Now married:
56.2% (134)Unmarried:
43.8% (105)
Marital status - Other race population 15 years and over
Males 0.0% Never married100.0% Now married0.0% Separated0.0% Widowed0.0% DivorcedFemales 9.1% Never married70.5% Now married0.0% Separated20.5% Widowed0.0% DivorcedWomen who gave birth in the past 12 months Now married:
100.0% (23)Unmarried:
0.0% (0)
Women who did not give birth in the past 12 months Now married:
45.8% (13)Unmarried:
54.2% (15)
Marital status - Two or more races population 15 years and over
Males 62.2% Never married25.3% Now married0.0% Separated4.9% Widowed7.7% DivorcedFemales 21.4% Never married53.0% Now married6.0% Separated6.6% Widowed13.0% DivorcedWomen who did not give birth in the past 12 months Now married:
47.6% (30)Unmarried:
52.4% (33)
Marital status - White alone, not Hispanic / Latino population 15 years and over
Males 34.9% Never married48.3% Now married2.7% Separated4.5% Widowed9.7% DivorcedFemales 26.6% Never married40.0% Now married2.3% Separated13.4% Widowed17.8% DivorcedWomen who gave birth in the past 12 months Now married:
100.0% (71)Unmarried:
0.0% (0)
Women who did not give birth in the past 12 months Now married:
40.8% (381)Unmarried:
59.2% (552)
Marital status - Hispanic or Latino population 15 years and over
Males 47.0% Never married38.2% Now married0.0% Separated4.8% Widowed10.0% DivorcedFemales 24.0% Never married64.2% Now married0.0% Separated9.0% Widowed2.9% DivorcedWomen who gave birth in the past 12 months Now married:
100.0% (20)Unmarried:
0.0% (0)
Women who did not give birth in the past 12 months Now married:
50.0% (32)Unmarried:
50.0% (32)
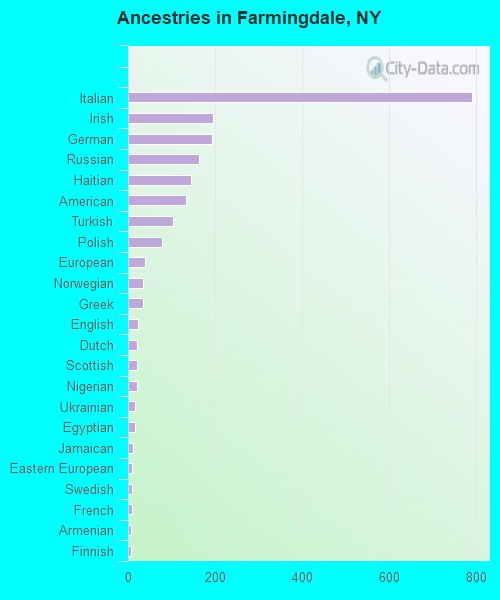
Ancestries in Farmingdale
790 23.8% Italian196 5.9% Irish194 5.9% German162 4.9% Russian144 4.3% Haitian134 4.0% American103 3.1% Turkish78 2.4% Polish40 1.2% European35 1.1% Norwegian34 1.0% Greek23 0.7% English21 0.6% Dutch20 0.6% Scottish20 0.6% Nigerian16 0.5% Ukrainian15 0.5% Egyptian11 0.3% Jamaican10 0.3% Eastern European10 0.3% Swedish9 0.3% French8 0.2% Armenian8 0.2% Finnish5 0.2% Slovene5 0.2% Barbadian4 0.1% Slavic
Children Nativity (place of birth) in Farmingdale
Children under 6 years - Living with two parents Both parents native 303 100.0% NativeBoth parents foreign-born 114 100.0% NativeOne native, one foreign-born parent 61 100.0% NativeChildren under 6 years - Living with one parent Native parent 23 100.0% NativeChildren 6 to 17 years - Living with two parents Both parents native 498 100.0% NativeBoth parents foreign-born 76 100.0% NativeOne native, one foreign-born parent 57 100.0% NativeChildren 6 to 17 years - Living with one parent Native parent 169 100.0% NativeForeign-born parent 147 47.2% Native165 52.8% Foreign-born
Grandparents responsible for own grandchildren in Farmingdale
Grandparents (30 to 59 years) White / Caucasian 38 100.0% Responsible for grandchildrenWhite alone, not Hispanic / Latino 41 100.0% Responsible for grandchildren
Grandparents (60 years and over) White / Caucasian 38 100.0% Not responsible for grandchildrenWhite alone, not Hispanic / Latino 39 100.0% Not responsible for grandchildren