Races in Farmington Hills, Michigan (MI) Detailed Stats
Data:
Races - White alone (%)
Races - White alone (% change since 2000)
Races - Black alone (%)
Races - Black alone (% change since 2000)
Races - American Indian alone (%)
Races - American Indian alone (% change since 2000)
Races - Asian alone (%)
Races - Asian alone (% change since 2000)
Races - Hispanic (%)
Races - Hispanic (% change since 2000)
Races - Native Hawaiian and Other Pacific Islander alone (%)
Races - Native Hawaiian and Other Pacific Islander alone (% change since 2000)
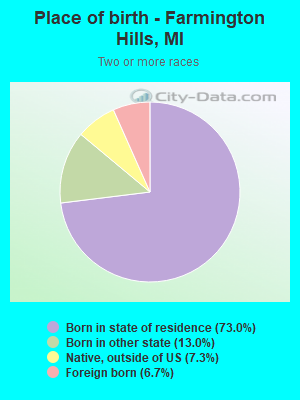
Races - Two or more races(%)
Races - Two or more races(% change since 2000)
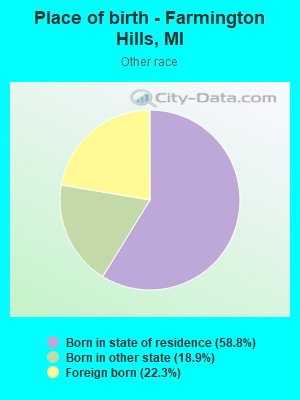
Races - Other race alone (%)
Races - Other race alone (% change since 2000)
Racial diversity
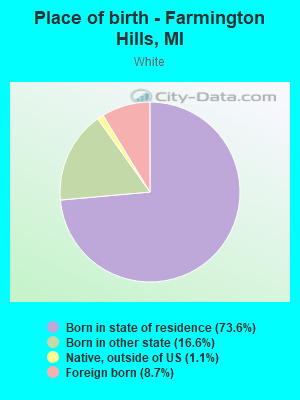
Place of birth - Born in state of residence (%)
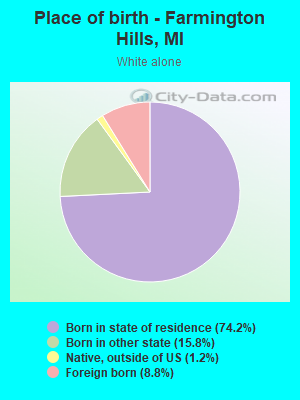
Place of birth - Born in state of residence (%) - White
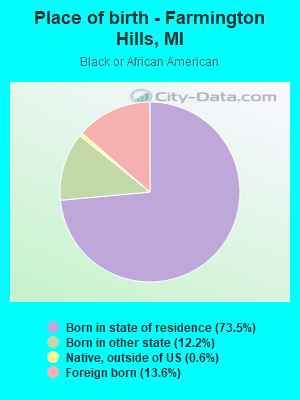
Place of birth - Born in state of residence (%) - Black or African American
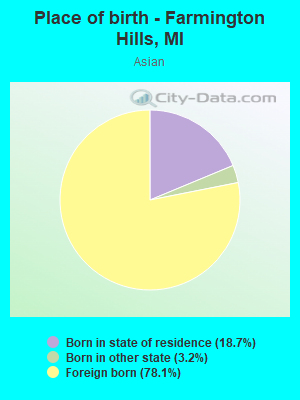
Place of birth - Born in state of residence (%) - Asian
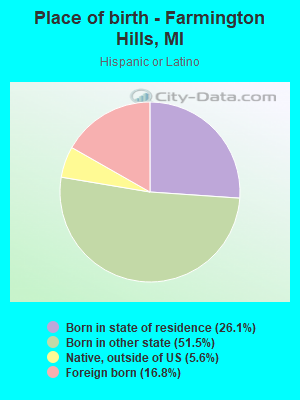
Place of birth - Born in state of residence (%) - Hispanic or Latino
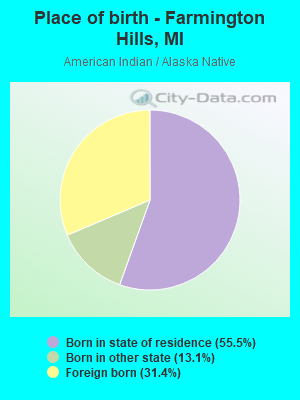
Place of birth - Born in state of residence (%) - American Indian and Alaska Native
Place of birth - Born in state of residence (%) - Multirace
Place of birth - Born in state of residence (%) - Other Race
Place of birth - Born in other state (%)
Place of birth - Born in other state (%) - White
Place of birth - Born in other state (%) - Black or African American
Place of birth - Born in other state (%) - Asian
Place of birth - Born in other state (%) - Hispanic or Latino
Place of birth - Born in other state (%) - American Indian and Alaska Native
Place of birth - Born in other state (%) - Multirace
Place of birth - Born in other state (%) - Other Race
Place of birth - Native, outside of US (%)
Place of birth - Native, outside of US (%) - White
Place of birth - Native, outside of US (%) - Black or African American
Place of birth - Native, outside of US (%) - Asian
Place of birth - Native, outside of US (%) - Hispanic or Latino
Place of birth - Native, outside of US (%) - American Indian and Alaska Native
Place of birth - Native, outside of US (%) - Multirace
Place of birth - Native, outside of US (%) - Other Race
Place of birth - Foreign born (%)
Place of birth - Foreign born (%) - White
Place of birth - Foreign born (%) - Black or African American
Place of birth - Foreign born (%) - Asian
Place of birth - Foreign born (%) - Hispanic or Latino
Place of birth - Foreign born (%) - American Indian and Alaska Native
Place of birth - Foreign born (%) - Multirace
Place of birth - Foreign born (%) - Other Race
Residents speaking English at home (%)
Residents speaking English at home - Born in the United States (%)
Residents speaking English at home - Native, born elsewhere (%)
Residents speaking English at home - Foreign born (%)
Residents speaking Spanish at home (%)
Residents speaking Spanish at home - Born in the United States (%)
Residents speaking Spanish at home - Native, born elsewhere (%)
Residents speaking Spanish at home - Foreign born (%)
Residents speaking other language at home (%)
Residents speaking other language at home - Born in the United States (%)
Residents speaking other language at home - Native, born elsewhere (%)
Residents speaking other language at home - Foreign born (%)
Marital status - Never married (%)
Marital status - Now married (%)
Marital status - Separated (%)
Marital status - Widowed (%)
Marital status - Divorced (%)
Ancestries Reported - Arab (%)
Ancestries Reported - Czech (%)
Ancestries Reported - Danish (%)
Ancestries Reported - Dutch (%)
Ancestries Reported - English (%)
Ancestries Reported - French (%)
Ancestries Reported - French Canadian (%)
Ancestries Reported - German (%)
Ancestries Reported - Greek (%)
Ancestries Reported - Hungarian (%)
Ancestries Reported - Irish (%)
Ancestries Reported - Italian (%)
Ancestries Reported - Lithuanian (%)
Ancestries Reported - Norwegian (%)
Ancestries Reported - Polish (%)
Ancestries Reported - Portuguese (%)
Ancestries Reported - Russian (%)
Ancestries Reported - Scotch-Irish (%)
Ancestries Reported - Scottish (%)
Ancestries Reported - Slovak (%)
Ancestries Reported - Subsaharan African (%)
Ancestries Reported - Swedish (%)
Ancestries Reported - Swiss (%)
Ancestries Reported - Ukrainian (%)
Ancestries Reported - United States (%)
Ancestries Reported - Welsh (%)
Ancestries Reported - West Indian (%)
Ancestries Reported - Other (%)
Geographical mobility - Same house 1 year ago (%)
Geographical mobility - Same house 1 year ago (%) - White
Geographical mobility - Same house 1 year ago (%) - Black or African American
Geographical mobility - Same house 1 year ago (%) - Asian
Geographical mobility - Same house 1 year ago (%) - Hispanic or Latino
Geographical mobility - Same house 1 year ago (%) - American Indian and Alaska Native
Geographical mobility - Same house 1 year ago (%) - Multirace
Geographical mobility - Same house 1 year ago (%) - Other Race
Geographical mobility - Moved within same county (%)
Geographical mobility - Moved within same county (%) - White
Geographical mobility - Moved within same county (%) - Black or African American
Geographical mobility - Moved within same county (%) - Asian
Geographical mobility - Moved within same county (%) - Hispanic or Latino
Geographical mobility - Moved within same county (%) - American Indian and Alaska Native
Geographical mobility - Moved within same county (%) - Multirace
Geographical mobility - Moved within same county (%) - Other Race
Geographical mobility - Moved from different county within same state (%)
Geographical mobility - Moved from different county within same state (%) - White
Geographical mobility - Moved from different county within same state (%) - Black or African American
Geographical mobility - Moved from different county within same state (%) - Asian
Geographical mobility - Moved from different county within same state (%) - Hispanic or Latino
Geographical mobility - Moved from different county within same state (%) - American Indian and Alaska Native
Geographical mobility - Moved from different county within same state (%) - Multirace
Geographical mobility - Moved from different county within same state (%) - Other Race
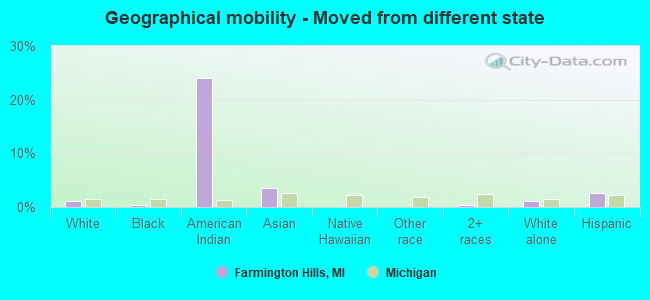
Geographical mobility - Moved from different state (%)
Geographical mobility - Moved from different state (%) - White
Geographical mobility - Moved from different state (%) - Black or African American
Geographical mobility - Moved from different state (%) - Asian
Geographical mobility - Moved from different state (%) - Hispanic or Latino
Geographical mobility - Moved from different state (%) - American Indian and Alaska Native
Geographical mobility - Moved from different state (%) - Multirace
Geographical mobility - Moved from different state (%) - Other Race
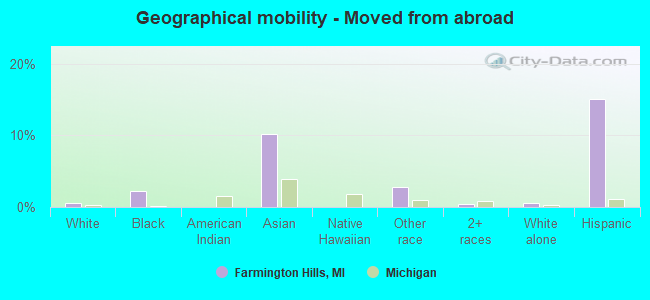
Geographical mobility - Moved from abroad (%)
Geographical mobility - Moved from abroad (%) - White
Geographical mobility - Moved from abroad (%) - Black or African American
Geographical mobility - Moved from abroad (%) - Asian
Geographical mobility - Moved from abroad (%) - Hispanic or Latino
Geographical mobility - Moved from abroad (%) - American Indian and Alaska Native
Geographical mobility - Moved from abroad (%) - Multirace
Geographical mobility - Moved from abroad (%) - Other Race
Place of birth for the foreign-born population - Ireland (%)
Place of birth for the foreign-born population - Denmark (%)
Place of birth for the foreign-born population - Norway (%)
Place of birth for the foreign-born population - Sweden (%)
Place of birth for the foreign-born population - United Kingdom (%)
Place of birth for the foreign-born population - England (%)
Place of birth for the foreign-born population - Scotland (%)
Place of birth for the foreign-born population - Other Northern Europe (%)
Place of birth for the foreign-born population - Austria (%)
Place of birth for the foreign-born population - Belgium (%)
Place of birth for the foreign-born population - France (%)
Place of birth for the foreign-born population - Germany (%)
Place of birth for the foreign-born population - Netherlands (%)
Place of birth for the foreign-born population - Switzerland (%)
Place of birth for the foreign-born population - Other Western Europe (%)
Place of birth for the foreign-born population - Greece (%)
Place of birth for the foreign-born population - Italy (%)
Place of birth for the foreign-born population - Portugal (%)
Place of birth for the foreign-born population - Spain (%)
Place of birth for the foreign-born population - Other Southern Europe (%)
Place of birth for the foreign-born population - Albania (%)
Place of birth for the foreign-born population - Belarus (%)
Place of birth for the foreign-born population - Bosnia and Herzegovina (%)
Place of birth for the foreign-born population - Bulgaria (%)
Place of birth for the foreign-born population - Croatia (%)
Place of birth for the foreign-born population - Czechoslovakia (%)
Place of birth for the foreign-born population - Hungary (%)
Place of birth for the foreign-born population - Latvia (%)
Place of birth for the foreign-born population - Lithuania (%)
Place of birth for the foreign-born population - North Macedonia (Macedonia) (%)
Place of birth for the foreign-born population - Moldova (%)
Place of birth for the foreign-born population - Poland (%)
Place of birth for the foreign-born population - Romania (%)
Place of birth for the foreign-born population - Russia (%)
Place of birth for the foreign-born population - Serbia (%)
Place of birth for the foreign-born population - Ukraine (%)
Place of birth for the foreign-born population - Other Eastern Europe (%)
Place of birth for the foreign-born population - China (%)
Place of birth for the foreign-born population - Hong Kong (%)
Place of birth for the foreign-born population - Taiwan (%)
Place of birth for the foreign-born population - Japan (%)
Place of birth for the foreign-born population - Korea (%)
Place of birth for the foreign-born population - Other Eastern Asia (%)
Place of birth for the foreign-born population - Afghanistan (%)
Place of birth for the foreign-born population - Bangladesh (%)
Place of birth for the foreign-born population - India (%)
Place of birth for the foreign-born population - Iran (%)
Place of birth for the foreign-born population - Kazakhstan (%)
Place of birth for the foreign-born population - Nepal (%)
Place of birth for the foreign-born population - Pakistan (%)
Place of birth for the foreign-born population - Sri Lanka (%)
Place of birth for the foreign-born population - Uzbekistan (%)
Place of birth for the foreign-born population - Other South Central Asia (%)
Place of birth for the foreign-born population - Burma (%)
Place of birth for the foreign-born population - Cambodia (%)
Place of birth for the foreign-born population - Indonesia (%)
Place of birth for the foreign-born population - Laos (%)
Place of birth for the foreign-born population - Malaysia (%)
Place of birth for the foreign-born population - Philippines (%)
Place of birth for the foreign-born population - Singapore (%)
Place of birth for the foreign-born population - Thailand (%)
Place of birth for the foreign-born population - Vietnam (%)
Place of birth for the foreign-born population - Other South Eastern Asia (%)
Place of birth for the foreign-born population - Armenia (%)
Place of birth for the foreign-born population - Iraq (%)
Place of birth for the foreign-born population - Israel (%)
Place of birth for the foreign-born population - Jordan (%)
Place of birth for the foreign-born population - Kuwait (%)
Place of birth for the foreign-born population - Lebanon (%)
Place of birth for the foreign-born population - Saudi Arabia (%)
Place of birth for the foreign-born population - Syria (%)
Place of birth for the foreign-born population - Turkey (%)
Place of birth for the foreign-born population - Yemen (%)
Place of birth for the foreign-born population - Other Western Asia (%)
Place of birth for the foreign-born population - Eritrea (%)
Place of birth for the foreign-born population - Ethiopia (%)
Place of birth for the foreign-born population - Kenya (%)
Place of birth for the foreign-born population - Somalia (%)
Place of birth for the foreign-born population - Uganda (%)
Place of birth for the foreign-born population - Zimbabwe (%)
Place of birth for the foreign-born population - Other Eastern Africa (%)
Place of birth for the foreign-born population - Cameroon (%)
Place of birth for the foreign-born population - Congo (%)
Place of birth for the foreign-born population - Democratic Republic of Congo (Zaire) (%)
Place of birth for the foreign-born population - Other Middle Africa (%)
Place of birth for the foreign-born population - Egypt (%)
Place of birth for the foreign-born population - Morocco (%)
Place of birth for the foreign-born population - Sudan (%)
Place of birth for the foreign-born population - Other Northern Africa (%)
Place of birth for the foreign-born population - South Africa (%)
Place of birth for the foreign-born population - Other Southern Africa (%)
Place of birth for the foreign-born population - Cabo Verde (%)
Place of birth for the foreign-born population - Ghana (%)
Place of birth for the foreign-born population - Liberia (%)
Place of birth for the foreign-born population - Nigeria (%)
Place of birth for the foreign-born population - Senegal (%)
Place of birth for the foreign-born population - Sierra Leone (%)
Place of birth for the foreign-born population - Other Western Africa (%)
Place of birth for the foreign-born population - Australia (%)
Place of birth for the foreign-born population - New Zealand (%)
Place of birth for the foreign-born population - Fiji (%)
Place of birth for the foreign-born population - Micronesia (%)
Place of birth for the foreign-born population - Bahamas (%)
Place of birth for the foreign-born population - Barbados (%)
Place of birth for the foreign-born population - Cuba (%)
Place of birth for the foreign-born population - Dominica (%)
Place of birth for the foreign-born population - Dominican Republic (%)
Place of birth for the foreign-born population - Grenada (%)
Place of birth for the foreign-born population - Haiti (%)
Place of birth for the foreign-born population - Jamaica (%)
Place of birth for the foreign-born population - St. Vincent and the Grenadines (%)
Place of birth for the foreign-born population - Trinidad and Tobago (%)
Place of birth for the foreign-born population - West Indies (%)
Place of birth for the foreign-born population - Other Caribbean (%)
Place of birth for the foreign-born population - Belize (%)
Place of birth for the foreign-born population - Costa Rica (%)
Place of birth for the foreign-born population - El Salvador (%)
Place of birth for the foreign-born population - Guatemala (%)
Place of birth for the foreign-born population - Honduras (%)
Place of birth for the foreign-born population - Mexico (%)
Place of birth for the foreign-born population - Nicaragua (%)
Place of birth for the foreign-born population - Panama (%)
Place of birth for the foreign-born population - Other Central America (%)
Place of birth for the foreign-born population - Argentina (%)
Place of birth for the foreign-born population - Bolivia (%)
Place of birth for the foreign-born population - Brazil (%)
Place of birth for the foreign-born population - Chile (%)
Place of birth for the foreign-born population - Colombia (%)
Place of birth for the foreign-born population - Ecuador (%)
Place of birth for the foreign-born population - Guyana (%)
Place of birth for the foreign-born population - Peru (%)
Place of birth for the foreign-born population - Uruguay (%)
Place of birth for the foreign-born population - Venezuela (%)
Place of birth for the foreign-born population - Other South America (%)
Place of birth for the foreign-born population - Canada (%)
Place of birth for the foreign-born population - Other Northern America (%)
Place of birth for the foreign-born population - Other (%)
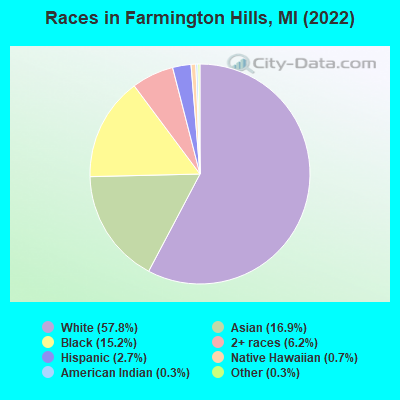
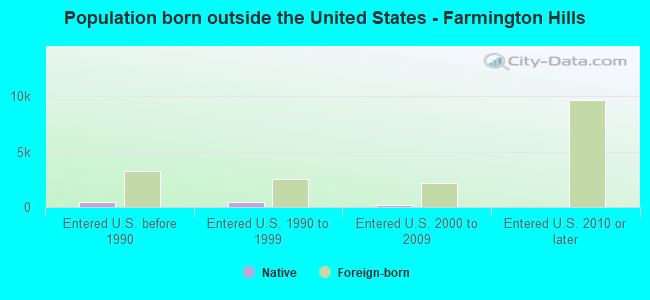
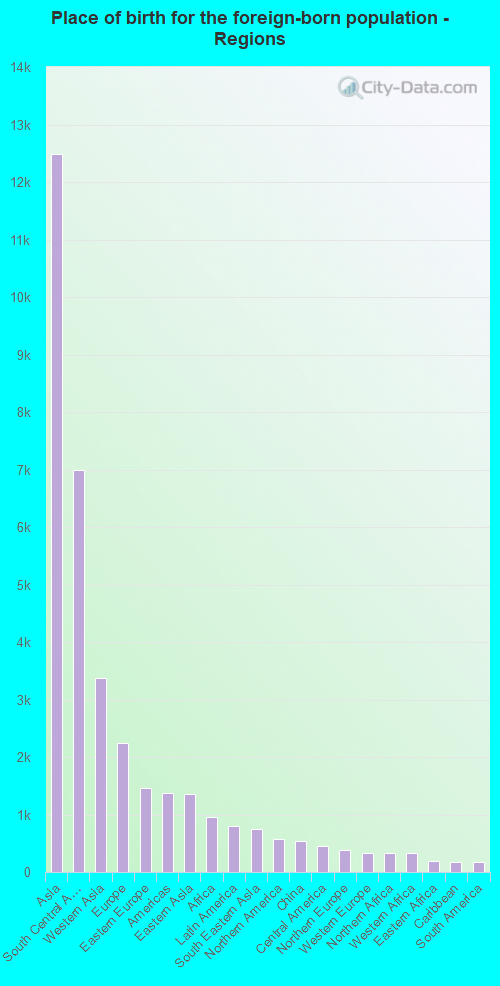
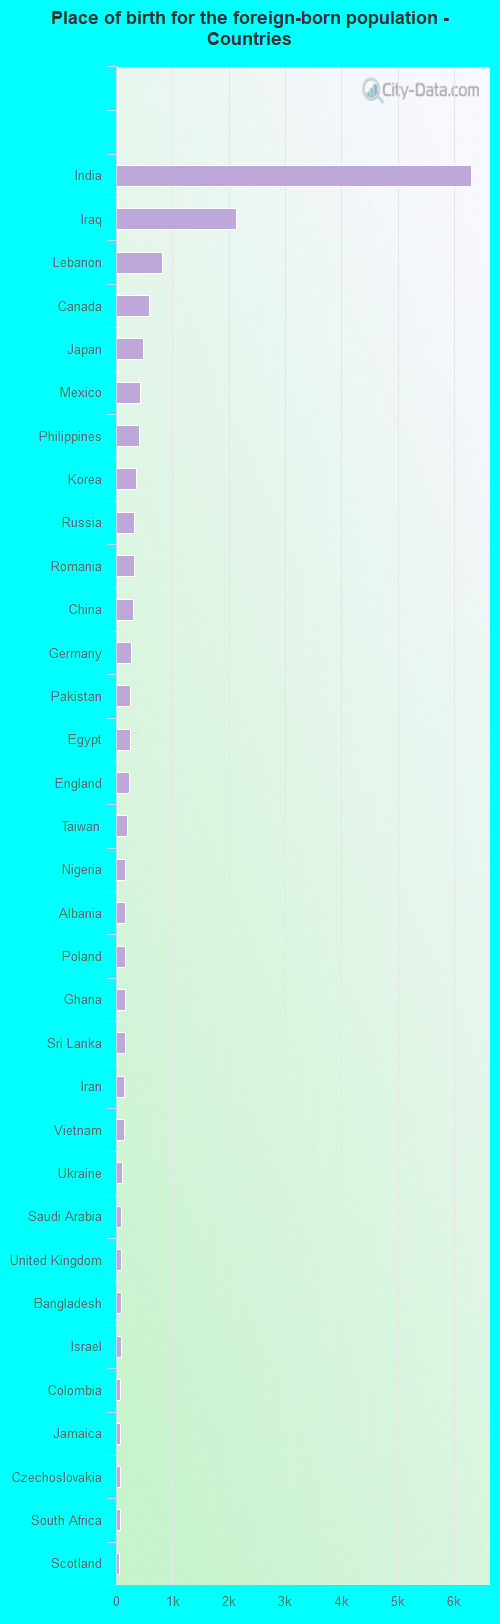
According to 2022 data, the most numerous races in Farmington Hills, MI are White alone (47,828 residents), Black alone (12,551 residents), and Hispanic (2,196 residents). 74.3% of Farmington Hills residents speak English at home. 20.5% of Farmington Hills, MI residents are foreign-born (14.9% born in Asia, 2.7% born in Europe), which is 70.8% greater than the foreign-born rate of 6.0% across the entire state of Michigan.
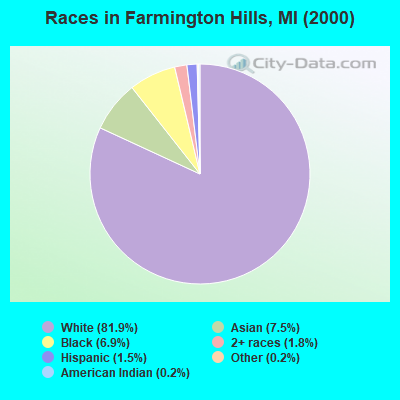
Race distribution in Farmington Hills
2000 2022
67,250 81.9% White alone 6,184 7.5% Asian alone 5,681 6.9% Black alone 1,494 1.8% Two or more races 1,211 1.5% Hispanic 145 0.2% Other race alone 132 0.2% American Indian alone 14 0.02% Native Hawaiian and Other
47,828 57.8% White alone 13,979 16.9% Asian alone 12,551 15.2% Black alone 5,161 6.2% Two or more races 2,196 2.7% Hispanic 544 0.7% Native Hawaiian and Other 227 0.3% Other race alone 252 0.3% American Indian alone
2000 2022
7,806,691 78.6% White alone 1,402,047 14.1% Black alone 323,877 3.3% Hispanic 175,311 1.8% Asian alone 163,487 1.6% Two or more races 53,421 0.5% American Indian alone 11,465 0.1% Other race alone 2,145 0.02% Native Hawaiian and Other
7,289,051 72.6% White alone 1,310,464 13.1% Black alone 572,405 5.7% Hispanic 450,031 4.5% Two or more races 335,732 3.3% Asian alone 45,217 0.5% Other race alone 29,011 0.3% American Indian alone 2,207 0.02% Native Hawaiian and Other
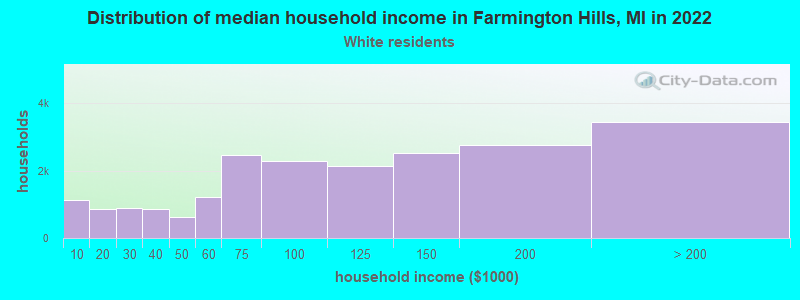
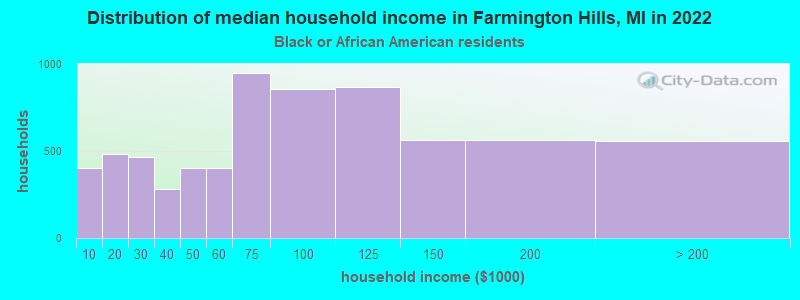
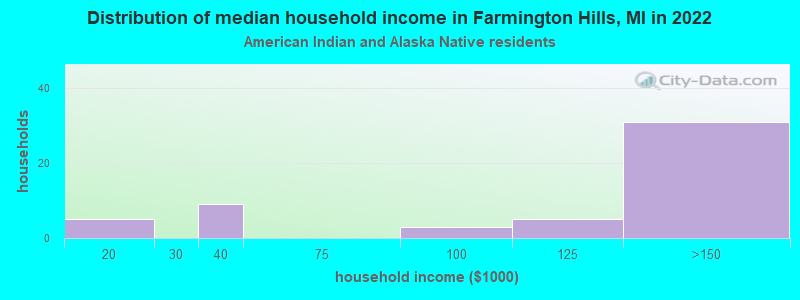
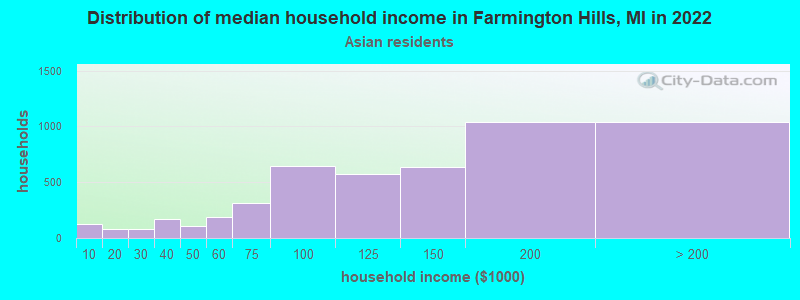
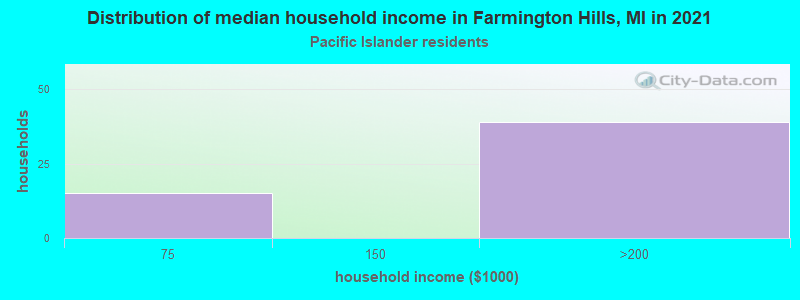
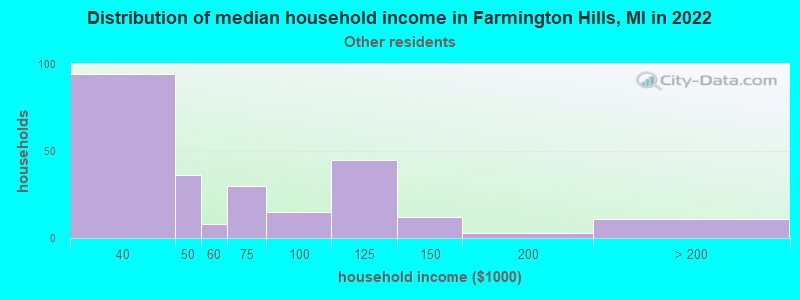
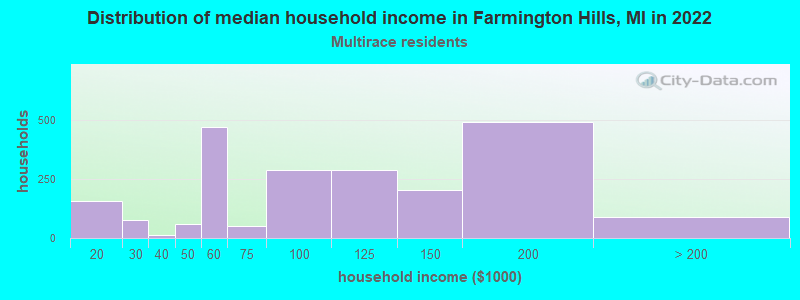
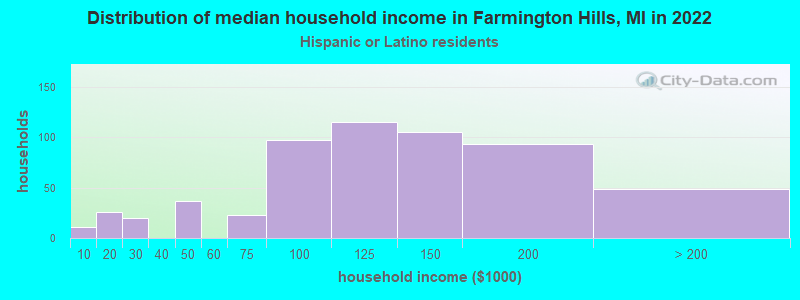
Income and house value in Farmington Hills Median household income in 2022 $105,379 White non-Hispanic householders$85,547 Black householders$124,755 Asian householders$111,494 Some other race householders$103,311 Two or more races householders$99,874 Hispanic or Latino race householdersMedian 2022 house value $344,160 White Non-Hispanic householders$416,265 Black or African American householders$223,881 American Indian or Alaska Native householders $400,053 Asian householders$265,106 Some other race householders$362,070 Two or more races householders$371,797 Hispanic or Latino householders
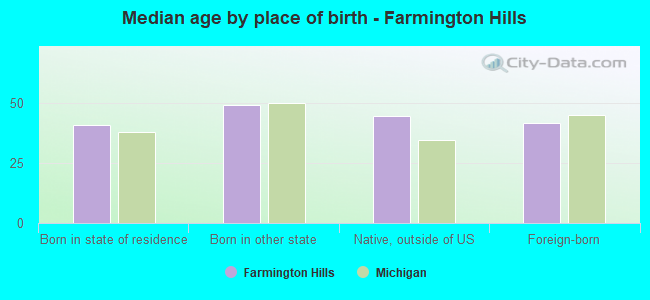
Median age by race in Farmington Hills
46.9 Median age for White residents44.6 50.7 47.7 Median age for Black or African American residents44.9 50.2 29.3 Median age for American Indian / Alaska Native residents-666,666,666.0 -666,666,666.0 34.2 Median age for Asian residents35.0 33.3 -666,666,666.0 Median age for Native Hawaiian / Pacific Islander residents4.0 -666,666,666.0 59.3 Median age for Other race residents28.6 65.4 14.9 Median age for Two or more races residents14.2 23.7 47.3 Median age for White alone residents44.7 51.3 26.2 Median age for Hispanic or Latino residents27.3 26.0
Owner/renter occupied households by race in Farmington Hills
House owners and renters - White residents 17,034 80.4% Owner occupied4,152 19.6% Renter occupiedHouse owners and renters - Black or African American residents 2,832 49.1% Owner occupied2,936 50.9% Renter occupiedHouse owners and renters - American Indian / Alaska Native residents 7 13.6% Owner occupied42 86.4% Renter occupiedHouse owners and renters - Asian residents 2,307 41.3% Owner occupied3,274 58.7% Renter occupiedHouse owners and renters - Native Hawaiian / Pacific Islander residents 66 100.0% Renter occupiedHouse owners and renters - Other race residents 55 13.6% Owner occupied347 86.4% Renter occupiedHouse owners and renters - Two or more races residents 529 35.5% Owner occupied963 64.5% Renter occupiedHouse owners and renters - White alone residents 16,892 81.3% Owner occupied3,895 18.7% Renter occupiedHouse owners and renters - Hispanic or Latino residents 391 45.3% Owner occupied472 54.7% Renter occupied
Language usage in Farmington Hills
English speakers - Total 74.3% of residents of Farmington Hills speak English at home.
2.1% of residents speak Spanish at home 1,365 84.7% Speak English very well247 15.3% Speak English less than very well23.6% of residents speak other language at home 13,477 74.4% Speak English very well4,639 25.6% Speak English less than very well
English speakers - Born in the United States 93.3% of residents of Farmington Hills speak English at home.
2.2% of residents speak Spanish at home 192 78.4% Speak English very well53 21.6% Speak English less than very well4.5% of residents speak other language at home 497 100.0% Speak English very well
English speakers - Native, born elsewhere 67.9% of residents of Farmington Hills speak English at home.
9.7% of residents speak Spanish at home 106 100.0% Speak English very well22.4% of residents speak other language at home 102 41.5% Speak English very well144 58.5% Speak English less than very well
English speakers - Foreign-born 11.9% of residents of Farmington Hills speak English at home.
4.6% of residents speak Spanish at home 747 92.9% Speak English very well57 7.1% Speak English less than very well83.5% of residents speak other language at home 10,387 71.4% Speak English very well4,158 28.6% Speak English less than very well
White (Caucasian) - Speak only English Native:
94.2% (39,498)Foreign-born:
17.7% (727)
White (Caucasian) - Speak another language Native:
5.8% (2,444)Foreign-born:
82.3% (3,382)
Black or African American - Speak only English Native:
98.8% (12,823)Foreign-born:
16.4% (170)
Black or African American - Speak another language Native:
1.2% (154)Foreign-born:
90.1% (931)
American Indian / Alaska Native - Speak only English Native:
92.4% (127)Foreign-born:
91.6% (72)
Asian - Speak only English Native:
46.8% (789)Foreign-born:
8.1% (881)
Asian - Speak another language Native:
53.2% (896)Foreign-born:
91.9% (10,036)
Other race - Speak only English Native:
85.3% (424)Foreign-born:
2.5% (3)
Other race - Speak another language Native:
8.7% (43)Foreign-born:
100.0% (135)
Two or more races - Speak only English Native:
86.9% (4,535)Foreign-born:
15.5% (105)
Two or more races - Speak another language Native:
13.1% (686)Foreign-born:
84.1% (570)
White alone - Speak only English Native:
94.2% (38,984)Foreign-born:
17.7% (727)
White alone - Speak another language Native:
5.8% (2,395)Foreign-born:
82.3% (3,382)
Hispanic or Latino - Speak only English Native:
77.4% (935)Foreign-born:
8.2% (61)
Hispanic or Latino - Speak another language Native:
20.8% (252)Foreign-born:
91.0% (674)
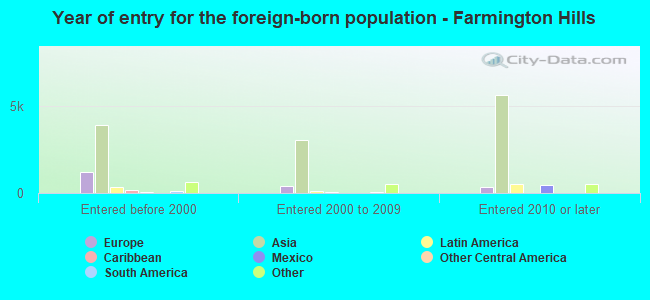
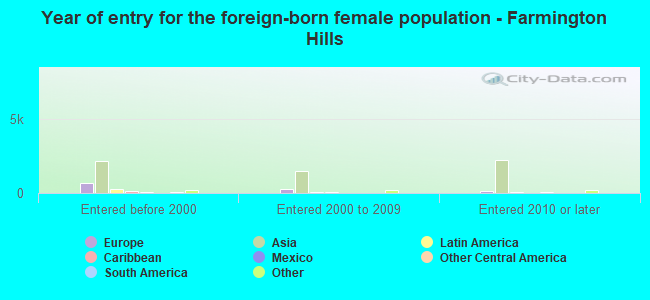
Foreign-born residents in Farmington Hills 17,112 residents are foreign born (14.9% Asia , 2.7% Europe ).
This city:
20.5%Michigan:
6.9%
Marital status for residents in Farmington Hills Marital status - White (Caucasian) population 15 years and over
Males 31.2% Never married55.0% Now married0.0% Separated2.8% Widowed11.0% DivorcedFemales 31.4% Never married49.7% Now married0.2% Separated7.6% Widowed11.1% DivorcedWomen who gave birth in the past 12 months Now married:
64.3% (551)Unmarried:
35.7% (306)
Women who did not give birth in the past 12 months Now married:
40.6% (3,754)Unmarried:
59.4% (5,484)
Marital status - Black or African American population 15 years and over
Males 39.2% Never married38.5% Now married0.0% Separated1.0% Widowed21.3% DivorcedFemales 38.6% Never married36.2% Now married0.0% Separated5.3% Widowed19.9% DivorcedWomen who gave birth in the past 12 months Now married:
52.0% (47)Unmarried:
48.0% (43)
Women who did not give birth in the past 12 months Now married:
25.6% (865)Unmarried:
74.4% (2,513)
Marital status - American Indian / Alaska Native population 15 years and over
Males 83.9% Never married16.1% Now married0.0% Separated0.0% Widowed0.0% DivorcedFemales 17.1% Never married43.4% Now married0.0% Separated0.0% Widowed39.5% DivorcedWomen who gave birth in the past 12 months Now married:
0.0% (0)Unmarried:
100.0% (5)
Women who did not give birth in the past 12 months Now married:
69.6% (40)Unmarried:
30.4% (18)
Marital status - Asian population 15 years and over
Males 39.2% Never married59.1% Now married0.7% Separated0.5% Widowed0.5% DivorcedFemales 18.4% Never married70.5% Now married1.0% Separated6.2% Widowed3.8% DivorcedWomen who gave birth in the past 12 months Now married:
100.0% (404)Unmarried:
0.0% (0)
Women who did not give birth in the past 12 months Now married:
81.6% (2,631)Unmarried:
18.4% (595)
Marital status - Native Hawaiian / Pacific Islander population 15 years and over
Males 0.0% Never married100.0% Now married0.0% Separated0.0% Widowed0.0% DivorcedFemales 70.2% Never married29.8% Now married0.0% Separated0.0% Widowed0.0% DivorcedWomen who gave birth in the past 12 months Now married:
0.0% (0)Unmarried:
100.0% (38)
Women who did not give birth in the past 12 months Now married:
45.6% (33)Unmarried:
54.4% (39)
Marital status - Other race population 15 years and over
Males 47.4% Never married40.9% Now married0.0% Separated0.0% Widowed11.7% DivorcedFemales 10.5% Never married28.4% Now married0.0% Separated1.0% Widowed60.1% DivorcedWomen who did not give birth in the past 12 months Now married:
50.0% (56)Unmarried:
50.0% (56)
Marital status - Two or more races population 15 years and over
Males 40.2% Never married38.9% Now married11.5% Separated1.6% Widowed7.9% DivorcedFemales 55.0% Never married30.9% Now married4.0% Separated3.1% Widowed7.0% DivorcedWomen who gave birth in the past 12 months Now married:
100.0% (50)Unmarried:
0.0% (0)
Women who did not give birth in the past 12 months Now married:
33.0% (683)Unmarried:
67.0% (1,389)
Marital status - White alone, not Hispanic / Latino population 15 years and over
Males 31.0% Never married55.2% Now married0.0% Separated2.8% Widowed11.0% DivorcedFemales 30.4% Never married50.3% Now married0.2% Separated7.7% Widowed11.3% DivorcedWomen who gave birth in the past 12 months Now married:
64.3% (551)Unmarried:
35.7% (306)
Women who did not give birth in the past 12 months Now married:
42.2% (3,754)Unmarried:
57.8% (5,135)
Marital status - Hispanic or Latino population 15 years and over
Males 52.8% Never married35.5% Now married1.4% Separated2.8% Widowed7.5% DivorcedFemales 48.4% Never married39.5% Now married0.0% Separated5.0% Widowed7.2% DivorcedWomen who gave birth in the past 12 months Now married:
100.0% (11)Unmarried:
0.0% (0)
Women who did not give birth in the past 12 months Now married:
41.6% (243)Unmarried:
58.4% (341)
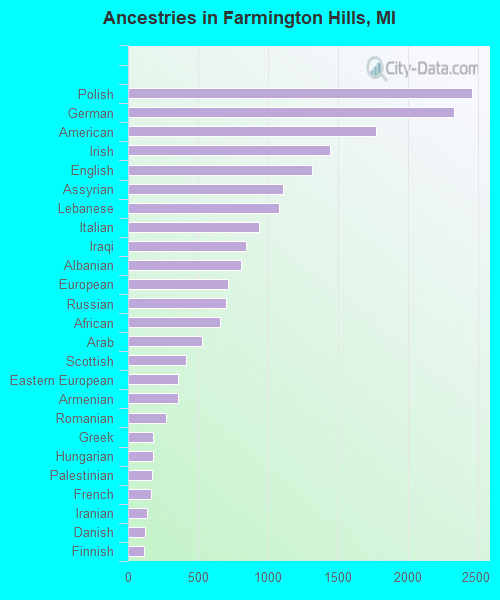
Ancestries in Farmington Hills
2,457 5.5% Polish2,328 5.2% German1,773 3.9% American1,441 3.2% Irish1,318 2.9% English1,108 2.5% Assyrian1,082 2.4% Lebanese937 2.1% Italian841 1.9% Iraqi810 1.8% Albanian717 1.6% European698 1.5% Russian656 1.5% African526 1.2% Arab413 0.9% Scottish357 0.8% Eastern European354 0.8% Armenian273 0.6% Romanian179 0.4% Greek178 0.4% Hungarian170 0.4% Palestinian161 0.4% French137 0.3% Iranian118 0.3% Danish117 0.3% Finnish114 0.3% Dutch109 0.2% Yugoslavian105 0.2% Canadian91 0.2% Czech87 0.2% Slovak86 0.2% Nigerian84 0.2% Ukrainian78 0.2% French Canadian72 0.2% Macedonian58 0.1% Scotch-Irish58 0.1% Haitian56 0.1% British56 0.1% Egyptian55 0.1% Syrian53 0.1% Austrian50 0.1% Moroccan47 0.1% Jamaican46 0.1% Israeli45 0.10% Swedish41 0.09% Welsh37 0.08% Ugandan36 0.08% Northern European33 0.07% Brazilian33 0.07% Serbian30 0.07% Jordanian29 0.06% Croatian28 0.06% Norwegian28 0.06% Lithuanian27 0.06% South African25 0.06% Trinidadian and Tobagonian24 0.05% Maltese23 0.05% Scandinavian22 0.05% Belgian20 0.04% Ethiopian19 0.04% Bulgarian19 0.04% West Indian18 0.04% Slavic16 0.04% Turkish11 0.02% Sudanese10 0.02% Swiss6 0.01% Portuguese4 0.01% Belizean
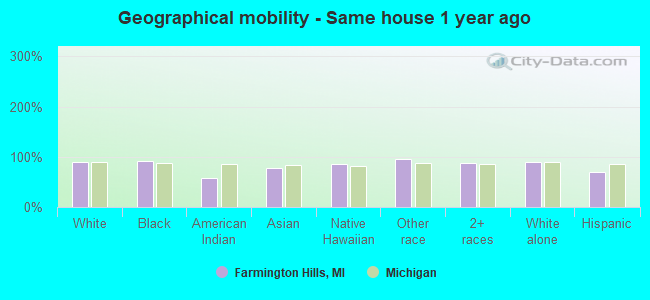
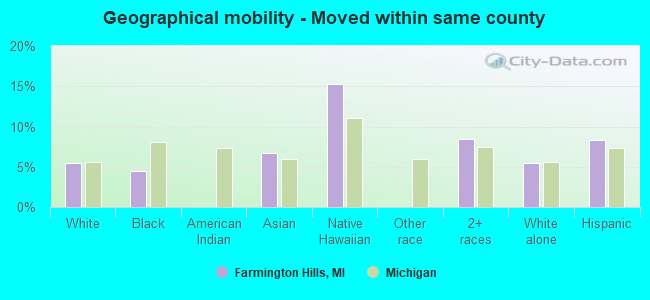
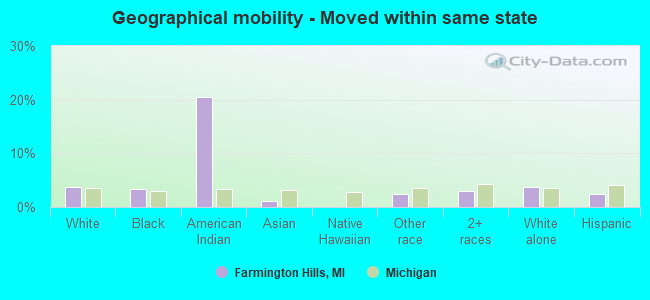
Geographical mobility in Farmington Hills Same house 1 year ago 42,587 89.3% White (Caucasian)13,042 91.2% Black or African American95 58.5% American Indian / Alaska Native10,834 78.5% Asian200 84.7% Native Hawaiian / Pacific Islander589 95.2% Other race5,696 86.7% Two or more races42,024 89.2% White alone, not Hispanic / Latino1,360 69.2% Hispanic or LatinoMoved within same county 2,583 5.4% White / Caucasian637 4.5% Black or African American925 6.7% Asian36 15.3% Native Hawaiian / Pacific Islander555 8.5% Two or more races2,583 5.5% White alone, not Hispanic / Latino163 8.3% Hispanic or LatinoMoved within same state 1,782 3.7% White / Caucasian480 3.4% Black or African American33 20.5% American Indian / Alaska Native148 1.1% Asian15 2.4% Other race196 3.0% Two or more races1,782 3.8% White alone, not Hispanic / Latino47 2.4% Hispanic or LatinoMoved from different state 493 1.0% White / Caucasian42 0.3% Black or African American39 24.1% American Indian / Alaska Native493 3.6% Asian26 0.4% Two or more races493 1.0% White alone, not Hispanic / Latino50 2.6% Hispanic or LatinoMoved from abroad 255 0.5% White316 2.2% Black or African American1,409 10.2% Asian17 2.7% Other race28 0.4% Two or more races255 0.5% White alone, not Hispanic / Latino296 15.1% Hispanic or Latino
Children Nativity (place of birth) in Farmington Hills
Children under 6 years - Living with two parents Both parents native 2,780 100.0% NativeBoth parents foreign-born 1,421 89.0% Native176 11.0% Foreign-bornOne native, one foreign-born parent 414 100.0% NativeChildren under 6 years - Living with one parent Native parent 1,589 100.0% NativeChildren 6 to 17 years - Living with two parents Both parents native 3,488 98.3% Native60 1.7% Foreign-bornBoth parents foreign-born 410 36.1% Native725 63.9% Foreign-bornOne native, one foreign-born parent 634 100.0% NativeChildren 6 to 17 years - Living with one parent Native parent 2,569 100.0% Native
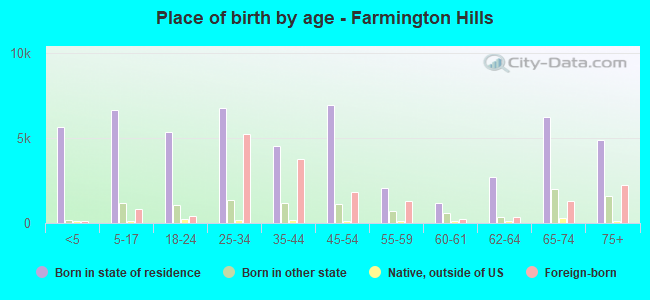
Place of birth for residents in Farmington Hills
Grandparents responsible for own grandchildren in Farmington Hills
Grandparents (30 to 59 years) White / Caucasian 10 6.5% Responsible for grandchildren141 93.5% Not responsible for grandchildrenBlack or African American 19 89.6% Responsible for grandchildren2 10.4% Not responsible for grandchildrenAsian 38 100.0% Not responsible for grandchildrenWhite alone, not Hispanic / Latino 10 6.6% Responsible for grandchildren144 93.4% Not responsible for grandchildrenGrandparents (60 years and over) White / Caucasian 17 4.4% Responsible for grandchildren360 95.6% Not responsible for grandchildrenBlack or African American 50 22.4% Responsible for grandchildren173 77.6% Not responsible for grandchildrenAsian 35 17.0% Responsible for grandchildren172 83.0% Not responsible for grandchildrenWhite alone, not Hispanic / Latino 9 2.4% Responsible for grandchildren364 97.6% Not responsible for grandchildren