Races in Farmington, Utah (UT) Detailed Stats
Data:
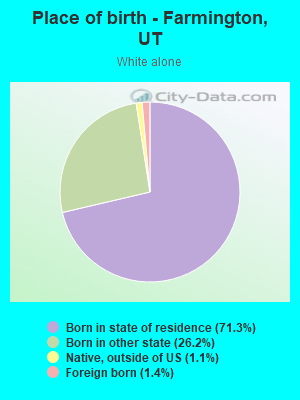
Races - White alone (%)
Races - White alone (% change since 2000)
Races - Black alone (%)
Races - Black alone (% change since 2000)
Races - American Indian alone (%)
Races - American Indian alone (% change since 2000)
Races - Asian alone (%)
Races - Asian alone (% change since 2000)
Races - Hispanic (%)
Races - Hispanic (% change since 2000)
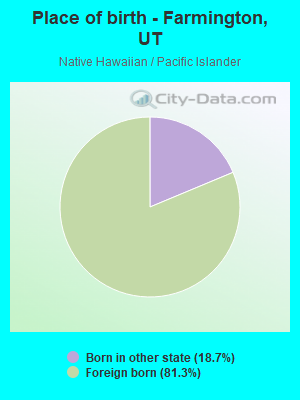
Races - Native Hawaiian and Other Pacific Islander alone (%)
Races - Native Hawaiian and Other Pacific Islander alone (% change since 2000)
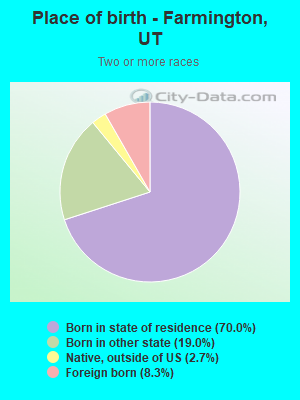
Races - Two or more races(%)
Races - Two or more races(% change since 2000)
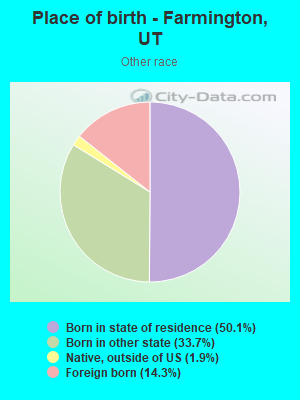
Races - Other race alone (%)
Races - Other race alone (% change since 2000)
Racial diversity
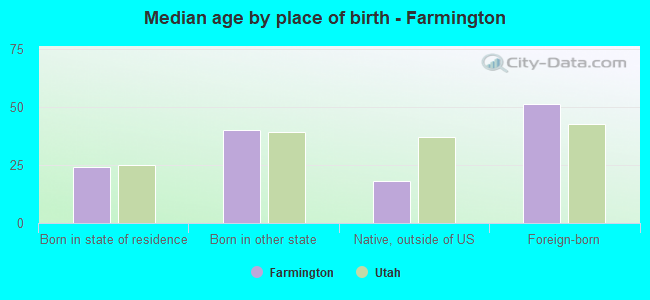
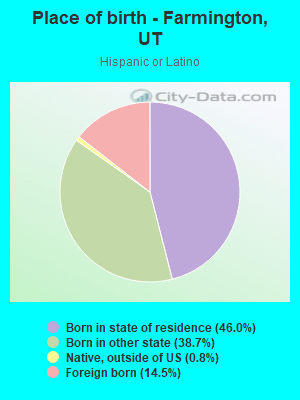
Place of birth - Born in state of residence (%)
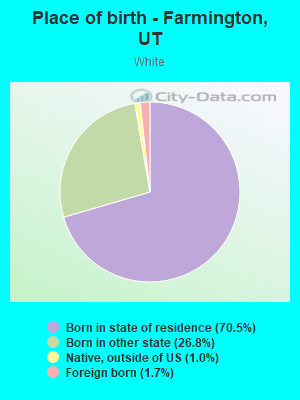
Place of birth - Born in state of residence (%) - White
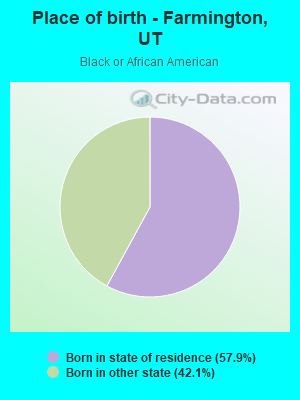
Place of birth - Born in state of residence (%) - Black or African American
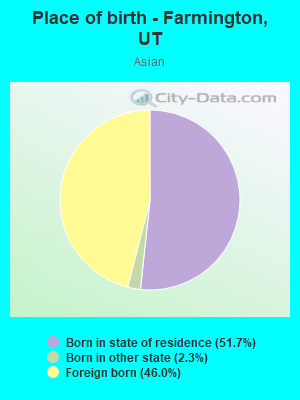
Place of birth - Born in state of residence (%) - Asian
Place of birth - Born in state of residence (%) - Hispanic or Latino
Place of birth - Born in state of residence (%) - American Indian and Alaska Native
Place of birth - Born in state of residence (%) - Multirace
Place of birth - Born in state of residence (%) - Other Race
Place of birth - Born in other state (%)
Place of birth - Born in other state (%) - White
Place of birth - Born in other state (%) - Black or African American
Place of birth - Born in other state (%) - Asian
Place of birth - Born in other state (%) - Hispanic or Latino
Place of birth - Born in other state (%) - American Indian and Alaska Native
Place of birth - Born in other state (%) - Multirace
Place of birth - Born in other state (%) - Other Race
Place of birth - Native, outside of US (%)
Place of birth - Native, outside of US (%) - White
Place of birth - Native, outside of US (%) - Black or African American
Place of birth - Native, outside of US (%) - Asian
Place of birth - Native, outside of US (%) - Hispanic or Latino
Place of birth - Native, outside of US (%) - American Indian and Alaska Native
Place of birth - Native, outside of US (%) - Multirace
Place of birth - Native, outside of US (%) - Other Race
Place of birth - Foreign born (%)
Place of birth - Foreign born (%) - White
Place of birth - Foreign born (%) - Black or African American
Place of birth - Foreign born (%) - Asian
Place of birth - Foreign born (%) - Hispanic or Latino
Place of birth - Foreign born (%) - American Indian and Alaska Native
Place of birth - Foreign born (%) - Multirace
Place of birth - Foreign born (%) - Other Race
Residents speaking English at home (%)
Residents speaking English at home - Born in the United States (%)
Residents speaking English at home - Native, born elsewhere (%)
Residents speaking English at home - Foreign born (%)
Residents speaking Spanish at home (%)
Residents speaking Spanish at home - Born in the United States (%)
Residents speaking Spanish at home - Native, born elsewhere (%)
Residents speaking Spanish at home - Foreign born (%)
Residents speaking other language at home (%)
Residents speaking other language at home - Born in the United States (%)
Residents speaking other language at home - Native, born elsewhere (%)
Residents speaking other language at home - Foreign born (%)
Marital status - Never married (%)
Marital status - Now married (%)
Marital status - Separated (%)
Marital status - Widowed (%)
Marital status - Divorced (%)
Ancestries Reported - Arab (%)
Ancestries Reported - Czech (%)
Ancestries Reported - Danish (%)
Ancestries Reported - Dutch (%)
Ancestries Reported - English (%)
Ancestries Reported - French (%)
Ancestries Reported - French Canadian (%)
Ancestries Reported - German (%)
Ancestries Reported - Greek (%)
Ancestries Reported - Hungarian (%)
Ancestries Reported - Irish (%)
Ancestries Reported - Italian (%)
Ancestries Reported - Lithuanian (%)
Ancestries Reported - Norwegian (%)
Ancestries Reported - Polish (%)
Ancestries Reported - Portuguese (%)
Ancestries Reported - Russian (%)
Ancestries Reported - Scotch-Irish (%)
Ancestries Reported - Scottish (%)
Ancestries Reported - Slovak (%)
Ancestries Reported - Subsaharan African (%)
Ancestries Reported - Swedish (%)
Ancestries Reported - Swiss (%)
Ancestries Reported - Ukrainian (%)
Ancestries Reported - United States (%)
Ancestries Reported - Welsh (%)
Ancestries Reported - West Indian (%)
Ancestries Reported - Other (%)
Geographical mobility - Same house 1 year ago (%)
Geographical mobility - Same house 1 year ago (%) - White
Geographical mobility - Same house 1 year ago (%) - Black or African American
Geographical mobility - Same house 1 year ago (%) - Asian
Geographical mobility - Same house 1 year ago (%) - Hispanic or Latino
Geographical mobility - Same house 1 year ago (%) - American Indian and Alaska Native
Geographical mobility - Same house 1 year ago (%) - Multirace
Geographical mobility - Same house 1 year ago (%) - Other Race
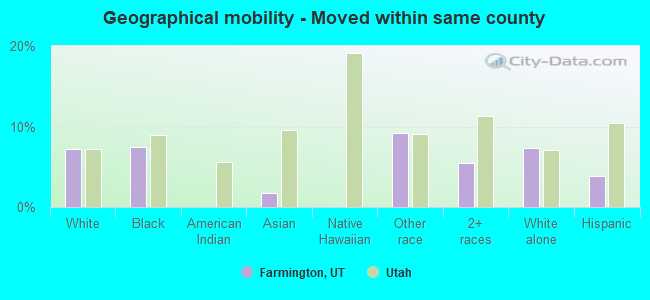
Geographical mobility - Moved within same county (%)
Geographical mobility - Moved within same county (%) - White
Geographical mobility - Moved within same county (%) - Black or African American
Geographical mobility - Moved within same county (%) - Asian
Geographical mobility - Moved within same county (%) - Hispanic or Latino
Geographical mobility - Moved within same county (%) - American Indian and Alaska Native
Geographical mobility - Moved within same county (%) - Multirace
Geographical mobility - Moved within same county (%) - Other Race
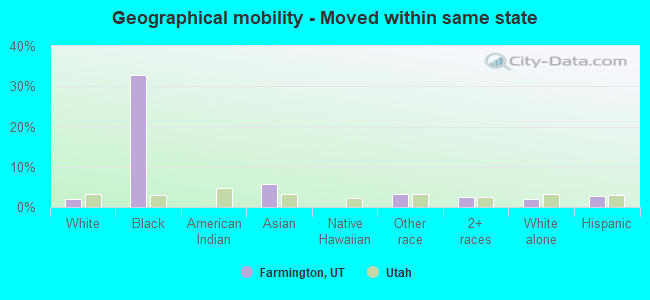
Geographical mobility - Moved from different county within same state (%)
Geographical mobility - Moved from different county within same state (%) - White
Geographical mobility - Moved from different county within same state (%) - Black or African American
Geographical mobility - Moved from different county within same state (%) - Asian
Geographical mobility - Moved from different county within same state (%) - Hispanic or Latino
Geographical mobility - Moved from different county within same state (%) - American Indian and Alaska Native
Geographical mobility - Moved from different county within same state (%) - Multirace
Geographical mobility - Moved from different county within same state (%) - Other Race
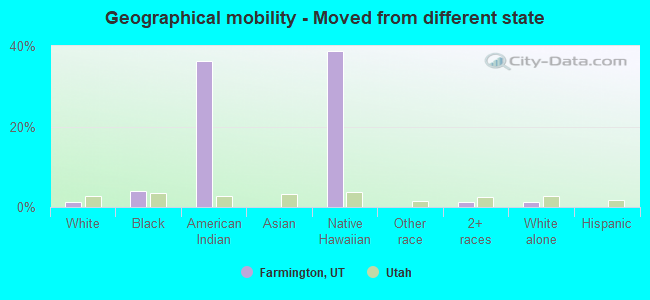
Geographical mobility - Moved from different state (%)
Geographical mobility - Moved from different state (%) - White
Geographical mobility - Moved from different state (%) - Black or African American
Geographical mobility - Moved from different state (%) - Asian
Geographical mobility - Moved from different state (%) - Hispanic or Latino
Geographical mobility - Moved from different state (%) - American Indian and Alaska Native
Geographical mobility - Moved from different state (%) - Multirace
Geographical mobility - Moved from different state (%) - Other Race
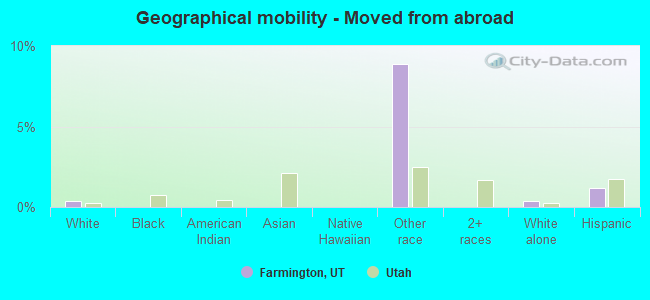
Geographical mobility - Moved from abroad (%)
Geographical mobility - Moved from abroad (%) - White
Geographical mobility - Moved from abroad (%) - Black or African American
Geographical mobility - Moved from abroad (%) - Asian
Geographical mobility - Moved from abroad (%) - Hispanic or Latino
Geographical mobility - Moved from abroad (%) - American Indian and Alaska Native
Geographical mobility - Moved from abroad (%) - Multirace
Geographical mobility - Moved from abroad (%) - Other Race
Place of birth for the foreign-born population - Ireland (%)
Place of birth for the foreign-born population - Denmark (%)
Place of birth for the foreign-born population - Norway (%)
Place of birth for the foreign-born population - Sweden (%)
Place of birth for the foreign-born population - United Kingdom (%)
Place of birth for the foreign-born population - England (%)
Place of birth for the foreign-born population - Scotland (%)
Place of birth for the foreign-born population - Other Northern Europe (%)
Place of birth for the foreign-born population - Austria (%)
Place of birth for the foreign-born population - Belgium (%)
Place of birth for the foreign-born population - France (%)
Place of birth for the foreign-born population - Germany (%)
Place of birth for the foreign-born population - Netherlands (%)
Place of birth for the foreign-born population - Switzerland (%)
Place of birth for the foreign-born population - Other Western Europe (%)
Place of birth for the foreign-born population - Greece (%)
Place of birth for the foreign-born population - Italy (%)
Place of birth for the foreign-born population - Portugal (%)
Place of birth for the foreign-born population - Spain (%)
Place of birth for the foreign-born population - Other Southern Europe (%)
Place of birth for the foreign-born population - Albania (%)
Place of birth for the foreign-born population - Belarus (%)
Place of birth for the foreign-born population - Bosnia and Herzegovina (%)
Place of birth for the foreign-born population - Bulgaria (%)
Place of birth for the foreign-born population - Croatia (%)
Place of birth for the foreign-born population - Czechoslovakia (%)
Place of birth for the foreign-born population - Hungary (%)
Place of birth for the foreign-born population - Latvia (%)
Place of birth for the foreign-born population - Lithuania (%)
Place of birth for the foreign-born population - North Macedonia (Macedonia) (%)
Place of birth for the foreign-born population - Moldova (%)
Place of birth for the foreign-born population - Poland (%)
Place of birth for the foreign-born population - Romania (%)
Place of birth for the foreign-born population - Russia (%)
Place of birth for the foreign-born population - Serbia (%)
Place of birth for the foreign-born population - Ukraine (%)
Place of birth for the foreign-born population - Other Eastern Europe (%)
Place of birth for the foreign-born population - China (%)
Place of birth for the foreign-born population - Hong Kong (%)
Place of birth for the foreign-born population - Taiwan (%)
Place of birth for the foreign-born population - Japan (%)
Place of birth for the foreign-born population - Korea (%)
Place of birth for the foreign-born population - Other Eastern Asia (%)
Place of birth for the foreign-born population - Afghanistan (%)
Place of birth for the foreign-born population - Bangladesh (%)
Place of birth for the foreign-born population - India (%)
Place of birth for the foreign-born population - Iran (%)
Place of birth for the foreign-born population - Kazakhstan (%)
Place of birth for the foreign-born population - Nepal (%)
Place of birth for the foreign-born population - Pakistan (%)
Place of birth for the foreign-born population - Sri Lanka (%)
Place of birth for the foreign-born population - Uzbekistan (%)
Place of birth for the foreign-born population - Other South Central Asia (%)
Place of birth for the foreign-born population - Burma (%)
Place of birth for the foreign-born population - Cambodia (%)
Place of birth for the foreign-born population - Indonesia (%)
Place of birth for the foreign-born population - Laos (%)
Place of birth for the foreign-born population - Malaysia (%)
Place of birth for the foreign-born population - Philippines (%)
Place of birth for the foreign-born population - Singapore (%)
Place of birth for the foreign-born population - Thailand (%)
Place of birth for the foreign-born population - Vietnam (%)
Place of birth for the foreign-born population - Other South Eastern Asia (%)
Place of birth for the foreign-born population - Armenia (%)
Place of birth for the foreign-born population - Iraq (%)
Place of birth for the foreign-born population - Israel (%)
Place of birth for the foreign-born population - Jordan (%)
Place of birth for the foreign-born population - Kuwait (%)
Place of birth for the foreign-born population - Lebanon (%)
Place of birth for the foreign-born population - Saudi Arabia (%)
Place of birth for the foreign-born population - Syria (%)
Place of birth for the foreign-born population - Turkey (%)
Place of birth for the foreign-born population - Yemen (%)
Place of birth for the foreign-born population - Other Western Asia (%)
Place of birth for the foreign-born population - Eritrea (%)
Place of birth for the foreign-born population - Ethiopia (%)
Place of birth for the foreign-born population - Kenya (%)
Place of birth for the foreign-born population - Somalia (%)
Place of birth for the foreign-born population - Uganda (%)
Place of birth for the foreign-born population - Zimbabwe (%)
Place of birth for the foreign-born population - Other Eastern Africa (%)
Place of birth for the foreign-born population - Cameroon (%)
Place of birth for the foreign-born population - Congo (%)
Place of birth for the foreign-born population - Democratic Republic of Congo (Zaire) (%)
Place of birth for the foreign-born population - Other Middle Africa (%)
Place of birth for the foreign-born population - Egypt (%)
Place of birth for the foreign-born population - Morocco (%)
Place of birth for the foreign-born population - Sudan (%)
Place of birth for the foreign-born population - Other Northern Africa (%)
Place of birth for the foreign-born population - South Africa (%)
Place of birth for the foreign-born population - Other Southern Africa (%)
Place of birth for the foreign-born population - Cabo Verde (%)
Place of birth for the foreign-born population - Ghana (%)
Place of birth for the foreign-born population - Liberia (%)
Place of birth for the foreign-born population - Nigeria (%)
Place of birth for the foreign-born population - Senegal (%)
Place of birth for the foreign-born population - Sierra Leone (%)
Place of birth for the foreign-born population - Other Western Africa (%)
Place of birth for the foreign-born population - Australia (%)
Place of birth for the foreign-born population - New Zealand (%)
Place of birth for the foreign-born population - Fiji (%)
Place of birth for the foreign-born population - Micronesia (%)
Place of birth for the foreign-born population - Bahamas (%)
Place of birth for the foreign-born population - Barbados (%)
Place of birth for the foreign-born population - Cuba (%)
Place of birth for the foreign-born population - Dominica (%)
Place of birth for the foreign-born population - Dominican Republic (%)
Place of birth for the foreign-born population - Grenada (%)
Place of birth for the foreign-born population - Haiti (%)
Place of birth for the foreign-born population - Jamaica (%)
Place of birth for the foreign-born population - St. Vincent and the Grenadines (%)
Place of birth for the foreign-born population - Trinidad and Tobago (%)
Place of birth for the foreign-born population - West Indies (%)
Place of birth for the foreign-born population - Other Caribbean (%)
Place of birth for the foreign-born population - Belize (%)
Place of birth for the foreign-born population - Costa Rica (%)
Place of birth for the foreign-born population - El Salvador (%)
Place of birth for the foreign-born population - Guatemala (%)
Place of birth for the foreign-born population - Honduras (%)
Place of birth for the foreign-born population - Mexico (%)
Place of birth for the foreign-born population - Nicaragua (%)
Place of birth for the foreign-born population - Panama (%)
Place of birth for the foreign-born population - Other Central America (%)
Place of birth for the foreign-born population - Argentina (%)
Place of birth for the foreign-born population - Bolivia (%)
Place of birth for the foreign-born population - Brazil (%)
Place of birth for the foreign-born population - Chile (%)
Place of birth for the foreign-born population - Colombia (%)
Place of birth for the foreign-born population - Ecuador (%)
Place of birth for the foreign-born population - Guyana (%)
Place of birth for the foreign-born population - Peru (%)
Place of birth for the foreign-born population - Uruguay (%)
Place of birth for the foreign-born population - Venezuela (%)
Place of birth for the foreign-born population - Other South America (%)
Place of birth for the foreign-born population - Canada (%)
Place of birth for the foreign-born population - Other Northern America (%)
Place of birth for the foreign-born population - Other (%)
Latest news about races in Farmington, UT collected exclusively by city-data.com from local newspapers, TV, and radio stations
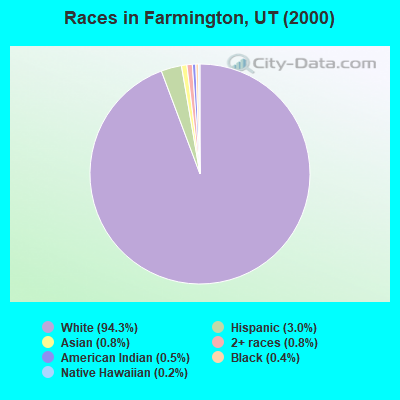
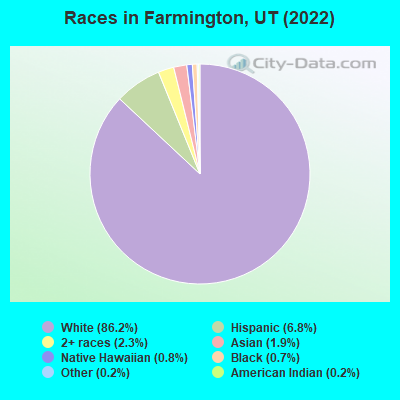
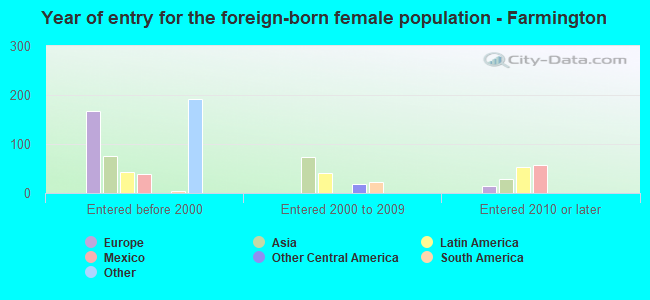
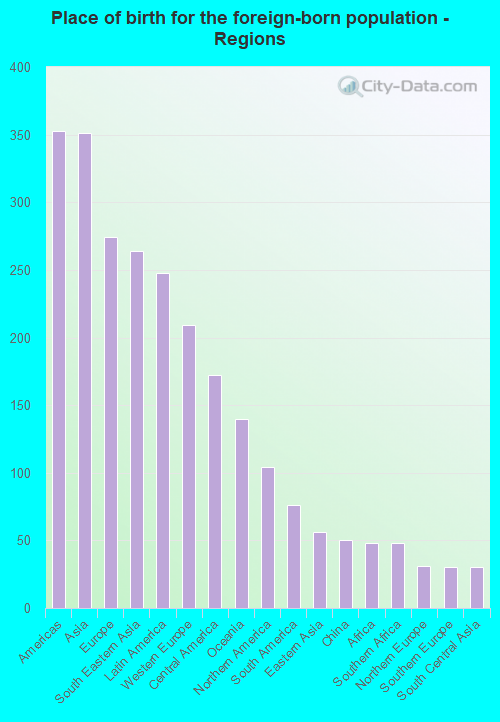
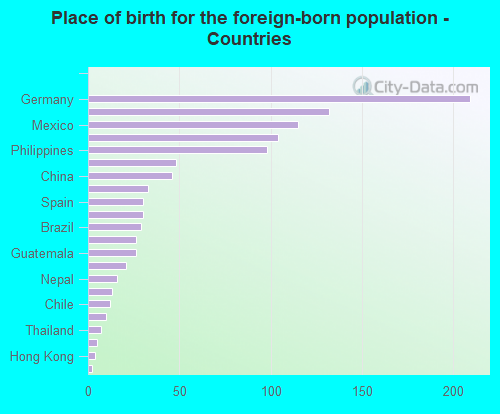
According to 2022 data, the most numerous races in Farmington, UT are White alone (21,496 residents), Hispanic (1,687 residents), and Two or more races (575 residents). 92.3% of Farmington residents speak English at home. 4.7% of Farmington, UT residents are foreign-born (1.4% born in Asia, 1.1% born in Europe, 1.0% born in Latin America, 0.5% born in Oceania), which is 70.6% less than the foreign-born rate of 8.0% across the entire state of Utah.
Race distribution in Farmington
2000 2022
1,904,265 85.3% White alone 201,559 9.0% Hispanic 36,483 1.6% Asian alone 31,308 1.4% Two or more races 26,663 1.2% American Indian alone 14,806 0.7% Native Hawaiian and Other 16,137 0.7% Black alone 1,948 0.09% Other race alone
2,557,466 75.6% White alone 512,086 15.1% Hispanic 119,308 3.5% Two or more races 82,388 2.4% Asian alone 36,978 1.1% Native Hawaiian and Other 34,873 1.0% Black alone 22,803 0.7% American Indian alone 14,898 0.4% Other race alone
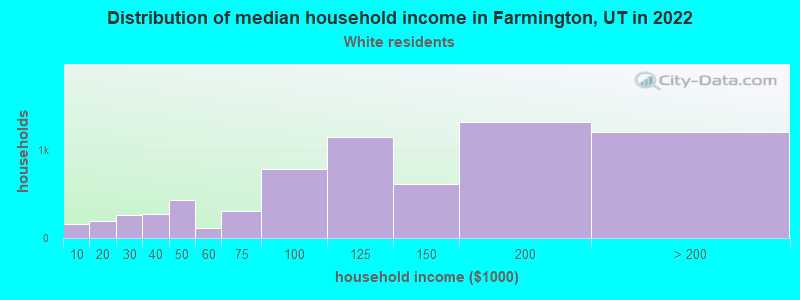
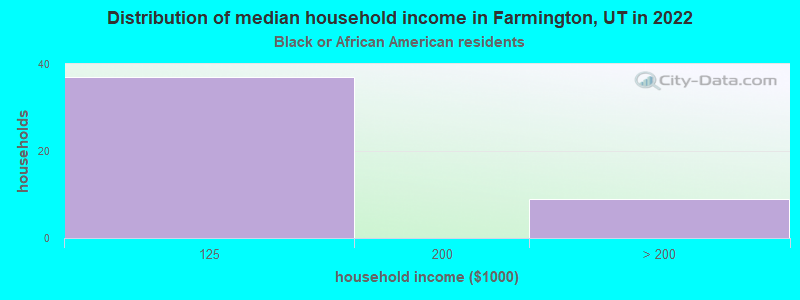
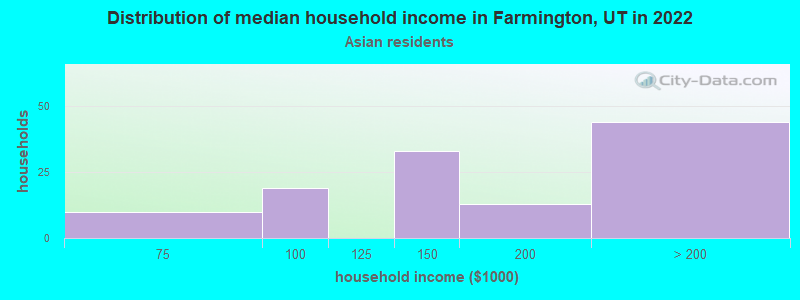
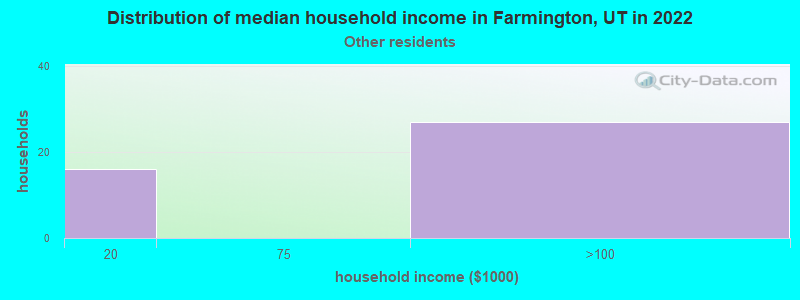
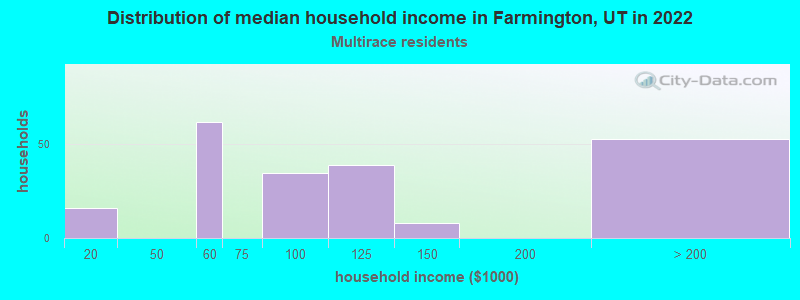
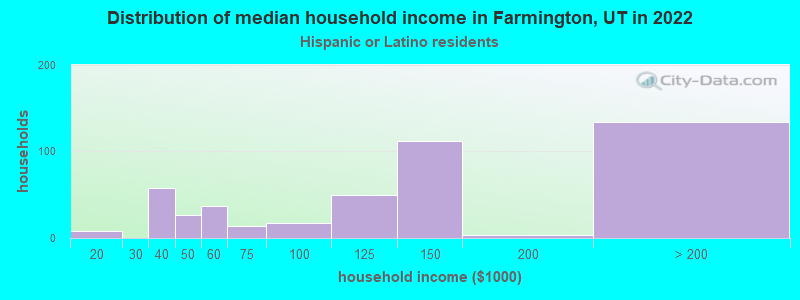
Income and house value in Farmington Median household income in 2022 $117,452 White non-Hispanic householders$135,648 Asian householders$110,951 Two or more races householders$116,184 Hispanic or Latino race householdersMedian 2022 house value $702,273 White Non-Hispanic householders $579,875 Asian householders$490,663 Native Hawaiian and other Pacific Islander householders$669,087 Some other race householders$650,531 Hispanic or Latino householders
Median age by race in Farmington
31.9 Median age for White residents30.6 32.8 24.2 Median age for Black or African American residents31.3 22.6 27.4 Median age for American Indian / Alaska Native residents33.4 -386,961,093.2 37.2 Median age for Asian residents37.6 37.5 39.9 Median age for Native Hawaiian / Pacific Islander residents-580,419,579.8 36.5 22.8 Median age for Other race residents22.8 33.9 24.5 Median age for Two or more races residents19.8 25.1 32.5 Median age for White alone residents31.0 33.3 23.5 Median age for Hispanic or Latino residents20.9 24.1
Owner/renter occupied households by race in Farmington
House owners and renters - White residents 5,553 82.6% Owner occupied1,171 17.4% Renter occupiedHouse owners and renters - Black or African American residents 40 100.0% Owner occupiedHouse owners and renters - Asian residents 72 73.0% Owner occupied27 27.0% Renter occupiedHouse owners and renters - Other race residents 25 61.9% Owner occupied16 38.1% Renter occupiedHouse owners and renters - Two or more races residents 119 68.4% Owner occupied55 31.6% Renter occupiedHouse owners and renters - White alone residents 5,490 84.4% Owner occupied1,011 15.6% Renter occupiedHouse owners and renters - Hispanic or Latino residents 193 48.1% Owner occupied208 51.9% Renter occupied
Language usage in Farmington
English speakers - Total 92.3% of residents of Farmington speak English at home.
4.6% of residents speak Spanish at home 940 87.5% Speak English very well134 12.5% Speak English less than very well3.2% of residents speak other language at home 684 92.8% Speak English very well53 7.2% Speak English less than very well
English speakers - Born in the United States 90.7% of residents of Farmington speak English at home.
6.8% of residents speak Spanish at home 385 87.9% Speak English very well53 12.1% Speak English less than very well1.1% of residents speak other language at home 50 68.5% Speak English very well23 31.5% Speak English less than very well
English speakers - Native, born elsewhere 82.6% of residents of Farmington speak English at home.
14.8% of residents speak Spanish at home 35 100.0% Speak English very well
English speakers - Foreign-born 43.3% of residents of Farmington speak English at home.
15.2% of residents speak Spanish at home 106 76.8% Speak English very well32 23.2% Speak English less than very well31.3% of residents speak other language at home 271 95.8% Speak English very well12 4.2% Speak English less than very well
White (Caucasian) - Speak only English Native:
94.4% (19,285)Foreign-born:
61.0% (238)
White (Caucasian) - Speak another language Native:
5.7% (1,160)Foreign-born:
16.2% (63)
Asian - Speak only English Native:
80.9% (147)Foreign-born:
28.1% (62)
Other race - Speak another language Native:
24.9% (44)Foreign-born:
90.7% (29)
Two or more races - Speak only English Native:
88.6% (1,010)Foreign-born:
22.4% (23)
Two or more races - Speak another language Native:
9.5% (108)Foreign-born:
73.0% (76)
White alone - Speak only English Native:
94.7% (18,772)Foreign-born:
80.6% (242)
White alone - Speak another language Native:
5.7% (1,127)Foreign-born:
4.0% (12)
Hispanic or Latino - Speak only English Native:
77.2% (986)Foreign-born:
31.2% (77)
Hispanic or Latino - Speak another language Native:
24.2% (309)Foreign-born:
64.4% (160)
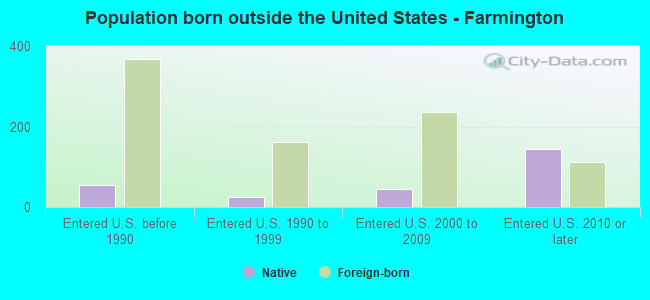
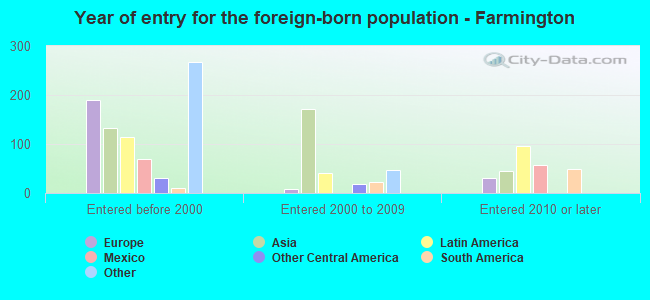
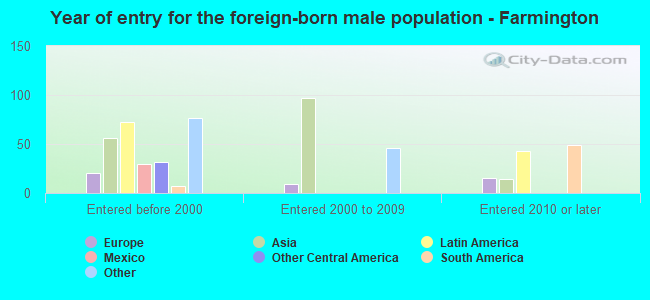
Foreign-born residents in Farmington 1,169 residents are foreign born (1.4% Asia , 1.1% Europe , 1.0% Latin America , 0.5% Oceania ).
Marital status for residents in Farmington Marital status - White (Caucasian) population 15 years and over
Males 29.1% Never married63.6% Now married0.4% Separated1.2% Widowed5.7% DivorcedFemales 24.0% Never married64.1% Now married1.1% Separated2.2% Widowed8.6% DivorcedWomen who gave birth in the past 12 months Now married:
92.0% (348)Unmarried:
8.0% (30)
Women who did not give birth in the past 12 months Now married:
58.5% (2,903)Unmarried:
41.5% (2,056)
Marital status - Black or African American population 15 years and over
Males 72.6% Never married27.4% Now married0.0% Separated0.0% Widowed0.0% DivorcedFemales 100.0% Never married0.0% Now married0.0% Separated0.0% Widowed0.0% DivorcedWomen who gave birth in the past 12 months Now married:
0.0% (0)Unmarried:
100.0% (13)
Women who did not give birth in the past 12 months Now married:
0.0% (0)Unmarried:
100.0% (44)
Marital status - Asian population 15 years and over
Males 40.5% Never married47.3% Now married0.0% Separated0.0% Widowed12.2% DivorcedFemales 0.0% Never married81.5% Now married0.0% Separated5.6% Widowed12.9% DivorcedWomen who did not give birth in the past 12 months Now married:
100.0% (108)Unmarried:
0.0% (0)
Marital status - Native Hawaiian / Pacific Islander population 15 years and over
Males 63.9% Never married36.1% Now married0.0% Separated0.0% Widowed0.0% DivorcedFemales 0.0% Never married75.0% Now married0.0% Separated0.0% Widowed25.0% DivorcedWomen who did not give birth in the past 12 months Now married:
100.0% (9)Unmarried:
0.0% (0)
Marital status - Other race population 15 years and over
Males 46.6% Never married48.5% Now married4.9% Separated0.0% Widowed0.0% DivorcedFemales 12.5% Never married18.8% Now married0.0% Separated0.0% Widowed68.8% DivorcedWomen who did not give birth in the past 12 months Now married:
60.0% (3)Unmarried:
40.0% (2)
Marital status - Two or more races population 15 years and over
Males 68.9% Never married31.1% Now married0.0% Separated0.0% Widowed0.0% DivorcedFemales 72.2% Never married12.9% Now married0.0% Separated2.7% Widowed12.3% DivorcedWomen who did not give birth in the past 12 months Now married:
10.4% (64)Unmarried:
89.6% (549)
Marital status - White alone, not Hispanic / Latino population 15 years and over
Males 28.2% Never married64.4% Now married0.4% Separated1.2% Widowed5.8% DivorcedFemales 23.3% Never married64.8% Now married1.1% Separated2.2% Widowed8.5% DivorcedWomen who gave birth in the past 12 months Now married:
91.7% (336)Unmarried:
8.3% (30)
Women who did not give birth in the past 12 months Now married:
59.7% (2,833)Unmarried:
40.3% (1,916)
Marital status - Hispanic or Latino population 15 years and over
Males 51.7% Never married45.0% Now married1.0% Separated0.6% Widowed1.7% DivorcedFemales 55.5% Never married25.6% Now married0.0% Separated3.1% Widowed15.8% DivorcedWomen who gave birth in the past 12 months Now married:
100.0% (15)Unmarried:
0.0% (0)
Women who did not give birth in the past 12 months Now married:
20.0% (121)Unmarried:
80.0% (486)
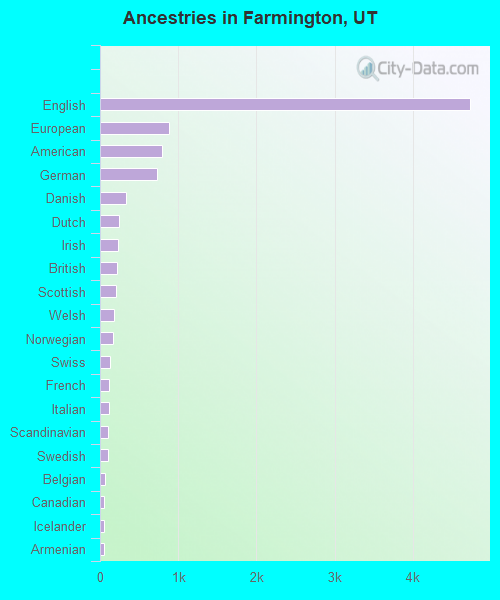
Ancestries in Farmington
4,738 40.1% English884 7.5% European793 6.7% American724 6.1% German333 2.8% Danish243 2.1% Dutch225 1.9% Irish217 1.8% British207 1.8% Scottish179 1.5% Welsh163 1.4% Norwegian129 1.1% Swiss121 1.0% French110 0.9% Italian99 0.8% Scandinavian97 0.8% Swedish58 0.5% Belgian52 0.4% Canadian49 0.4% Icelander45 0.4% Armenian35 0.3% French Canadian19 0.2% Polish17 0.1% Northern European16 0.1% Iranian8 0.07% Greek6 0.05% Australian3 0.03% Eastern European1 0.01% Croatian
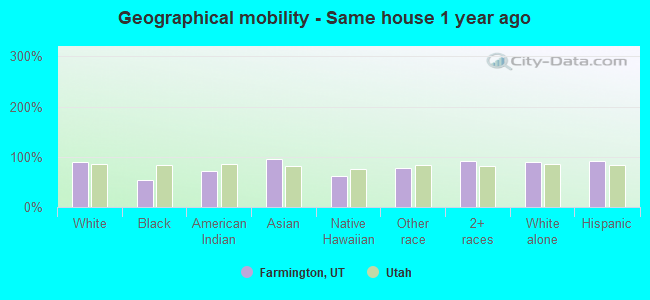
Geographical mobility in Farmington Same house 1 year ago 19,605 89.0% White (Caucasian)86 53.9% Black or African American27 72.4% American Indian / Alaska Native484 95.1% Asian118 61.7% Native Hawaiian / Pacific Islander168 78.5% Other race1,128 90.7% Two or more races18,867 88.9% White alone, not Hispanic / Latino1,509 92.1% Hispanic or LatinoMoved within same county 1,600 7.3% White / Caucasian12 7.4% Black or African American9 1.7% Asian20 9.2% Other race68 5.5% Two or more races1,547 7.3% White alone, not Hispanic / Latino63 3.8% Hispanic or LatinoMoved within same state 428 1.9% White / Caucasian52 32.7% Black or African American29 5.7% Asian7 3.1% Other race29 2.4% Two or more races414 1.9% White alone, not Hispanic / Latino46 2.8% Hispanic or LatinoMoved from different state 267 1.2% White / Caucasian6 3.9% Black or African American14 36.4% American Indian / Alaska Native74 38.6% Native Hawaiian / Pacific Islander17 1.4% Two or more races264 1.2% White alone, not Hispanic / LatinoMoved from abroad 80 0.4% White19 8.9% Other race81 0.4% White alone, not Hispanic / Latino19 1.2% Hispanic or Latino
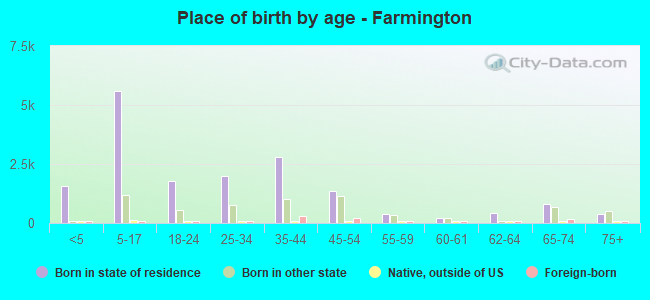
Children Nativity (place of birth) in Farmington
Children under 6 years - Living with two parents Both parents native 2,037 100.0% NativeBoth parents foreign-born 37 100.0% NativeOne native, one foreign-born parent 78 100.0% NativeChildren under 6 years - Living with one parent Native parent 87 100.0% Native
Children 6 to 17 years - Living with two parents Both parents native 5,307 100.0% NativeBoth parents foreign-born 82 100.0% NativeOne native, one foreign-born parent 501 100.0% NativeChildren 6 to 17 years - Living with one parent Native parent 612 100.0% Native
Grandparents responsible for own grandchildren in Farmington
Grandparents (30 to 59 years) White / Caucasian 14 17.8% Responsible for grandchildren65 82.2% Not responsible for grandchildrenWhite alone, not Hispanic / Latino 16 21.1% Responsible for grandchildren60 78.9% Not responsible for grandchildrenGrandparents (60 years and over) White / Caucasian 4 4.1% Responsible for grandchildren105 95.9% Not responsible for grandchildrenWhite alone, not Hispanic / Latino 4 4.2% Responsible for grandchildren102 95.8% Not responsible for grandchildren