Races in Farmingville, New York (NY) Detailed Stats
Data:
Races - White alone (%)
Races - White alone (% change since 2000)
Races - Black alone (%)
Races - Black alone (% change since 2000)
Races - American Indian alone (%)
Races - American Indian alone (% change since 2000)
Races - Asian alone (%)
Races - Asian alone (% change since 2000)
Races - Hispanic (%)
Races - Hispanic (% change since 2000)
Races - Native Hawaiian and Other Pacific Islander alone (%)
Races - Native Hawaiian and Other Pacific Islander alone (% change since 2000)
Races - Two or more races(%)
Races - Two or more races(% change since 2000)
Races - Other race alone (%)
Races - Other race alone (% change since 2000)
Racial diversity
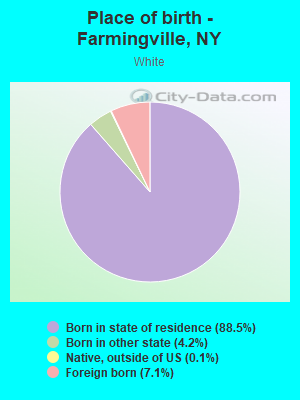
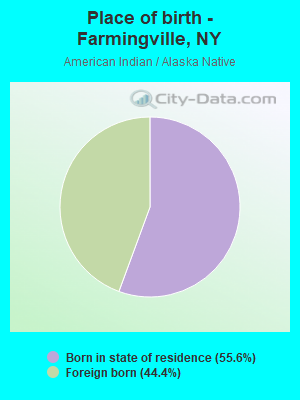
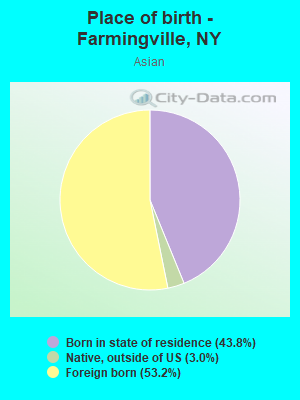
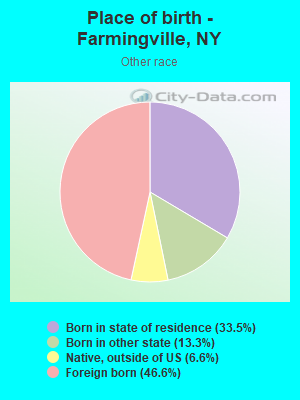
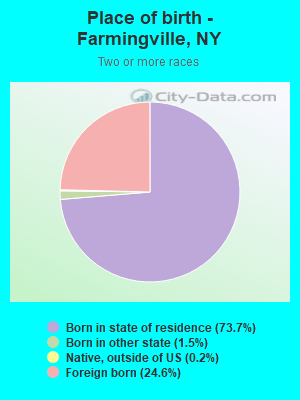
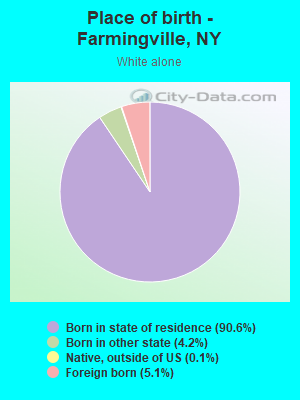
Place of birth - Born in state of residence (%)
Place of birth - Born in state of residence (%) - White
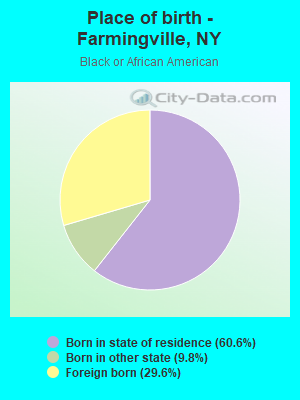
Place of birth - Born in state of residence (%) - Black or African American
Place of birth - Born in state of residence (%) - Asian
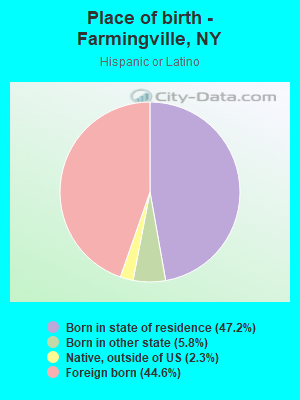
Place of birth - Born in state of residence (%) - Hispanic or Latino
Place of birth - Born in state of residence (%) - American Indian and Alaska Native
Place of birth - Born in state of residence (%) - Multirace
Place of birth - Born in state of residence (%) - Other Race
Place of birth - Born in other state (%)
Place of birth - Born in other state (%) - White
Place of birth - Born in other state (%) - Black or African American
Place of birth - Born in other state (%) - Asian
Place of birth - Born in other state (%) - Hispanic or Latino
Place of birth - Born in other state (%) - American Indian and Alaska Native
Place of birth - Born in other state (%) - Multirace
Place of birth - Born in other state (%) - Other Race
Place of birth - Native, outside of US (%)
Place of birth - Native, outside of US (%) - White
Place of birth - Native, outside of US (%) - Black or African American
Place of birth - Native, outside of US (%) - Asian
Place of birth - Native, outside of US (%) - Hispanic or Latino
Place of birth - Native, outside of US (%) - American Indian and Alaska Native
Place of birth - Native, outside of US (%) - Multirace
Place of birth - Native, outside of US (%) - Other Race
Place of birth - Foreign born (%)
Place of birth - Foreign born (%) - White
Place of birth - Foreign born (%) - Black or African American
Place of birth - Foreign born (%) - Asian
Place of birth - Foreign born (%) - Hispanic or Latino
Place of birth - Foreign born (%) - American Indian and Alaska Native
Place of birth - Foreign born (%) - Multirace
Place of birth - Foreign born (%) - Other Race
Residents speaking English at home (%)
Residents speaking English at home - Born in the United States (%)
Residents speaking English at home - Native, born elsewhere (%)
Residents speaking English at home - Foreign born (%)
Residents speaking Spanish at home (%)
Residents speaking Spanish at home - Born in the United States (%)
Residents speaking Spanish at home - Native, born elsewhere (%)
Residents speaking Spanish at home - Foreign born (%)
Residents speaking other language at home (%)
Residents speaking other language at home - Born in the United States (%)
Residents speaking other language at home - Native, born elsewhere (%)
Residents speaking other language at home - Foreign born (%)
Marital status - Never married (%)
Marital status - Now married (%)
Marital status - Separated (%)
Marital status - Widowed (%)
Marital status - Divorced (%)
Ancestries Reported - Arab (%)
Ancestries Reported - Czech (%)
Ancestries Reported - Danish (%)
Ancestries Reported - Dutch (%)
Ancestries Reported - English (%)
Ancestries Reported - French (%)
Ancestries Reported - French Canadian (%)
Ancestries Reported - German (%)
Ancestries Reported - Greek (%)
Ancestries Reported - Hungarian (%)
Ancestries Reported - Irish (%)
Ancestries Reported - Italian (%)
Ancestries Reported - Lithuanian (%)
Ancestries Reported - Norwegian (%)
Ancestries Reported - Polish (%)
Ancestries Reported - Portuguese (%)
Ancestries Reported - Russian (%)
Ancestries Reported - Scotch-Irish (%)
Ancestries Reported - Scottish (%)
Ancestries Reported - Slovak (%)
Ancestries Reported - Subsaharan African (%)
Ancestries Reported - Swedish (%)
Ancestries Reported - Swiss (%)
Ancestries Reported - Ukrainian (%)
Ancestries Reported - United States (%)
Ancestries Reported - Welsh (%)
Ancestries Reported - West Indian (%)
Ancestries Reported - Other (%)
Geographical mobility - Same house 1 year ago (%)
Geographical mobility - Same house 1 year ago (%) - White
Geographical mobility - Same house 1 year ago (%) - Black or African American
Geographical mobility - Same house 1 year ago (%) - Asian
Geographical mobility - Same house 1 year ago (%) - Hispanic or Latino
Geographical mobility - Same house 1 year ago (%) - American Indian and Alaska Native
Geographical mobility - Same house 1 year ago (%) - Multirace
Geographical mobility - Same house 1 year ago (%) - Other Race
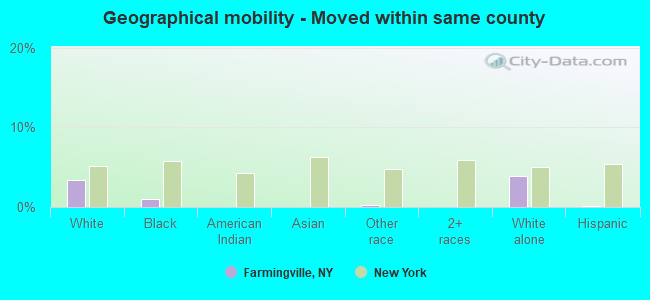
Geographical mobility - Moved within same county (%)
Geographical mobility - Moved within same county (%) - White
Geographical mobility - Moved within same county (%) - Black or African American
Geographical mobility - Moved within same county (%) - Asian
Geographical mobility - Moved within same county (%) - Hispanic or Latino
Geographical mobility - Moved within same county (%) - American Indian and Alaska Native
Geographical mobility - Moved within same county (%) - Multirace
Geographical mobility - Moved within same county (%) - Other Race
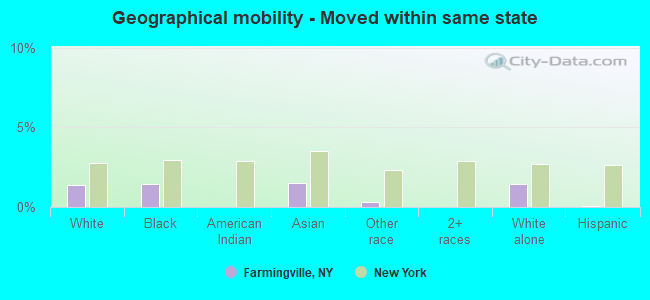
Geographical mobility - Moved from different county within same state (%)
Geographical mobility - Moved from different county within same state (%) - White
Geographical mobility - Moved from different county within same state (%) - Black or African American
Geographical mobility - Moved from different county within same state (%) - Asian
Geographical mobility - Moved from different county within same state (%) - Hispanic or Latino
Geographical mobility - Moved from different county within same state (%) - American Indian and Alaska Native
Geographical mobility - Moved from different county within same state (%) - Multirace
Geographical mobility - Moved from different county within same state (%) - Other Race
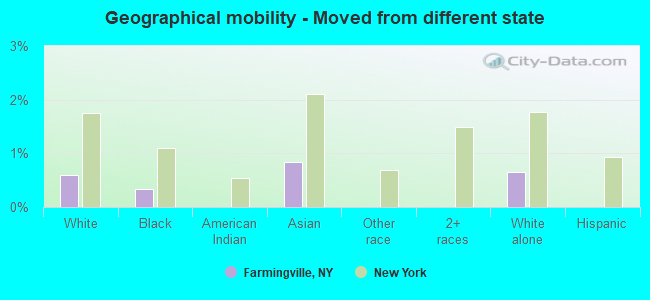
Geographical mobility - Moved from different state (%)
Geographical mobility - Moved from different state (%) - White
Geographical mobility - Moved from different state (%) - Black or African American
Geographical mobility - Moved from different state (%) - Asian
Geographical mobility - Moved from different state (%) - Hispanic or Latino
Geographical mobility - Moved from different state (%) - American Indian and Alaska Native
Geographical mobility - Moved from different state (%) - Multirace
Geographical mobility - Moved from different state (%) - Other Race
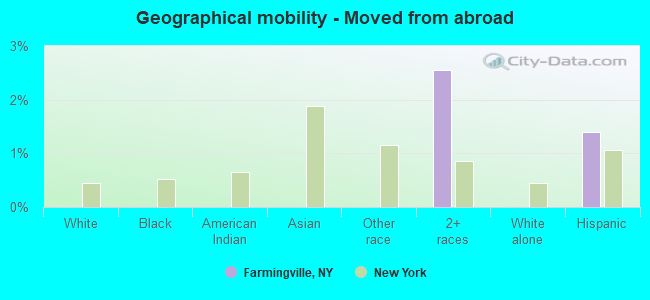
Geographical mobility - Moved from abroad (%)
Geographical mobility - Moved from abroad (%) - White
Geographical mobility - Moved from abroad (%) - Black or African American
Geographical mobility - Moved from abroad (%) - Asian
Geographical mobility - Moved from abroad (%) - Hispanic or Latino
Geographical mobility - Moved from abroad (%) - American Indian and Alaska Native
Geographical mobility - Moved from abroad (%) - Multirace
Geographical mobility - Moved from abroad (%) - Other Race
Place of birth for the foreign-born population - Ireland (%)
Place of birth for the foreign-born population - Denmark (%)
Place of birth for the foreign-born population - Norway (%)
Place of birth for the foreign-born population - Sweden (%)
Place of birth for the foreign-born population - United Kingdom (%)
Place of birth for the foreign-born population - England (%)
Place of birth for the foreign-born population - Scotland (%)
Place of birth for the foreign-born population - Other Northern Europe (%)
Place of birth for the foreign-born population - Austria (%)
Place of birth for the foreign-born population - Belgium (%)
Place of birth for the foreign-born population - France (%)
Place of birth for the foreign-born population - Germany (%)
Place of birth for the foreign-born population - Netherlands (%)
Place of birth for the foreign-born population - Switzerland (%)
Place of birth for the foreign-born population - Other Western Europe (%)
Place of birth for the foreign-born population - Greece (%)
Place of birth for the foreign-born population - Italy (%)
Place of birth for the foreign-born population - Portugal (%)
Place of birth for the foreign-born population - Spain (%)
Place of birth for the foreign-born population - Other Southern Europe (%)
Place of birth for the foreign-born population - Albania (%)
Place of birth for the foreign-born population - Belarus (%)
Place of birth for the foreign-born population - Bosnia and Herzegovina (%)
Place of birth for the foreign-born population - Bulgaria (%)
Place of birth for the foreign-born population - Croatia (%)
Place of birth for the foreign-born population - Czechoslovakia (%)
Place of birth for the foreign-born population - Hungary (%)
Place of birth for the foreign-born population - Latvia (%)
Place of birth for the foreign-born population - Lithuania (%)
Place of birth for the foreign-born population - North Macedonia (Macedonia) (%)
Place of birth for the foreign-born population - Moldova (%)
Place of birth for the foreign-born population - Poland (%)
Place of birth for the foreign-born population - Romania (%)
Place of birth for the foreign-born population - Russia (%)
Place of birth for the foreign-born population - Serbia (%)
Place of birth for the foreign-born population - Ukraine (%)
Place of birth for the foreign-born population - Other Eastern Europe (%)
Place of birth for the foreign-born population - China (%)
Place of birth for the foreign-born population - Hong Kong (%)
Place of birth for the foreign-born population - Taiwan (%)
Place of birth for the foreign-born population - Japan (%)
Place of birth for the foreign-born population - Korea (%)
Place of birth for the foreign-born population - Other Eastern Asia (%)
Place of birth for the foreign-born population - Afghanistan (%)
Place of birth for the foreign-born population - Bangladesh (%)
Place of birth for the foreign-born population - India (%)
Place of birth for the foreign-born population - Iran (%)
Place of birth for the foreign-born population - Kazakhstan (%)
Place of birth for the foreign-born population - Nepal (%)
Place of birth for the foreign-born population - Pakistan (%)
Place of birth for the foreign-born population - Sri Lanka (%)
Place of birth for the foreign-born population - Uzbekistan (%)
Place of birth for the foreign-born population - Other South Central Asia (%)
Place of birth for the foreign-born population - Burma (%)
Place of birth for the foreign-born population - Cambodia (%)
Place of birth for the foreign-born population - Indonesia (%)
Place of birth for the foreign-born population - Laos (%)
Place of birth for the foreign-born population - Malaysia (%)
Place of birth for the foreign-born population - Philippines (%)
Place of birth for the foreign-born population - Singapore (%)
Place of birth for the foreign-born population - Thailand (%)
Place of birth for the foreign-born population - Vietnam (%)
Place of birth for the foreign-born population - Other South Eastern Asia (%)
Place of birth for the foreign-born population - Armenia (%)
Place of birth for the foreign-born population - Iraq (%)
Place of birth for the foreign-born population - Israel (%)
Place of birth for the foreign-born population - Jordan (%)
Place of birth for the foreign-born population - Kuwait (%)
Place of birth for the foreign-born population - Lebanon (%)
Place of birth for the foreign-born population - Saudi Arabia (%)
Place of birth for the foreign-born population - Syria (%)
Place of birth for the foreign-born population - Turkey (%)
Place of birth for the foreign-born population - Yemen (%)
Place of birth for the foreign-born population - Other Western Asia (%)
Place of birth for the foreign-born population - Eritrea (%)
Place of birth for the foreign-born population - Ethiopia (%)
Place of birth for the foreign-born population - Kenya (%)
Place of birth for the foreign-born population - Somalia (%)
Place of birth for the foreign-born population - Uganda (%)
Place of birth for the foreign-born population - Zimbabwe (%)
Place of birth for the foreign-born population - Other Eastern Africa (%)
Place of birth for the foreign-born population - Cameroon (%)
Place of birth for the foreign-born population - Congo (%)
Place of birth for the foreign-born population - Democratic Republic of Congo (Zaire) (%)
Place of birth for the foreign-born population - Other Middle Africa (%)
Place of birth for the foreign-born population - Egypt (%)
Place of birth for the foreign-born population - Morocco (%)
Place of birth for the foreign-born population - Sudan (%)
Place of birth for the foreign-born population - Other Northern Africa (%)
Place of birth for the foreign-born population - South Africa (%)
Place of birth for the foreign-born population - Other Southern Africa (%)
Place of birth for the foreign-born population - Cabo Verde (%)
Place of birth for the foreign-born population - Ghana (%)
Place of birth for the foreign-born population - Liberia (%)
Place of birth for the foreign-born population - Nigeria (%)
Place of birth for the foreign-born population - Senegal (%)
Place of birth for the foreign-born population - Sierra Leone (%)
Place of birth for the foreign-born population - Other Western Africa (%)
Place of birth for the foreign-born population - Australia (%)
Place of birth for the foreign-born population - New Zealand (%)
Place of birth for the foreign-born population - Fiji (%)
Place of birth for the foreign-born population - Micronesia (%)
Place of birth for the foreign-born population - Bahamas (%)
Place of birth for the foreign-born population - Barbados (%)
Place of birth for the foreign-born population - Cuba (%)
Place of birth for the foreign-born population - Dominica (%)
Place of birth for the foreign-born population - Dominican Republic (%)
Place of birth for the foreign-born population - Grenada (%)
Place of birth for the foreign-born population - Haiti (%)
Place of birth for the foreign-born population - Jamaica (%)
Place of birth for the foreign-born population - St. Vincent and the Grenadines (%)
Place of birth for the foreign-born population - Trinidad and Tobago (%)
Place of birth for the foreign-born population - West Indies (%)
Place of birth for the foreign-born population - Other Caribbean (%)
Place of birth for the foreign-born population - Belize (%)
Place of birth for the foreign-born population - Costa Rica (%)
Place of birth for the foreign-born population - El Salvador (%)
Place of birth for the foreign-born population - Guatemala (%)
Place of birth for the foreign-born population - Honduras (%)
Place of birth for the foreign-born population - Mexico (%)
Place of birth for the foreign-born population - Nicaragua (%)
Place of birth for the foreign-born population - Panama (%)
Place of birth for the foreign-born population - Other Central America (%)
Place of birth for the foreign-born population - Argentina (%)
Place of birth for the foreign-born population - Bolivia (%)
Place of birth for the foreign-born population - Brazil (%)
Place of birth for the foreign-born population - Chile (%)
Place of birth for the foreign-born population - Colombia (%)
Place of birth for the foreign-born population - Ecuador (%)
Place of birth for the foreign-born population - Guyana (%)
Place of birth for the foreign-born population - Peru (%)
Place of birth for the foreign-born population - Uruguay (%)
Place of birth for the foreign-born population - Venezuela (%)
Place of birth for the foreign-born population - Other South America (%)
Place of birth for the foreign-born population - Canada (%)
Place of birth for the foreign-born population - Other Northern America (%)
Place of birth for the foreign-born population - Other (%)
Latest news about races in Farmingville, NY collected exclusively by city-data.com from local newspapers, TV, and radio stations
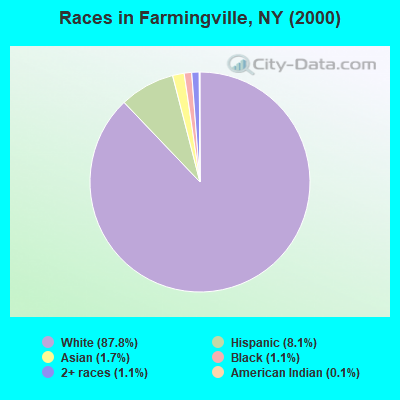
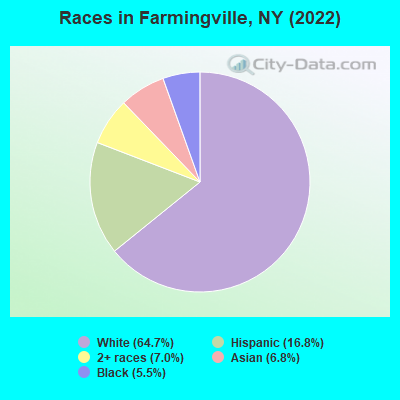
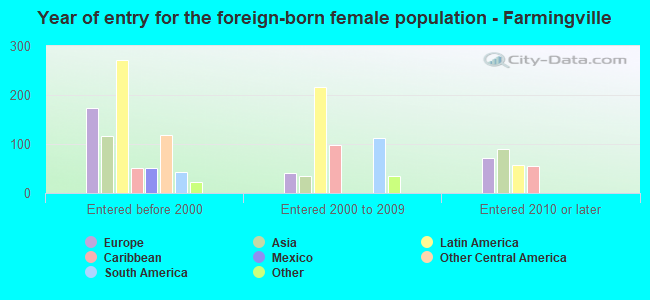
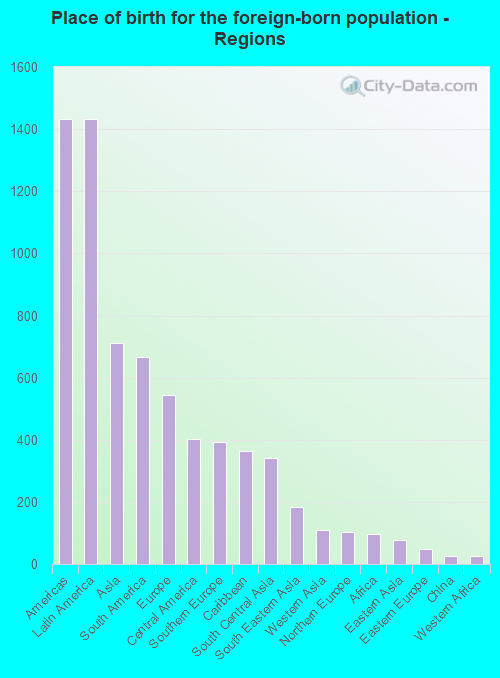
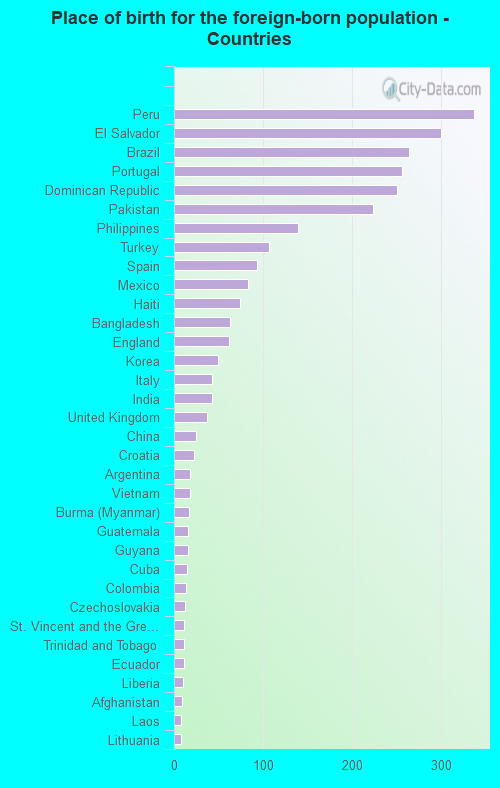
According to 2022 data, the most numerous races in Farmingville, NY are White alone (10,933 residents), Hispanic (2,837 residents), and Black alone (933 residents). 74.0% of Farmingville residents speak English at home. 16.5% of Farmingville, NY residents are foreign-born (8.6% born in Latin America, 4.3% born in Asia, 3.3% born in Europe), which is 33.3% less than the foreign-born rate of 22.0% across the entire state of New York.
Race distribution in Farmingville
2000 2022
11,760,981 62.0% White alone 2,867,583 15.1% Hispanic 2,812,623 14.8% Black alone 1,035,926 5.5% Asian alone 366,116 1.9% Two or more races 75,499 0.4% Other race alone 52,499 0.3% American Indian alone 5,230 0.03% Native Hawaiian and Other
10,408,933 52.9% White alone 3,867,299 19.7% Hispanic 2,633,840 13.4% Black alone 1,776,286 9.0% Asian alone 732,670 3.7% Two or more races 216,110 1.1% Other race alone 35,082 0.2% American Indian alone 6,931 0.04% Native Hawaiian and Other
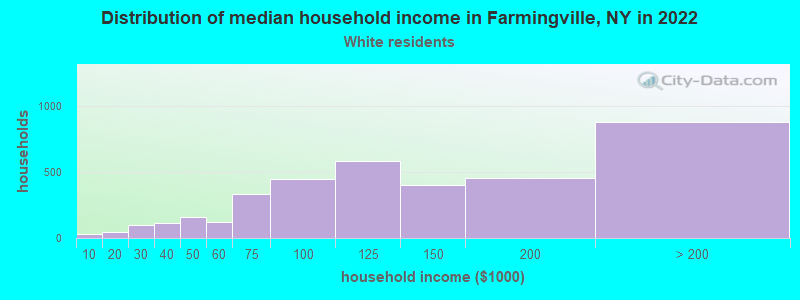
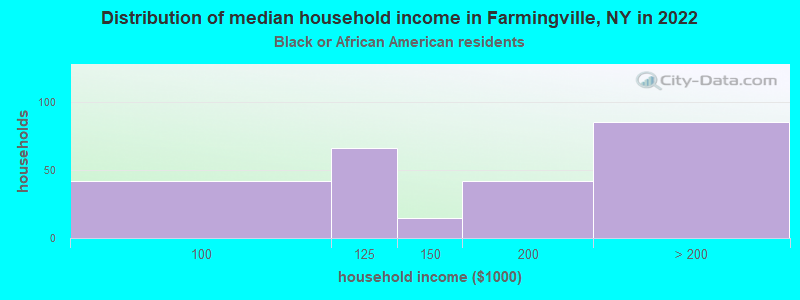
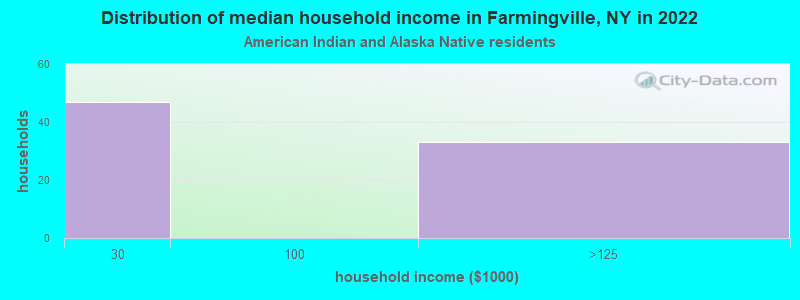
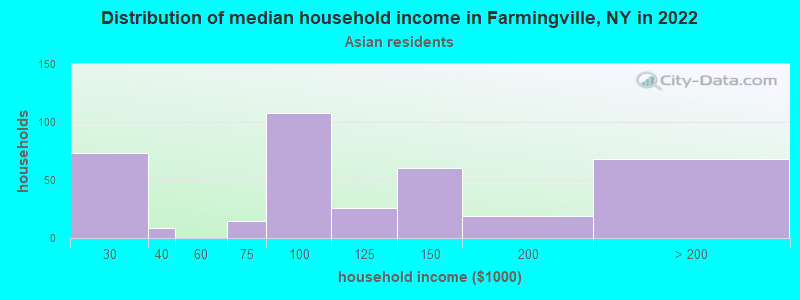
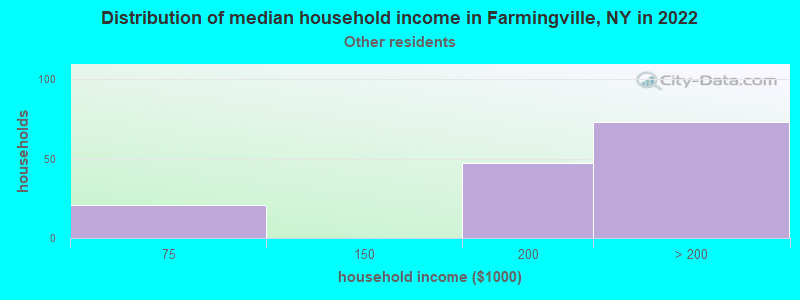
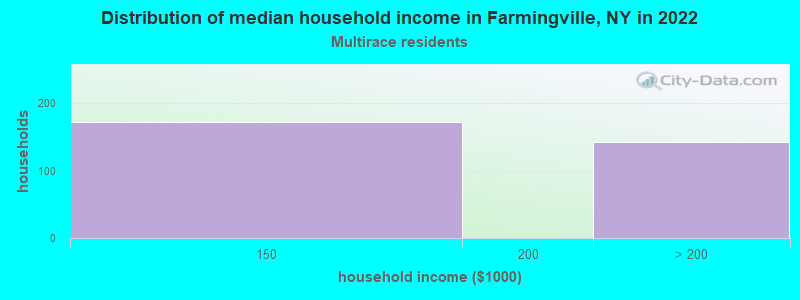
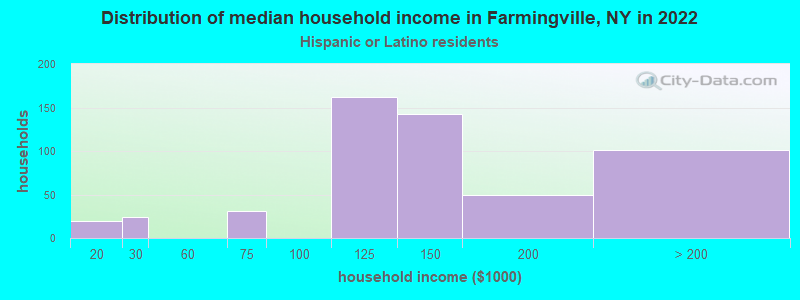
Income and house value in Farmingville Median household income in 2022 $118,458 White non-Hispanic householders$178,473 Black householders$92,324 Asian householdersover $200,000 Some other race householders$140,369 Hispanic or Latino race householdersMedian 2022 house value $471,761 White Non-Hispanic householders$368,709 American Indian or Alaska Native householders $399,654 Asian householders$627,652 Some other race householders$225,371 Two or more races householders$480,519 Hispanic or Latino householders
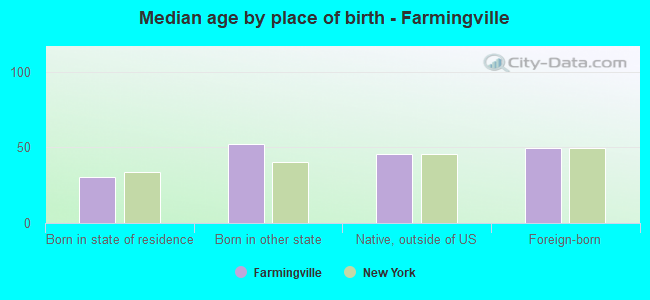
Median age by race in Farmingville
39.7 Median age for White residents36.3 45.0 33.4 Median age for Black or African American residents18.4 33.5 24.5 Median age for American Indian / Alaska Native residents24.0 -513,692,161.9 35.5 Median age for Asian residents36.4 33.0 -742,816,091.2 Median age for Native Hawaiian / Pacific Islander residents-831,187,409.8 -771,300,447.7 32.2 Median age for Other race residents33.1 29.6 24.6 Median age for Two or more races residents24.5 23.4 37.9 Median age for White alone residents35.6 43.0 32.8 Median age for Hispanic or Latino residents26.3 35.6
Owner/renter occupied households by race in Farmingville
House owners and renters - White residents 3,304 89.5% Owner occupied388 10.5% Renter occupiedHouse owners and renters - Black or African American residents 246 100.0% Owner occupiedHouse owners and renters - American Indian / Alaska Native residents 23 18.5% Owner occupied103 81.5% Renter occupiedHouse owners and renters - Asian residents 384 96.7% Owner occupied13 3.3% Renter occupiedHouse owners and renters - Other race residents 137 100.0% Owner occupiedHouse owners and renters - Two or more races residents 203 62.5% Owner occupied122 37.5% Renter occupiedHouse owners and renters - White alone residents 3,143 88.8% Owner occupied396 11.2% Renter occupiedHouse owners and renters - Hispanic or Latino residents 476 85.9% Owner occupied78 14.1% Renter occupied
Language usage in Farmingville
English speakers - Total 74.0% of residents of Farmingville speak English at home.
11.7% of residents speak Spanish at home 912 49.5% Speak English very well931 50.5% Speak English less than very well14.9% of residents speak other language at home 1,748 74.5% Speak English very well599 25.5% Speak English less than very well
English speakers - Born in the United States 72.2% of residents of Farmingville speak English at home.
21.6% of residents speak Spanish at home 168 100.0% Speak English very well4.2% of residents speak other language at home 33 100.0% Speak English very well
English speakers - Native, born elsewhere 10.0% of residents of Farmingville speak English at home.
57.3% of residents speak Spanish at home 50 79.4% Speak English very well13 20.6% Speak English less than very well37.3% of residents speak other language at home 41 100.0% Speak English very well
English speakers - Foreign-born 12.7% of residents of Farmingville speak English at home.
42.0% of residents speak Spanish at home 375 29.5% Speak English very well895 70.5% Speak English less than very well45.4% of residents speak other language at home 808 58.8% Speak English very well566 41.2% Speak English less than very well
White (Caucasian) - Speak only English Native:
97.3% (9,617)Foreign-born:
11.0% (88)
White (Caucasian) - Speak another language Native:
3.4% (331)Foreign-born:
83.3% (664)
Black or African American - Speak only English Native:
76.9% (480)Foreign-born:
37.8% (129)
Black or African American - Speak another language Native:
27.0% (168)Foreign-born:
58.9% (202)
American Indian / Alaska Native - Speak another language Native:
100.0% (197)Foreign-born:
100.0% (174)
Asian - Speak only English Native:
57.2% (260)Foreign-born:
16.0% (101)
Asian - Speak another language Native:
40.7% (185)Foreign-born:
81.0% (514)
Other race - Speak only English Native:
36.6% (205)Foreign-born:
3.8% (20)
Other race - Speak another language Native:
63.1% (353)Foreign-born:
97.0% (506)
Two or more races - Speak another language Native:
38.0% (380)Foreign-born:
100.0% (387)
White alone - Speak only English Native:
96.5% (9,469)Foreign-born:
14.4% (80)
White alone - Speak another language Native:
3.5% (340)Foreign-born:
85.5% (477)
Hispanic or Latino - Speak only English Native:
58.9% (824)Foreign-born:
2.6% (33)
Hispanic or Latino - Speak another language Native:
41.7% (583)Foreign-born:
97.9% (1,245)
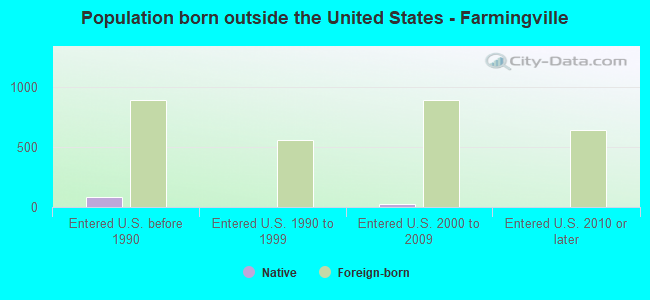
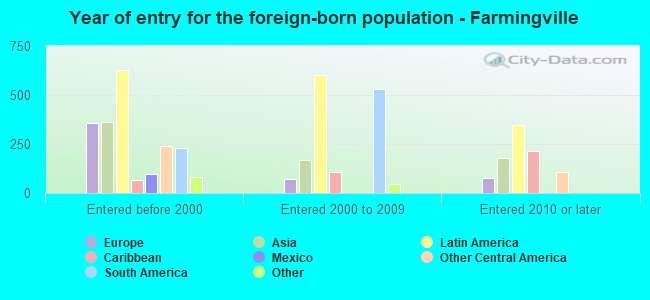
Foreign-born residents in Farmingville 2,789 residents are foreign born (8.6% Latin America , 4.3% Asia , 3.3% Europe ).
This city:
16.5%New York:
22.6%
Marital status for residents in Farmingville Marital status - White (Caucasian) population 15 years and over
Males 41.9% Never married46.4% Now married1.6% Separated5.0% Widowed5.0% DivorcedFemales 32.8% Never married51.1% Now married1.5% Separated5.7% Widowed8.9% DivorcedWomen who gave birth in the past 12 months Now married:
87.9% (120)Unmarried:
12.1% (16)
Women who did not give birth in the past 12 months Now married:
44.2% (1,097)Unmarried:
55.8% (1,383)
Marital status - Black or African American population 15 years and over
Males 19.2% Never married70.1% Now married0.0% Separated0.0% Widowed10.7% DivorcedFemales 26.4% Never married69.4% Now married1.0% Separated2.8% Widowed0.3% DivorcedWomen who gave birth in the past 12 months Now married:
100.0% (38)Unmarried:
0.0% (0)
Women who did not give birth in the past 12 months Now married:
61.4% (161)Unmarried:
38.6% (101)
Marital status - American Indian / Alaska Native population 15 years and over
Males 56.1% Never married43.9% Now married0.0% Separated0.0% Widowed0.0% DivorcedFemales 50.0% Never married50.0% Now married0.0% Separated0.0% Widowed0.0% DivorcedWomen who did not give birth in the past 12 months Now married:
50.0% (57)Unmarried:
50.0% (57)
Marital status - Asian population 15 years and over
Males 43.8% Never married56.2% Now married0.0% Separated0.0% Widowed0.0% DivorcedFemales 29.4% Never married62.7% Now married0.0% Separated7.9% Widowed0.0% DivorcedWomen who gave birth in the past 12 months Now married:
100.0% (40)Unmarried:
0.0% (0)
Women who did not give birth in the past 12 months Now married:
48.3% (116)Unmarried:
51.7% (124)
Marital status - Other race population 15 years and over
Males 79.8% Never married20.2% Now married0.0% Separated0.0% Widowed0.0% DivorcedFemales 46.9% Never married53.1% Now married0.0% Separated0.0% Widowed0.0% DivorcedWomen who did not give birth in the past 12 months Now married:
39.6% (108)Unmarried:
60.4% (165)
Marital status - Two or more races population 15 years and over
Males 58.5% Never married28.7% Now married0.0% Separated0.0% Widowed12.8% DivorcedFemales 36.0% Never married50.0% Now married0.0% Separated0.7% Widowed13.2% DivorcedWomen who gave birth in the past 12 months Now married:
100.0% (48)Unmarried:
0.0% (0)
Women who did not give birth in the past 12 months Now married:
0.0% (0)Unmarried:
100.0% (196)
Marital status - White alone, not Hispanic / Latino population 15 years and over
Males 41.5% Never married46.1% Now married1.8% Separated5.5% Widowed5.2% DivorcedFemales 34.0% Never married48.7% Now married1.7% Separated6.0% Widowed9.6% DivorcedWomen who gave birth in the past 12 months Now married:
87.9% (130)Unmarried:
12.1% (18)
Women who did not give birth in the past 12 months Now married:
42.2% (1,016)Unmarried:
57.8% (1,390)
Marital status - Hispanic or Latino population 15 years and over
Males 64.9% Never married33.8% Now married0.0% Separated0.0% Widowed1.3% DivorcedFemales 33.7% Never married59.3% Now married0.0% Separated1.7% Widowed5.3% DivorcedWomen who did not give birth in the past 12 months Now married:
47.2% (327)Unmarried:
52.8% (365)
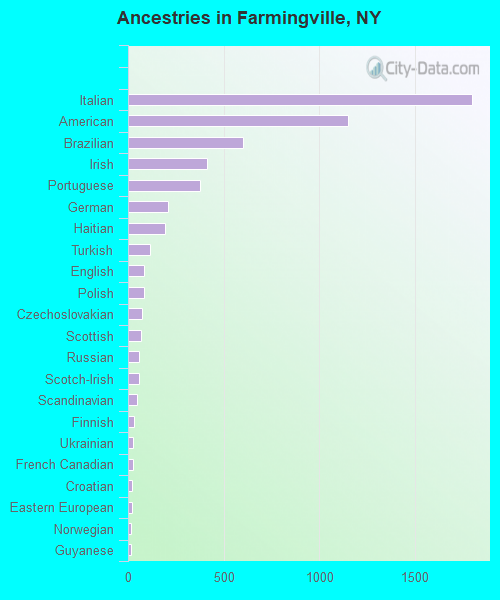
Ancestries in Farmingville
1,798 20.7% Italian1,151 13.2% American600 6.9% Brazilian414 4.8% Irish374 4.3% Portuguese211 2.4% German192 2.2% Haitian117 1.3% Turkish82 0.9% English82 0.9% Polish73 0.8% Czechoslovakian69 0.8% Scottish56 0.6% Russian56 0.6% Scotch-Irish48 0.6% Scandinavian31 0.4% Finnish27 0.3% Ukrainian25 0.3% French Canadian20 0.2% Croatian20 0.2% Eastern European18 0.2% Norwegian17 0.2% Guyanese14 0.2% Greek9 0.1% Slovak9 0.1% Swedish
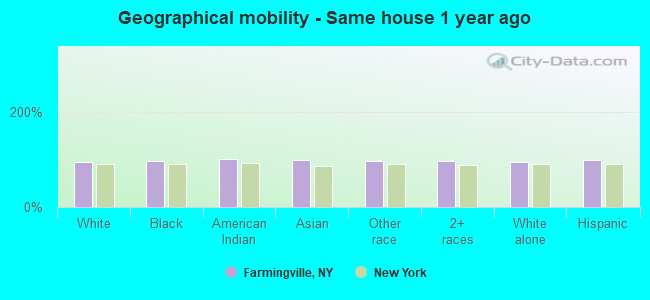
Geographical mobility in Farmingville Same house 1 year ago 10,593 94.6% White (Caucasian)1,082 96.7% Black or African American312 100.0% American Indian / Alaska Native1,100 98.8% Asian1,115 96.8% Other race1,496 97.4% Two or more races10,136 93.9% White alone, not Hispanic / Latino2,775 97.7% Hispanic or LatinoMoved within same county 383 3.4% White / Caucasian11 1.0% Black or African American4 0.3% Other race424 3.9% White alone, not Hispanic / Latino2 0.1% Hispanic or LatinoMoved within same state 152 1.4% White / Caucasian16 1.5% Black or African American17 1.5% Asian4 0.3% Other race159 1.5% White alone, not Hispanic / Latino3 0.1% Hispanic or LatinoMoved from different state 67 0.6% White / Caucasian4 0.3% Black or African American9 0.8% Asian70 0.7% White alone, not Hispanic / LatinoMoved from abroad 39 2.5% Two or more races40 1.4% Hispanic or Latino
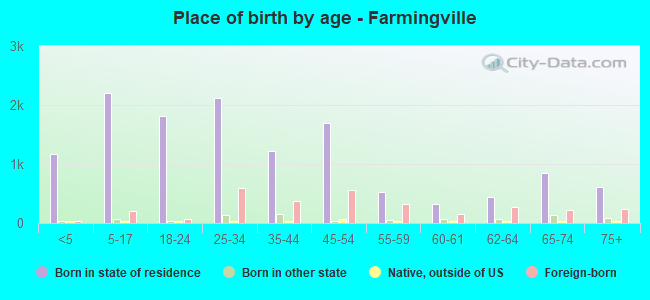
Children Nativity (place of birth) in Farmingville
Children under 6 years - Living with two parents Both parents native 800 99.5% Native4 0.5% Foreign-bornBoth parents foreign-born 118 95.6% Native5 4.4% Foreign-bornOne native, one foreign-born parent 132 100.0% NativeChildren under 6 years - Living with one parent Native parent 91 100.0% NativeForeign-born parent 86 100.0% NativeChildren 6 to 17 years - Living with two parents Both parents native 978 100.0% Native0 0.0% Foreign-bornBoth parents foreign-born 218 73.2% Native80 26.8% Foreign-bornOne native, one foreign-born parent 105 100.0% NativeChildren 6 to 17 years - Living with one parent Native parent 441 96.2% Native17 3.8% Foreign-bornForeign-born parent 157 68.3% Native73 31.7% Foreign-born
Grandparents responsible for own grandchildren in Farmingville
Grandparents (30 to 59 years) White / Caucasian 30 56.4% Responsible for grandchildren24 43.6% Not responsible for grandchildrenWhite alone, not Hispanic / Latino 30 52.4% Responsible for grandchildren27 47.6% Not responsible for grandchildrenGrandparents (60 years and over) White / Caucasian 11 15.2% Responsible for grandchildren64 84.8% Not responsible for grandchildrenWhite alone, not Hispanic / Latino 14 16.6% Responsible for grandchildren70 83.4% Not responsible for grandchildren