Races in Fayetteville, Georgia (GA) Detailed Stats
Data:
Races - White alone (%)
Races - White alone (% change since 2000)
Races - Black alone (%)
Races - Black alone (% change since 2000)
Races - American Indian alone (%)
Races - American Indian alone (% change since 2000)
Races - Asian alone (%)
Races - Asian alone (% change since 2000)
Races - Hispanic (%)
Races - Hispanic (% change since 2000)
Races - Native Hawaiian and Other Pacific Islander alone (%)
Races - Native Hawaiian and Other Pacific Islander alone (% change since 2000)
Races - Two or more races(%)
Races - Two or more races(% change since 2000)
Races - Other race alone (%)
Races - Other race alone (% change since 2000)
Racial diversity
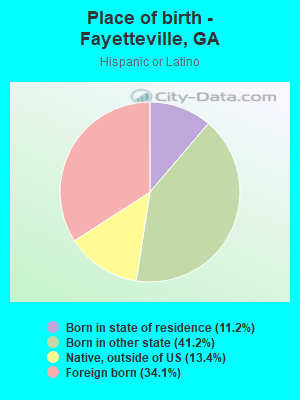
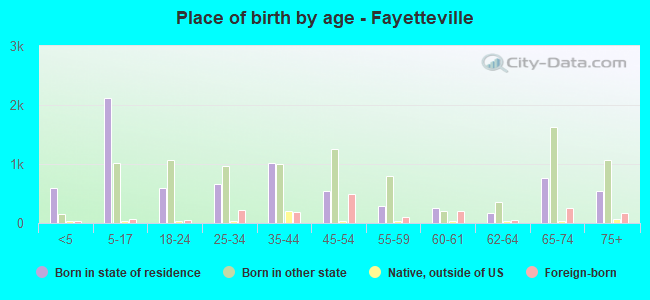
Place of birth - Born in state of residence (%)
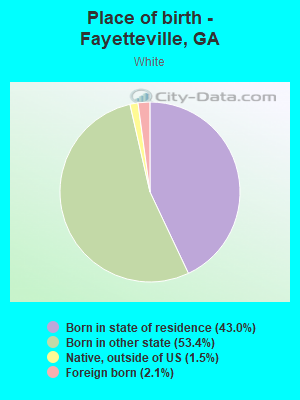
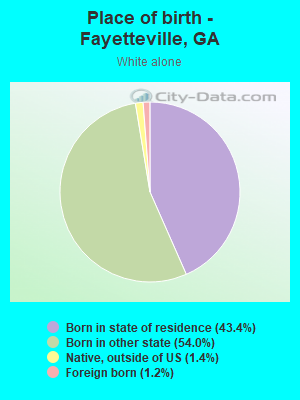
Place of birth - Born in state of residence (%) - White
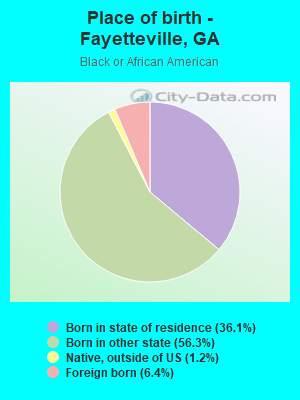
Place of birth - Born in state of residence (%) - Black or African American
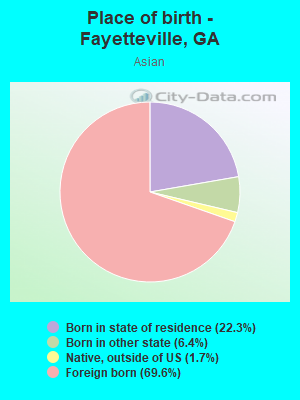
Place of birth - Born in state of residence (%) - Asian
Place of birth - Born in state of residence (%) - Hispanic or Latino
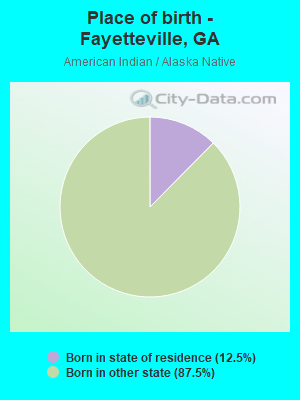
Place of birth - Born in state of residence (%) - American Indian and Alaska Native
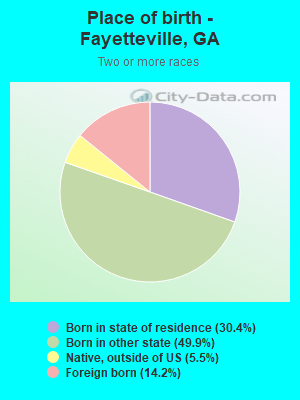
Place of birth - Born in state of residence (%) - Multirace
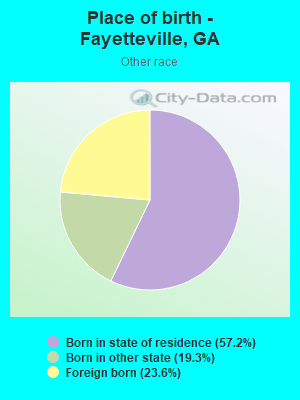
Place of birth - Born in state of residence (%) - Other Race
Place of birth - Born in other state (%)
Place of birth - Born in other state (%) - White
Place of birth - Born in other state (%) - Black or African American
Place of birth - Born in other state (%) - Asian
Place of birth - Born in other state (%) - Hispanic or Latino
Place of birth - Born in other state (%) - American Indian and Alaska Native
Place of birth - Born in other state (%) - Multirace
Place of birth - Born in other state (%) - Other Race
Place of birth - Native, outside of US (%)
Place of birth - Native, outside of US (%) - White
Place of birth - Native, outside of US (%) - Black or African American
Place of birth - Native, outside of US (%) - Asian
Place of birth - Native, outside of US (%) - Hispanic or Latino
Place of birth - Native, outside of US (%) - American Indian and Alaska Native
Place of birth - Native, outside of US (%) - Multirace
Place of birth - Native, outside of US (%) - Other Race
Place of birth - Foreign born (%)
Place of birth - Foreign born (%) - White
Place of birth - Foreign born (%) - Black or African American
Place of birth - Foreign born (%) - Asian
Place of birth - Foreign born (%) - Hispanic or Latino
Place of birth - Foreign born (%) - American Indian and Alaska Native
Place of birth - Foreign born (%) - Multirace
Place of birth - Foreign born (%) - Other Race
Residents speaking English at home (%)
Residents speaking English at home - Born in the United States (%)
Residents speaking English at home - Native, born elsewhere (%)
Residents speaking English at home - Foreign born (%)
Residents speaking Spanish at home (%)
Residents speaking Spanish at home - Born in the United States (%)
Residents speaking Spanish at home - Native, born elsewhere (%)
Residents speaking Spanish at home - Foreign born (%)
Residents speaking other language at home (%)
Residents speaking other language at home - Born in the United States (%)
Residents speaking other language at home - Native, born elsewhere (%)
Residents speaking other language at home - Foreign born (%)
Marital status - Never married (%)
Marital status - Now married (%)
Marital status - Separated (%)
Marital status - Widowed (%)
Marital status - Divorced (%)
Ancestries Reported - Arab (%)
Ancestries Reported - Czech (%)
Ancestries Reported - Danish (%)
Ancestries Reported - Dutch (%)
Ancestries Reported - English (%)
Ancestries Reported - French (%)
Ancestries Reported - French Canadian (%)
Ancestries Reported - German (%)
Ancestries Reported - Greek (%)
Ancestries Reported - Hungarian (%)
Ancestries Reported - Irish (%)
Ancestries Reported - Italian (%)
Ancestries Reported - Lithuanian (%)
Ancestries Reported - Norwegian (%)
Ancestries Reported - Polish (%)
Ancestries Reported - Portuguese (%)
Ancestries Reported - Russian (%)
Ancestries Reported - Scotch-Irish (%)
Ancestries Reported - Scottish (%)
Ancestries Reported - Slovak (%)
Ancestries Reported - Subsaharan African (%)
Ancestries Reported - Swedish (%)
Ancestries Reported - Swiss (%)
Ancestries Reported - Ukrainian (%)
Ancestries Reported - United States (%)
Ancestries Reported - Welsh (%)
Ancestries Reported - West Indian (%)
Ancestries Reported - Other (%)
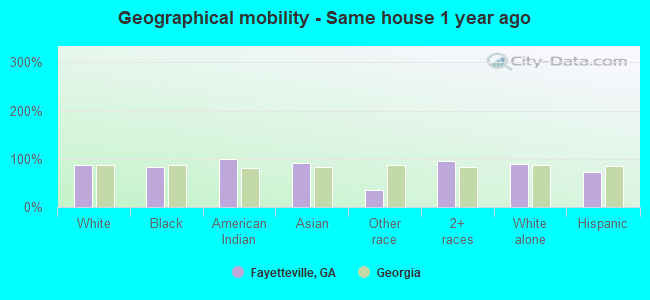
Geographical mobility - Same house 1 year ago (%)
Geographical mobility - Same house 1 year ago (%) - White
Geographical mobility - Same house 1 year ago (%) - Black or African American
Geographical mobility - Same house 1 year ago (%) - Asian
Geographical mobility - Same house 1 year ago (%) - Hispanic or Latino
Geographical mobility - Same house 1 year ago (%) - American Indian and Alaska Native
Geographical mobility - Same house 1 year ago (%) - Multirace
Geographical mobility - Same house 1 year ago (%) - Other Race
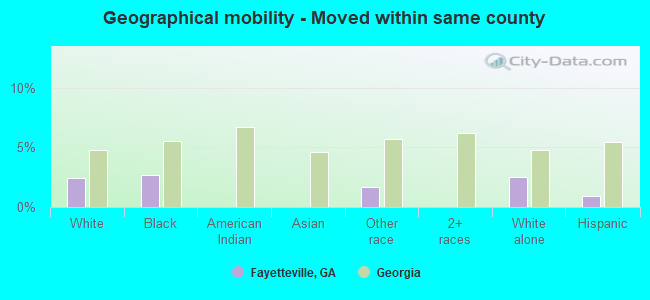
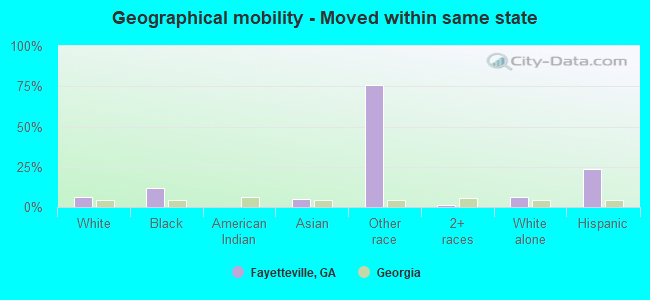
Geographical mobility - Moved within same county (%)
Geographical mobility - Moved within same county (%) - White
Geographical mobility - Moved within same county (%) - Black or African American
Geographical mobility - Moved within same county (%) - Asian
Geographical mobility - Moved within same county (%) - Hispanic or Latino
Geographical mobility - Moved within same county (%) - American Indian and Alaska Native
Geographical mobility - Moved within same county (%) - Multirace
Geographical mobility - Moved within same county (%) - Other Race
Geographical mobility - Moved from different county within same state (%)
Geographical mobility - Moved from different county within same state (%) - White
Geographical mobility - Moved from different county within same state (%) - Black or African American
Geographical mobility - Moved from different county within same state (%) - Asian
Geographical mobility - Moved from different county within same state (%) - Hispanic or Latino
Geographical mobility - Moved from different county within same state (%) - American Indian and Alaska Native
Geographical mobility - Moved from different county within same state (%) - Multirace
Geographical mobility - Moved from different county within same state (%) - Other Race
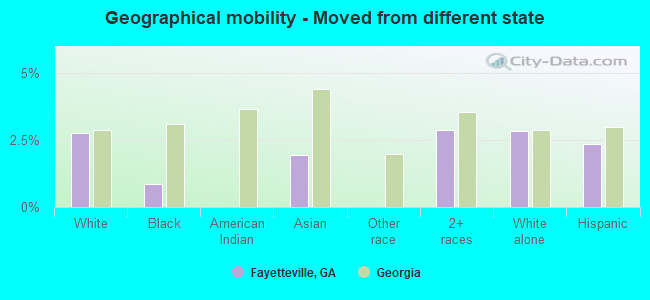
Geographical mobility - Moved from different state (%)
Geographical mobility - Moved from different state (%) - White
Geographical mobility - Moved from different state (%) - Black or African American
Geographical mobility - Moved from different state (%) - Asian
Geographical mobility - Moved from different state (%) - Hispanic or Latino
Geographical mobility - Moved from different state (%) - American Indian and Alaska Native
Geographical mobility - Moved from different state (%) - Multirace
Geographical mobility - Moved from different state (%) - Other Race
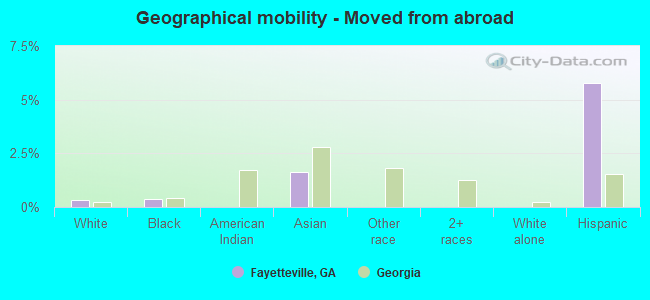
Geographical mobility - Moved from abroad (%)
Geographical mobility - Moved from abroad (%) - White
Geographical mobility - Moved from abroad (%) - Black or African American
Geographical mobility - Moved from abroad (%) - Asian
Geographical mobility - Moved from abroad (%) - Hispanic or Latino
Geographical mobility - Moved from abroad (%) - American Indian and Alaska Native
Geographical mobility - Moved from abroad (%) - Multirace
Geographical mobility - Moved from abroad (%) - Other Race
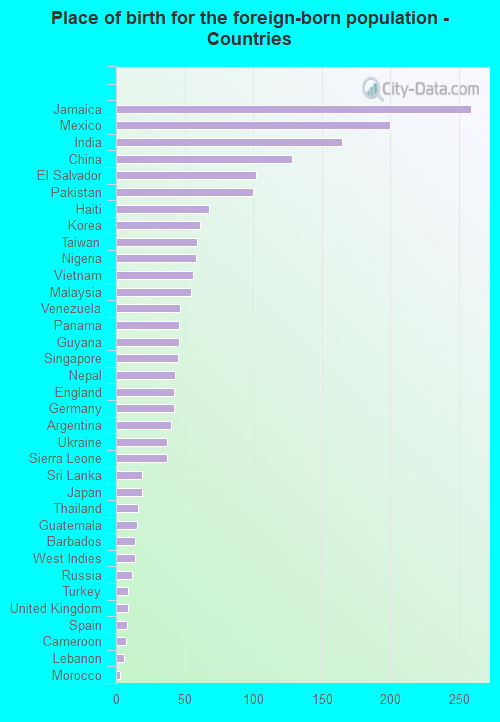
Place of birth for the foreign-born population - Ireland (%)
Place of birth for the foreign-born population - Denmark (%)
Place of birth for the foreign-born population - Norway (%)
Place of birth for the foreign-born population - Sweden (%)
Place of birth for the foreign-born population - United Kingdom (%)
Place of birth for the foreign-born population - England (%)
Place of birth for the foreign-born population - Scotland (%)
Place of birth for the foreign-born population - Other Northern Europe (%)
Place of birth for the foreign-born population - Austria (%)
Place of birth for the foreign-born population - Belgium (%)
Place of birth for the foreign-born population - France (%)
Place of birth for the foreign-born population - Germany (%)
Place of birth for the foreign-born population - Netherlands (%)
Place of birth for the foreign-born population - Switzerland (%)
Place of birth for the foreign-born population - Other Western Europe (%)
Place of birth for the foreign-born population - Greece (%)
Place of birth for the foreign-born population - Italy (%)
Place of birth for the foreign-born population - Portugal (%)
Place of birth for the foreign-born population - Spain (%)
Place of birth for the foreign-born population - Other Southern Europe (%)
Place of birth for the foreign-born population - Albania (%)
Place of birth for the foreign-born population - Belarus (%)
Place of birth for the foreign-born population - Bosnia and Herzegovina (%)
Place of birth for the foreign-born population - Bulgaria (%)
Place of birth for the foreign-born population - Croatia (%)
Place of birth for the foreign-born population - Czechoslovakia (%)
Place of birth for the foreign-born population - Hungary (%)
Place of birth for the foreign-born population - Latvia (%)
Place of birth for the foreign-born population - Lithuania (%)
Place of birth for the foreign-born population - North Macedonia (Macedonia) (%)
Place of birth for the foreign-born population - Moldova (%)
Place of birth for the foreign-born population - Poland (%)
Place of birth for the foreign-born population - Romania (%)
Place of birth for the foreign-born population - Russia (%)
Place of birth for the foreign-born population - Serbia (%)
Place of birth for the foreign-born population - Ukraine (%)
Place of birth for the foreign-born population - Other Eastern Europe (%)
Place of birth for the foreign-born population - China (%)
Place of birth for the foreign-born population - Hong Kong (%)
Place of birth for the foreign-born population - Taiwan (%)
Place of birth for the foreign-born population - Japan (%)
Place of birth for the foreign-born population - Korea (%)
Place of birth for the foreign-born population - Other Eastern Asia (%)
Place of birth for the foreign-born population - Afghanistan (%)
Place of birth for the foreign-born population - Bangladesh (%)
Place of birth for the foreign-born population - India (%)
Place of birth for the foreign-born population - Iran (%)
Place of birth for the foreign-born population - Kazakhstan (%)
Place of birth for the foreign-born population - Nepal (%)
Place of birth for the foreign-born population - Pakistan (%)
Place of birth for the foreign-born population - Sri Lanka (%)
Place of birth for the foreign-born population - Uzbekistan (%)
Place of birth for the foreign-born population - Other South Central Asia (%)
Place of birth for the foreign-born population - Burma (%)
Place of birth for the foreign-born population - Cambodia (%)
Place of birth for the foreign-born population - Indonesia (%)
Place of birth for the foreign-born population - Laos (%)
Place of birth for the foreign-born population - Malaysia (%)
Place of birth for the foreign-born population - Philippines (%)
Place of birth for the foreign-born population - Singapore (%)
Place of birth for the foreign-born population - Thailand (%)
Place of birth for the foreign-born population - Vietnam (%)
Place of birth for the foreign-born population - Other South Eastern Asia (%)
Place of birth for the foreign-born population - Armenia (%)
Place of birth for the foreign-born population - Iraq (%)
Place of birth for the foreign-born population - Israel (%)
Place of birth for the foreign-born population - Jordan (%)
Place of birth for the foreign-born population - Kuwait (%)
Place of birth for the foreign-born population - Lebanon (%)
Place of birth for the foreign-born population - Saudi Arabia (%)
Place of birth for the foreign-born population - Syria (%)
Place of birth for the foreign-born population - Turkey (%)
Place of birth for the foreign-born population - Yemen (%)
Place of birth for the foreign-born population - Other Western Asia (%)
Place of birth for the foreign-born population - Eritrea (%)
Place of birth for the foreign-born population - Ethiopia (%)
Place of birth for the foreign-born population - Kenya (%)
Place of birth for the foreign-born population - Somalia (%)
Place of birth for the foreign-born population - Uganda (%)
Place of birth for the foreign-born population - Zimbabwe (%)
Place of birth for the foreign-born population - Other Eastern Africa (%)
Place of birth for the foreign-born population - Cameroon (%)
Place of birth for the foreign-born population - Congo (%)
Place of birth for the foreign-born population - Democratic Republic of Congo (Zaire) (%)
Place of birth for the foreign-born population - Other Middle Africa (%)
Place of birth for the foreign-born population - Egypt (%)
Place of birth for the foreign-born population - Morocco (%)
Place of birth for the foreign-born population - Sudan (%)
Place of birth for the foreign-born population - Other Northern Africa (%)
Place of birth for the foreign-born population - South Africa (%)
Place of birth for the foreign-born population - Other Southern Africa (%)
Place of birth for the foreign-born population - Cabo Verde (%)
Place of birth for the foreign-born population - Ghana (%)
Place of birth for the foreign-born population - Liberia (%)
Place of birth for the foreign-born population - Nigeria (%)
Place of birth for the foreign-born population - Senegal (%)
Place of birth for the foreign-born population - Sierra Leone (%)
Place of birth for the foreign-born population - Other Western Africa (%)
Place of birth for the foreign-born population - Australia (%)
Place of birth for the foreign-born population - New Zealand (%)
Place of birth for the foreign-born population - Fiji (%)
Place of birth for the foreign-born population - Micronesia (%)
Place of birth for the foreign-born population - Bahamas (%)
Place of birth for the foreign-born population - Barbados (%)
Place of birth for the foreign-born population - Cuba (%)
Place of birth for the foreign-born population - Dominica (%)
Place of birth for the foreign-born population - Dominican Republic (%)
Place of birth for the foreign-born population - Grenada (%)
Place of birth for the foreign-born population - Haiti (%)
Place of birth for the foreign-born population - Jamaica (%)
Place of birth for the foreign-born population - St. Vincent and the Grenadines (%)
Place of birth for the foreign-born population - Trinidad and Tobago (%)
Place of birth for the foreign-born population - West Indies (%)
Place of birth for the foreign-born population - Other Caribbean (%)
Place of birth for the foreign-born population - Belize (%)
Place of birth for the foreign-born population - Costa Rica (%)
Place of birth for the foreign-born population - El Salvador (%)
Place of birth for the foreign-born population - Guatemala (%)
Place of birth for the foreign-born population - Honduras (%)
Place of birth for the foreign-born population - Mexico (%)
Place of birth for the foreign-born population - Nicaragua (%)
Place of birth for the foreign-born population - Panama (%)
Place of birth for the foreign-born population - Other Central America (%)
Place of birth for the foreign-born population - Argentina (%)
Place of birth for the foreign-born population - Bolivia (%)
Place of birth for the foreign-born population - Brazil (%)
Place of birth for the foreign-born population - Chile (%)
Place of birth for the foreign-born population - Colombia (%)
Place of birth for the foreign-born population - Ecuador (%)
Place of birth for the foreign-born population - Guyana (%)
Place of birth for the foreign-born population - Peru (%)
Place of birth for the foreign-born population - Uruguay (%)
Place of birth for the foreign-born population - Venezuela (%)
Place of birth for the foreign-born population - Other South America (%)
Place of birth for the foreign-born population - Canada (%)
Place of birth for the foreign-born population - Other Northern America (%)
Place of birth for the foreign-born population - Other (%)
Latest news about races in Fayetteville, GA collected exclusively by city-data.com from local newspapers, TV, and radio stations
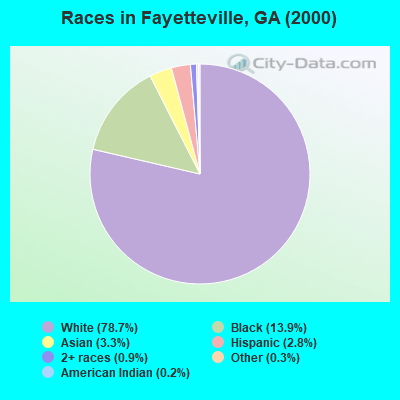
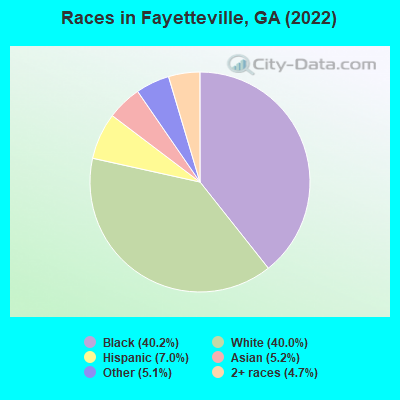
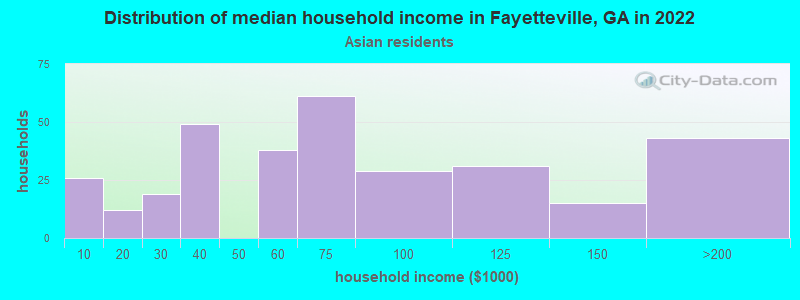
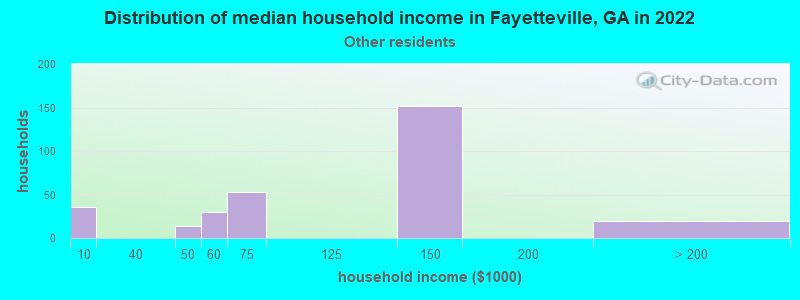
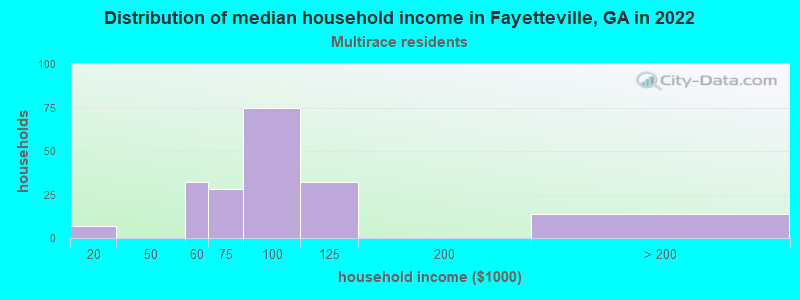
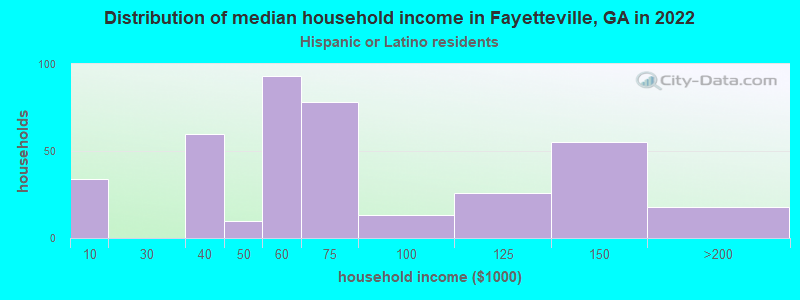
According to 2022 data, the most numerous races in Fayetteville, GA are White alone (7,783 residents), Black alone (7,818 residents), and Hispanic (1,368 residents). 87.7% of Fayetteville residents speak English at home. 10.0% of Fayetteville, GA residents are foreign-born (4.5% born in Latin America, 4.0% born in Asia), which is about the same as the foreign-born rate of 10.0% across the entire state of Georgia.
Race distribution in Fayetteville
2000 2022
5,128,661 62.6% White alone 2,331,465 28.5% Black alone 435,227 5.3% Hispanic 171,513 2.1% Asian alone 87,364 1.1% Two or more races 17,670 0.2% American Indian alone 11,275 0.1% Other race alone 3,278 0.04% Native Hawaiian and Other
5,415,657 49.6% White alone 3,349,240 30.7% Black alone 1,132,604 10.4% Hispanic 479,156 4.4% Asian alone 462,923 4.2% Two or more races 54,416 0.5% Other race alone 11,923 0.1% American Indian alone 6,957 0.06% Native Hawaiian and Other
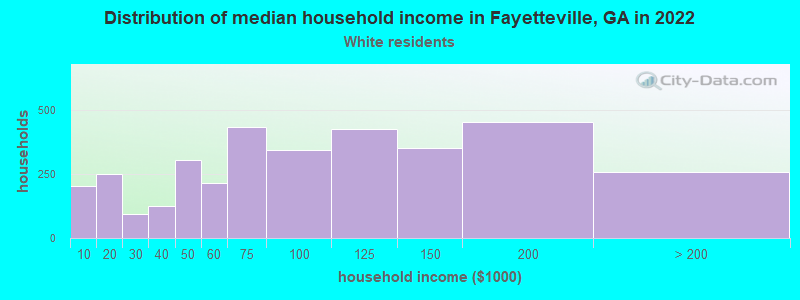
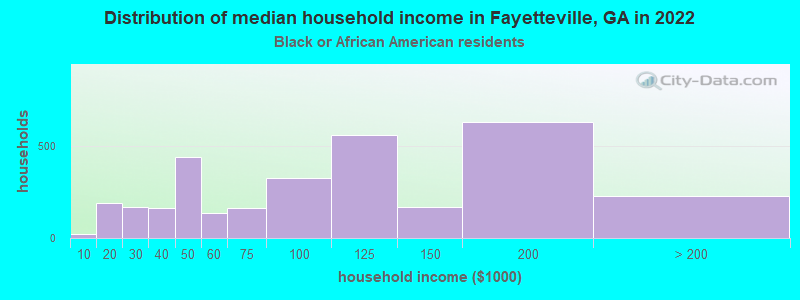
Income and house value in Fayetteville Median household income in 2022 $87,092 White non-Hispanic householders$80,675 Black householders$73,949 Asian householders$91,063 Two or more races householders$62,674 Hispanic or Latino race householdersMedian 2022 house value $326,027 White Non-Hispanic householders$461,378 Black or African American householders$555,729 American Indian or Alaska Native householders $339,612 Asian householders$451,005 Two or more races householders$321,582 Hispanic or Latino householders
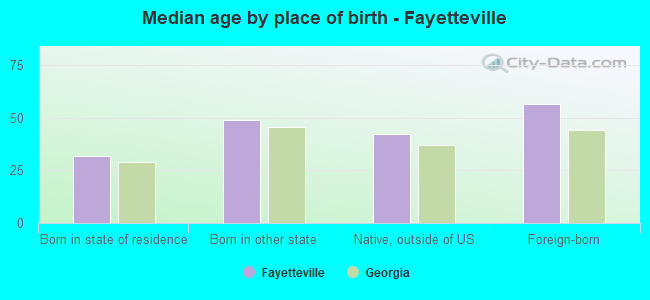
Median age by race in Fayetteville
54.3 Median age for White residents49.6 56.5 39.6 Median age for Black or African American residents37.3 46.6 15.8 Median age for American Indian / Alaska Native residents-597,222,221.6 13.9 54.0 Median age for Asian residents46.5 52.6 -657,243,815.6 Median age for Native Hawaiian / Pacific Islander residents-666,666,666.0 -666,666,666.0 38.6 Median age for Other race residents36.5 41.8 28.0 Median age for Two or more races residents25.0 34.8 55.3 Median age for White alone residents50.1 57.3 36.3 Median age for Hispanic or Latino residents36.5 36.8
Owner/renter occupied households by race in Fayetteville
House owners and renters - White residents 2,751 79.3% Owner occupied717 20.7% Renter occupiedHouse owners and renters - Black or African American residents 1,897 54.5% Owner occupied1,584 45.5% Renter occupiedHouse owners and renters - American Indian / Alaska Native residents 15 100.0% Renter occupiedHouse owners and renters - Asian residents 340 89.1% Owner occupied42 10.9% Renter occupiedHouse owners and renters - Other race residents 107 37.5% Owner occupied178 62.5% Renter occupiedHouse owners and renters - Two or more races residents 188 100.0% Owner occupiedHouse owners and renters - White alone residents 2,676 78.5% Owner occupied732 21.5% Renter occupiedHouse owners and renters - Hispanic or Latino residents 275 58.7% Owner occupied193 41.3% Renter occupied
Language usage in Fayetteville
English speakers - Total 87.7% of residents of Fayetteville speak English at home.
5.4% of residents speak Spanish at home 732 72.6% Speak English very well276 27.4% Speak English less than very well7.0% of residents speak other language at home 802 61.0% Speak English very well512 39.0% Speak English less than very well
English speakers - Born in the United States 95.0% of residents of Fayetteville speak English at home.
2.7% of residents speak Spanish at home 234 92.5% Speak English very well19 7.5% Speak English less than very well1.9% of residents speak other language at home 177 100.0% Speak English very well
English speakers - Native, born elsewhere 43.4% of residents of Fayetteville speak English at home.
51.7% of residents speak Spanish at home 76 45.0% Speak English very well93 55.0% Speak English less than very well5.5% of residents speak other language at home 18 100.0% Speak English very well
English speakers - Foreign-born 29.1% of residents of Fayetteville speak English at home.
24.5% of residents speak Spanish at home 333 68.5% Speak English very well153 31.5% Speak English less than very well47.9% of residents speak other language at home 429 45.1% Speak English very well522 54.9% Speak English less than very well
White (Caucasian) - Speak only English Native:
98.9% (7,486)Foreign-born:
22.3% (38)
White (Caucasian) - Speak another language Native:
1.5% (113)Foreign-born:
73.1% (123)
Black or African American - Speak only English Native:
93.7% (6,273)Foreign-born:
72.6% (411)
Black or African American - Speak another language Native:
6.6% (441)Foreign-born:
26.3% (149)
Asian - Speak only English Native:
15.6% (43)Foreign-born:
3.9% (30)
Asian - Speak another language Native:
99.8% (274)Foreign-born:
100.0% (761)
Other race - Speak only English Native:
63.7% (367)Foreign-born:
13.8% (44)
Other race - Speak another language Native:
14.6% (84)Foreign-born:
86.3% (278)
Two or more races - Speak only English Native:
84.0% (837)Foreign-born:
22.1% (41)
Two or more races - Speak another language Native:
15.4% (154)Foreign-born:
77.7% (145)
White alone - Speak only English Native:
99.3% (7,429)Foreign-born:
44.8% (42)
White alone - Speak another language Native:
0.7% (56)Foreign-born:
52.3% (50)
Hispanic or Latino - Speak only English Native:
34.0% (296)Foreign-born:
7.2% (34)
Hispanic or Latino - Speak another language Native:
58.5% (510)Foreign-born:
92.7% (436)
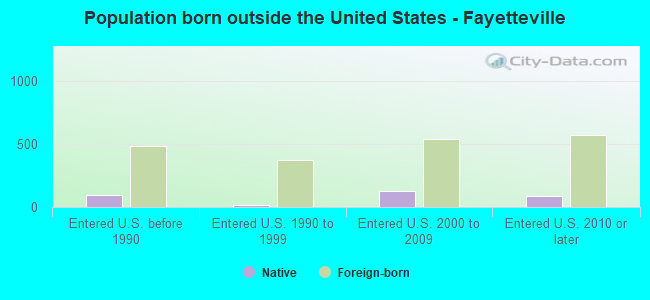
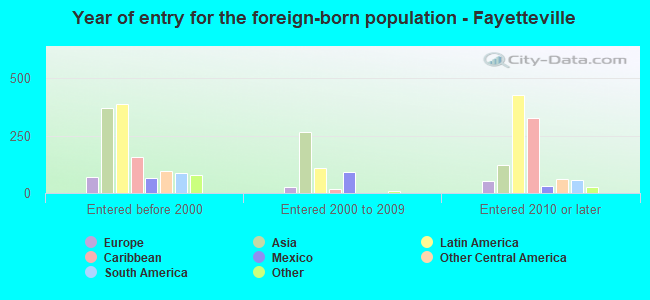
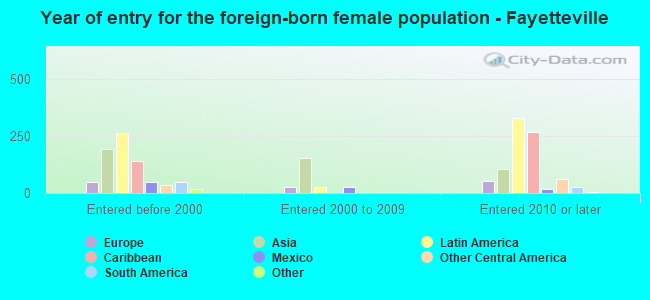
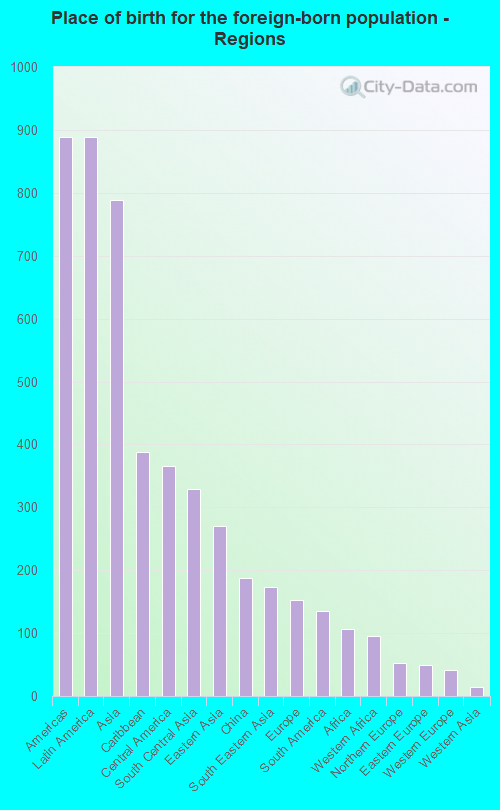
Foreign-born residents in Fayetteville 1,938 residents are foreign born (4.5% Latin America , 4.0% Asia ).
This city:
10.0%Georgia:
10.4%
Marital status for residents in Fayetteville Marital status - White (Caucasian) population 15 years and over
Males 20.3% Never married66.4% Now married0.3% Separated3.3% Widowed9.8% DivorcedFemales 23.4% Never married50.7% Now married0.3% Separated13.5% Widowed12.0% DivorcedWomen who gave birth in the past 12 months Now married:
100.0% (61)Unmarried:
0.0% (0)
Women who did not give birth in the past 12 months Now married:
45.3% (576)Unmarried:
54.7% (695)
Marital status - Black or African American population 15 years and over
Males 39.6% Never married44.8% Now married1.3% Separated3.0% Widowed11.3% DivorcedFemales 33.2% Never married38.1% Now married2.4% Separated4.5% Widowed21.8% DivorcedWomen who gave birth in the past 12 months Now married:
21.5% (48)Unmarried:
78.5% (177)
Women who did not give birth in the past 12 months Now married:
31.3% (568)Unmarried:
68.7% (1,244)
Marital status - American Indian / Alaska Native population 15 years and over
Males 0.0% Never married100.0% Now married0.0% Separated0.0% Widowed0.0% DivorcedFemales 61.3% Never married38.7% Now married0.0% Separated0.0% Widowed0.0% DivorcedWomen who gave birth in the past 12 months Now married:
100.0% (19)Unmarried:
0.0% (0)
Women who did not give birth in the past 12 months Now married:
0.0% (0)Unmarried:
100.0% (30)
Marital status - Asian population 15 years and over
Males 25.8% Never married65.1% Now married0.0% Separated0.0% Widowed9.1% DivorcedFemales 26.8% Never married44.1% Now married0.0% Separated18.6% Widowed10.4% DivorcedWomen who gave birth in the past 12 months Now married:
100.0% (3)Unmarried:
0.0% (0)
Women who did not give birth in the past 12 months Now married:
44.4% (140)Unmarried:
55.6% (175)
Marital status - Other race population 15 years and over
Males 41.6% Never married32.2% Now married5.7% Separated0.0% Widowed20.5% DivorcedFemales 44.2% Never married44.2% Now married0.0% Separated0.0% Widowed11.6% DivorcedWomen who gave birth in the past 12 months Now married:
0.0% (0)Unmarried:
100.0% (18)
Women who did not give birth in the past 12 months Now married:
29.8% (54)Unmarried:
70.2% (128)
Marital status - Two or more races population 15 years and over
Males 31.0% Never married64.0% Now married0.0% Separated0.0% Widowed5.0% DivorcedFemales 57.3% Never married42.7% Now married0.0% Separated0.0% Widowed0.0% DivorcedWomen who gave birth in the past 12 months Now married:
100.0% (13)Unmarried:
0.0% (0)
Women who did not give birth in the past 12 months Now married:
34.6% (145)Unmarried:
65.4% (274)
Marital status - White alone, not Hispanic / Latino population 15 years and over
Males 20.8% Never married66.2% Now married0.3% Separated3.4% Widowed9.4% DivorcedFemales 24.1% Never married50.4% Now married0.0% Separated13.4% Widowed12.1% DivorcedWomen who gave birth in the past 12 months Now married:
100.0% (63)Unmarried:
0.0% (0)
Women who did not give birth in the past 12 months Now married:
43.2% (544)Unmarried:
56.8% (715)
Marital status - Hispanic or Latino population 15 years and over
Males 22.6% Never married67.8% Now married5.4% Separated0.0% Widowed4.1% DivorcedFemales 41.1% Never married32.6% Now married2.1% Separated5.3% Widowed18.9% DivorcedWomen who gave birth in the past 12 months Now married:
46.2% (13)Unmarried:
53.8% (16)
Women who did not give birth in the past 12 months Now married:
27.5% (113)Unmarried:
72.5% (299)
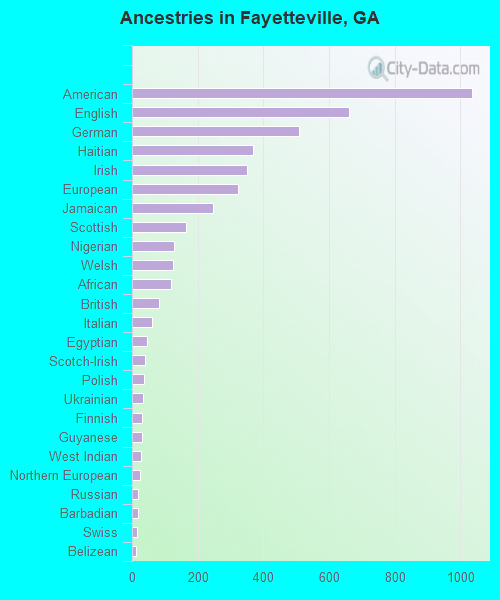
Ancestries in Fayetteville
1,036 10.1% American661 6.5% English509 5.0% German368 3.6% Haitian350 3.4% Irish322 3.1% European248 2.4% Jamaican166 1.6% Scottish127 1.2% Nigerian125 1.2% Welsh119 1.2% African81 0.8% British62 0.6% Italian45 0.4% Egyptian40 0.4% Scotch-Irish36 0.4% Polish34 0.3% Ukrainian29 0.3% Finnish29 0.3% Guyanese28 0.3% West Indian24 0.2% Northern European19 0.2% Russian17 0.2% Barbadian14 0.1% Swiss13 0.1% Belizean12 0.1% Bahamian10 0.10% Sierra Leonean7 0.07% Swedish7 0.07% Turkish7 0.07% Dutch5 0.05% Arab3 0.03% French2 0.02% Moroccan
Children Nativity (place of birth) in Fayetteville
Children under 6 years - Living with two parents Both parents native 494 100.0% NativeBoth parents foreign-born 85 100.0% NativeOne native, one foreign-born parent 48 100.0% NativeChildren under 6 years - Living with one parent Native parent 186 100.0% NativeForeign-born parent 38 100.0% NativeChildren 6 to 17 years - Living with two parents Both parents native 1,343 100.0% NativeBoth parents foreign-born 206 84.7% Native37 15.3% Foreign-bornOne native, one foreign-born parent 222 100.0% NativeChildren 6 to 17 years - Living with one parent Native parent 1,277 100.0% NativeForeign-born parent 159 53.0% Native141 47.0% Foreign-born
Grandparents responsible for own grandchildren in Fayetteville
Grandparents (30 to 59 years) White / Caucasian 66 100.0% Not responsible for grandchildrenWhite alone, not Hispanic / Latino 72 100.0% Not responsible for grandchildren
Grandparents (60 years and over) White / Caucasian 140 100.0% Not responsible for grandchildrenWhite alone, not Hispanic / Latino 129 100.0% Not responsible for grandchildren