Races in Ferndale, Michigan (MI) Detailed Stats
Data:
Races - White alone (%)
Races - White alone (% change since 2000)
Races - Black alone (%)
Races - Black alone (% change since 2000)
Races - American Indian alone (%)
Races - American Indian alone (% change since 2000)
Races - Asian alone (%)
Races - Asian alone (% change since 2000)
Races - Hispanic (%)
Races - Hispanic (% change since 2000)
Races - Native Hawaiian and Other Pacific Islander alone (%)
Races - Native Hawaiian and Other Pacific Islander alone (% change since 2000)
Races - Two or more races(%)
Races - Two or more races(% change since 2000)
Races - Other race alone (%)
Races - Other race alone (% change since 2000)
Racial diversity
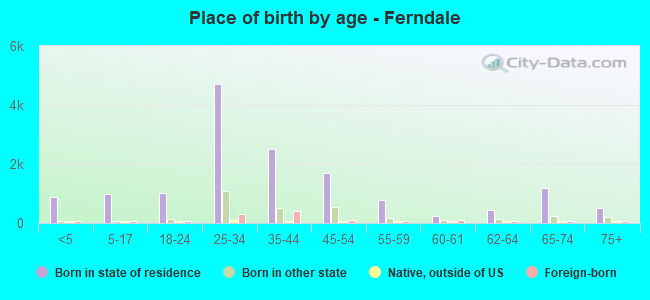
Place of birth - Born in state of residence (%)
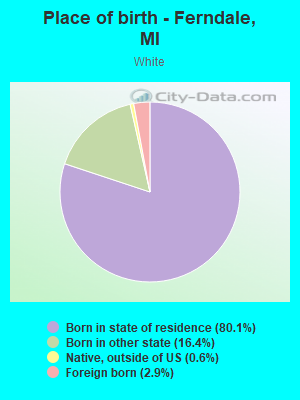
Place of birth - Born in state of residence (%) - White
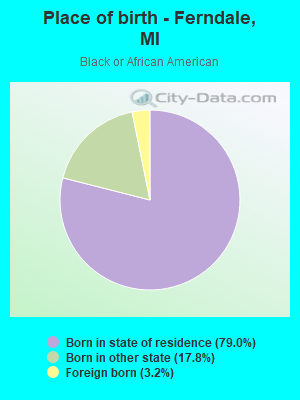
Place of birth - Born in state of residence (%) - Black or African American
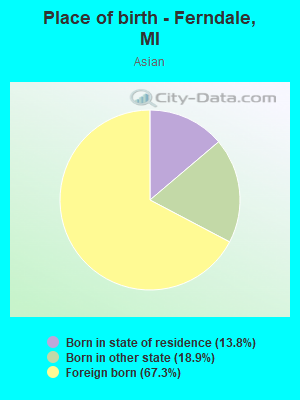
Place of birth - Born in state of residence (%) - Asian
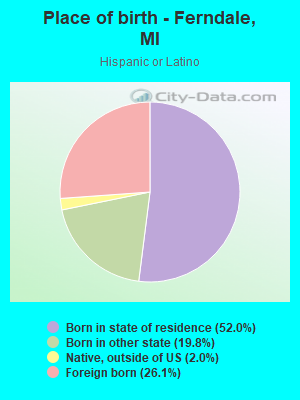
Place of birth - Born in state of residence (%) - Hispanic or Latino
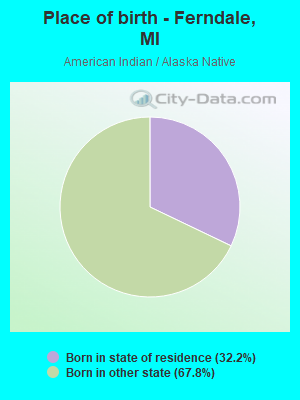
Place of birth - Born in state of residence (%) - American Indian and Alaska Native
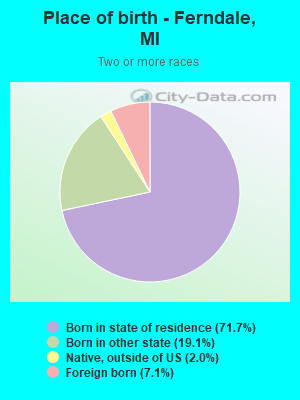
Place of birth - Born in state of residence (%) - Multirace
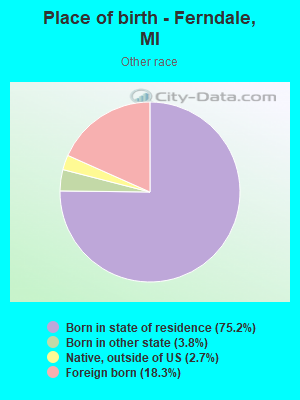
Place of birth - Born in state of residence (%) - Other Race
Place of birth - Born in other state (%)
Place of birth - Born in other state (%) - White
Place of birth - Born in other state (%) - Black or African American
Place of birth - Born in other state (%) - Asian
Place of birth - Born in other state (%) - Hispanic or Latino
Place of birth - Born in other state (%) - American Indian and Alaska Native
Place of birth - Born in other state (%) - Multirace
Place of birth - Born in other state (%) - Other Race
Place of birth - Native, outside of US (%)
Place of birth - Native, outside of US (%) - White
Place of birth - Native, outside of US (%) - Black or African American
Place of birth - Native, outside of US (%) - Asian
Place of birth - Native, outside of US (%) - Hispanic or Latino
Place of birth - Native, outside of US (%) - American Indian and Alaska Native
Place of birth - Native, outside of US (%) - Multirace
Place of birth - Native, outside of US (%) - Other Race
Place of birth - Foreign born (%)
Place of birth - Foreign born (%) - White
Place of birth - Foreign born (%) - Black or African American
Place of birth - Foreign born (%) - Asian
Place of birth - Foreign born (%) - Hispanic or Latino
Place of birth - Foreign born (%) - American Indian and Alaska Native
Place of birth - Foreign born (%) - Multirace
Place of birth - Foreign born (%) - Other Race
Residents speaking English at home (%)
Residents speaking English at home - Born in the United States (%)
Residents speaking English at home - Native, born elsewhere (%)
Residents speaking English at home - Foreign born (%)
Residents speaking Spanish at home (%)
Residents speaking Spanish at home - Born in the United States (%)
Residents speaking Spanish at home - Native, born elsewhere (%)
Residents speaking Spanish at home - Foreign born (%)
Residents speaking other language at home (%)
Residents speaking other language at home - Born in the United States (%)
Residents speaking other language at home - Native, born elsewhere (%)
Residents speaking other language at home - Foreign born (%)
Marital status - Never married (%)
Marital status - Now married (%)
Marital status - Separated (%)
Marital status - Widowed (%)
Marital status - Divorced (%)
Ancestries Reported - Arab (%)
Ancestries Reported - Czech (%)
Ancestries Reported - Danish (%)
Ancestries Reported - Dutch (%)
Ancestries Reported - English (%)
Ancestries Reported - French (%)
Ancestries Reported - French Canadian (%)
Ancestries Reported - German (%)
Ancestries Reported - Greek (%)
Ancestries Reported - Hungarian (%)
Ancestries Reported - Irish (%)
Ancestries Reported - Italian (%)
Ancestries Reported - Lithuanian (%)
Ancestries Reported - Norwegian (%)
Ancestries Reported - Polish (%)
Ancestries Reported - Portuguese (%)
Ancestries Reported - Russian (%)
Ancestries Reported - Scotch-Irish (%)
Ancestries Reported - Scottish (%)
Ancestries Reported - Slovak (%)
Ancestries Reported - Subsaharan African (%)
Ancestries Reported - Swedish (%)
Ancestries Reported - Swiss (%)
Ancestries Reported - Ukrainian (%)
Ancestries Reported - United States (%)
Ancestries Reported - Welsh (%)
Ancestries Reported - West Indian (%)
Ancestries Reported - Other (%)
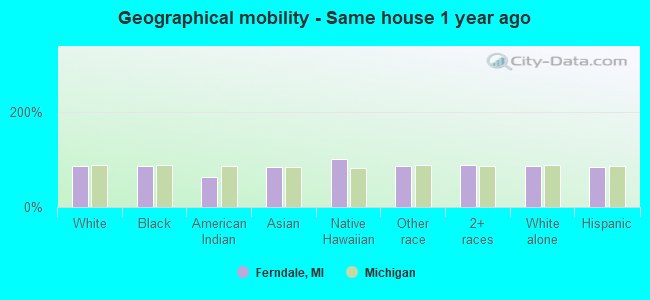
Geographical mobility - Same house 1 year ago (%)
Geographical mobility - Same house 1 year ago (%) - White
Geographical mobility - Same house 1 year ago (%) - Black or African American
Geographical mobility - Same house 1 year ago (%) - Asian
Geographical mobility - Same house 1 year ago (%) - Hispanic or Latino
Geographical mobility - Same house 1 year ago (%) - American Indian and Alaska Native
Geographical mobility - Same house 1 year ago (%) - Multirace
Geographical mobility - Same house 1 year ago (%) - Other Race
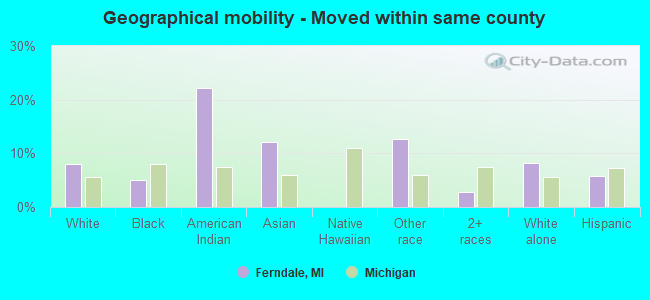
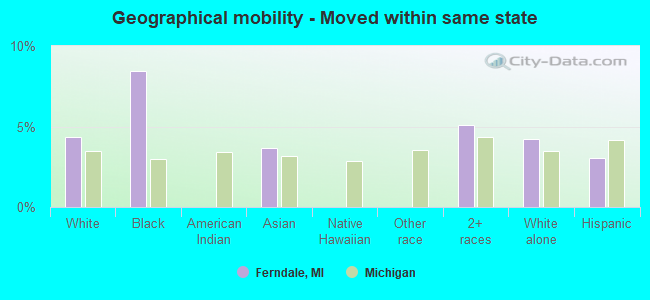
Geographical mobility - Moved within same county (%)
Geographical mobility - Moved within same county (%) - White
Geographical mobility - Moved within same county (%) - Black or African American
Geographical mobility - Moved within same county (%) - Asian
Geographical mobility - Moved within same county (%) - Hispanic or Latino
Geographical mobility - Moved within same county (%) - American Indian and Alaska Native
Geographical mobility - Moved within same county (%) - Multirace
Geographical mobility - Moved within same county (%) - Other Race
Geographical mobility - Moved from different county within same state (%)
Geographical mobility - Moved from different county within same state (%) - White
Geographical mobility - Moved from different county within same state (%) - Black or African American
Geographical mobility - Moved from different county within same state (%) - Asian
Geographical mobility - Moved from different county within same state (%) - Hispanic or Latino
Geographical mobility - Moved from different county within same state (%) - American Indian and Alaska Native
Geographical mobility - Moved from different county within same state (%) - Multirace
Geographical mobility - Moved from different county within same state (%) - Other Race
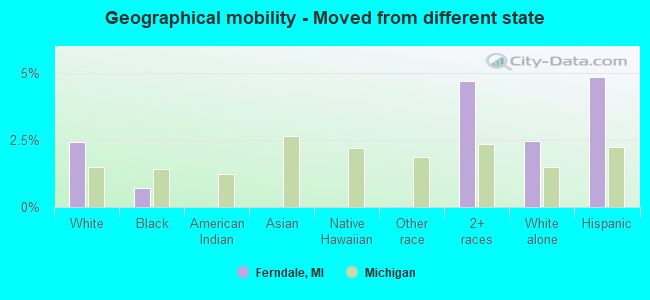
Geographical mobility - Moved from different state (%)
Geographical mobility - Moved from different state (%) - White
Geographical mobility - Moved from different state (%) - Black or African American
Geographical mobility - Moved from different state (%) - Asian
Geographical mobility - Moved from different state (%) - Hispanic or Latino
Geographical mobility - Moved from different state (%) - American Indian and Alaska Native
Geographical mobility - Moved from different state (%) - Multirace
Geographical mobility - Moved from different state (%) - Other Race
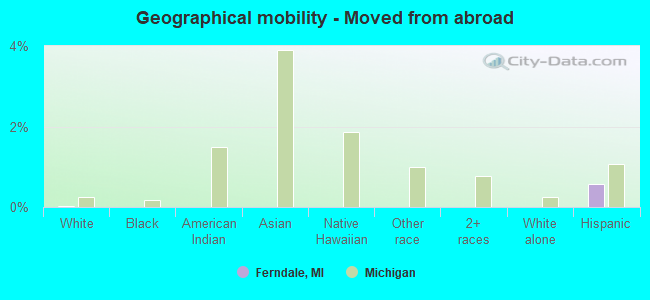
Geographical mobility - Moved from abroad (%)
Geographical mobility - Moved from abroad (%) - White
Geographical mobility - Moved from abroad (%) - Black or African American
Geographical mobility - Moved from abroad (%) - Asian
Geographical mobility - Moved from abroad (%) - Hispanic or Latino
Geographical mobility - Moved from abroad (%) - American Indian and Alaska Native
Geographical mobility - Moved from abroad (%) - Multirace
Geographical mobility - Moved from abroad (%) - Other Race
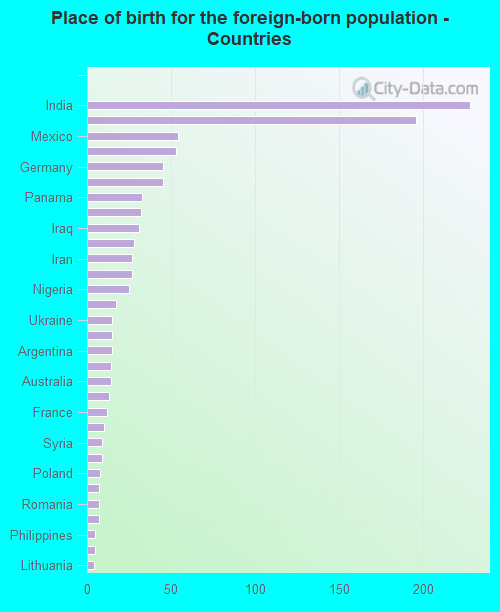
Place of birth for the foreign-born population - Ireland (%)
Place of birth for the foreign-born population - Denmark (%)
Place of birth for the foreign-born population - Norway (%)
Place of birth for the foreign-born population - Sweden (%)
Place of birth for the foreign-born population - United Kingdom (%)
Place of birth for the foreign-born population - England (%)
Place of birth for the foreign-born population - Scotland (%)
Place of birth for the foreign-born population - Other Northern Europe (%)
Place of birth for the foreign-born population - Austria (%)
Place of birth for the foreign-born population - Belgium (%)
Place of birth for the foreign-born population - France (%)
Place of birth for the foreign-born population - Germany (%)
Place of birth for the foreign-born population - Netherlands (%)
Place of birth for the foreign-born population - Switzerland (%)
Place of birth for the foreign-born population - Other Western Europe (%)
Place of birth for the foreign-born population - Greece (%)
Place of birth for the foreign-born population - Italy (%)
Place of birth for the foreign-born population - Portugal (%)
Place of birth for the foreign-born population - Spain (%)
Place of birth for the foreign-born population - Other Southern Europe (%)
Place of birth for the foreign-born population - Albania (%)
Place of birth for the foreign-born population - Belarus (%)
Place of birth for the foreign-born population - Bosnia and Herzegovina (%)
Place of birth for the foreign-born population - Bulgaria (%)
Place of birth for the foreign-born population - Croatia (%)
Place of birth for the foreign-born population - Czechoslovakia (%)
Place of birth for the foreign-born population - Hungary (%)
Place of birth for the foreign-born population - Latvia (%)
Place of birth for the foreign-born population - Lithuania (%)
Place of birth for the foreign-born population - North Macedonia (Macedonia) (%)
Place of birth for the foreign-born population - Moldova (%)
Place of birth for the foreign-born population - Poland (%)
Place of birth for the foreign-born population - Romania (%)
Place of birth for the foreign-born population - Russia (%)
Place of birth for the foreign-born population - Serbia (%)
Place of birth for the foreign-born population - Ukraine (%)
Place of birth for the foreign-born population - Other Eastern Europe (%)
Place of birth for the foreign-born population - China (%)
Place of birth for the foreign-born population - Hong Kong (%)
Place of birth for the foreign-born population - Taiwan (%)
Place of birth for the foreign-born population - Japan (%)
Place of birth for the foreign-born population - Korea (%)
Place of birth for the foreign-born population - Other Eastern Asia (%)
Place of birth for the foreign-born population - Afghanistan (%)
Place of birth for the foreign-born population - Bangladesh (%)
Place of birth for the foreign-born population - India (%)
Place of birth for the foreign-born population - Iran (%)
Place of birth for the foreign-born population - Kazakhstan (%)
Place of birth for the foreign-born population - Nepal (%)
Place of birth for the foreign-born population - Pakistan (%)
Place of birth for the foreign-born population - Sri Lanka (%)
Place of birth for the foreign-born population - Uzbekistan (%)
Place of birth for the foreign-born population - Other South Central Asia (%)
Place of birth for the foreign-born population - Burma (%)
Place of birth for the foreign-born population - Cambodia (%)
Place of birth for the foreign-born population - Indonesia (%)
Place of birth for the foreign-born population - Laos (%)
Place of birth for the foreign-born population - Malaysia (%)
Place of birth for the foreign-born population - Philippines (%)
Place of birth for the foreign-born population - Singapore (%)
Place of birth for the foreign-born population - Thailand (%)
Place of birth for the foreign-born population - Vietnam (%)
Place of birth for the foreign-born population - Other South Eastern Asia (%)
Place of birth for the foreign-born population - Armenia (%)
Place of birth for the foreign-born population - Iraq (%)
Place of birth for the foreign-born population - Israel (%)
Place of birth for the foreign-born population - Jordan (%)
Place of birth for the foreign-born population - Kuwait (%)
Place of birth for the foreign-born population - Lebanon (%)
Place of birth for the foreign-born population - Saudi Arabia (%)
Place of birth for the foreign-born population - Syria (%)
Place of birth for the foreign-born population - Turkey (%)
Place of birth for the foreign-born population - Yemen (%)
Place of birth for the foreign-born population - Other Western Asia (%)
Place of birth for the foreign-born population - Eritrea (%)
Place of birth for the foreign-born population - Ethiopia (%)
Place of birth for the foreign-born population - Kenya (%)
Place of birth for the foreign-born population - Somalia (%)
Place of birth for the foreign-born population - Uganda (%)
Place of birth for the foreign-born population - Zimbabwe (%)
Place of birth for the foreign-born population - Other Eastern Africa (%)
Place of birth for the foreign-born population - Cameroon (%)
Place of birth for the foreign-born population - Congo (%)
Place of birth for the foreign-born population - Democratic Republic of Congo (Zaire) (%)
Place of birth for the foreign-born population - Other Middle Africa (%)
Place of birth for the foreign-born population - Egypt (%)
Place of birth for the foreign-born population - Morocco (%)
Place of birth for the foreign-born population - Sudan (%)
Place of birth for the foreign-born population - Other Northern Africa (%)
Place of birth for the foreign-born population - South Africa (%)
Place of birth for the foreign-born population - Other Southern Africa (%)
Place of birth for the foreign-born population - Cabo Verde (%)
Place of birth for the foreign-born population - Ghana (%)
Place of birth for the foreign-born population - Liberia (%)
Place of birth for the foreign-born population - Nigeria (%)
Place of birth for the foreign-born population - Senegal (%)
Place of birth for the foreign-born population - Sierra Leone (%)
Place of birth for the foreign-born population - Other Western Africa (%)
Place of birth for the foreign-born population - Australia (%)
Place of birth for the foreign-born population - New Zealand (%)
Place of birth for the foreign-born population - Fiji (%)
Place of birth for the foreign-born population - Micronesia (%)
Place of birth for the foreign-born population - Bahamas (%)
Place of birth for the foreign-born population - Barbados (%)
Place of birth for the foreign-born population - Cuba (%)
Place of birth for the foreign-born population - Dominica (%)
Place of birth for the foreign-born population - Dominican Republic (%)
Place of birth for the foreign-born population - Grenada (%)
Place of birth for the foreign-born population - Haiti (%)
Place of birth for the foreign-born population - Jamaica (%)
Place of birth for the foreign-born population - St. Vincent and the Grenadines (%)
Place of birth for the foreign-born population - Trinidad and Tobago (%)
Place of birth for the foreign-born population - West Indies (%)
Place of birth for the foreign-born population - Other Caribbean (%)
Place of birth for the foreign-born population - Belize (%)
Place of birth for the foreign-born population - Costa Rica (%)
Place of birth for the foreign-born population - El Salvador (%)
Place of birth for the foreign-born population - Guatemala (%)
Place of birth for the foreign-born population - Honduras (%)
Place of birth for the foreign-born population - Mexico (%)
Place of birth for the foreign-born population - Nicaragua (%)
Place of birth for the foreign-born population - Panama (%)
Place of birth for the foreign-born population - Other Central America (%)
Place of birth for the foreign-born population - Argentina (%)
Place of birth for the foreign-born population - Bolivia (%)
Place of birth for the foreign-born population - Brazil (%)
Place of birth for the foreign-born population - Chile (%)
Place of birth for the foreign-born population - Colombia (%)
Place of birth for the foreign-born population - Ecuador (%)
Place of birth for the foreign-born population - Guyana (%)
Place of birth for the foreign-born population - Peru (%)
Place of birth for the foreign-born population - Uruguay (%)
Place of birth for the foreign-born population - Venezuela (%)
Place of birth for the foreign-born population - Other South America (%)
Place of birth for the foreign-born population - Canada (%)
Place of birth for the foreign-born population - Other Northern America (%)
Place of birth for the foreign-born population - Other (%)
Latest news about races in Ferndale, MI collected exclusively by city-data.com from local newspapers, TV, and radio stations
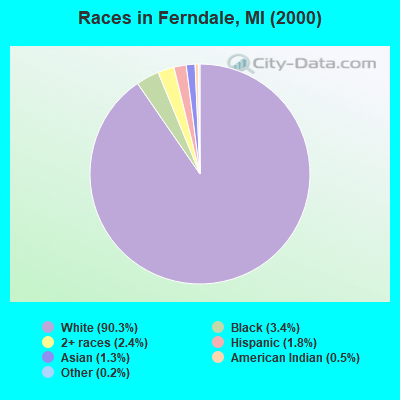
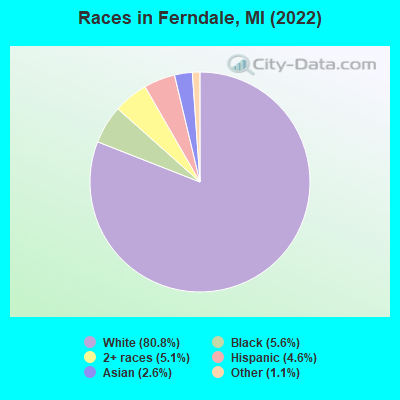
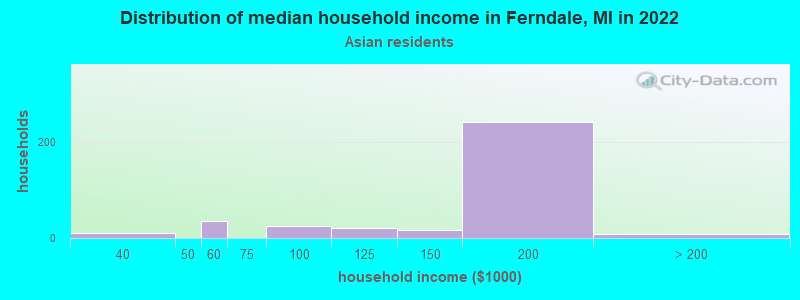
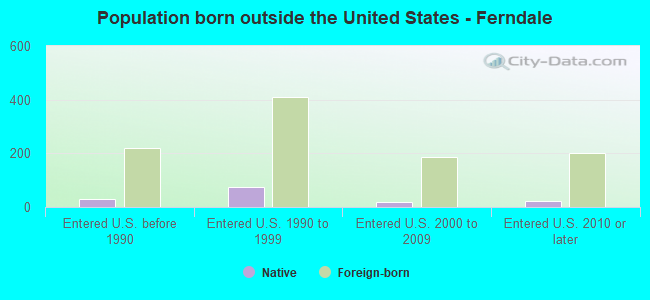
According to 2022 data, the most numerous races in Ferndale, MI are White alone (15,533 residents), Black alone (1,082 residents), and Hispanic (886 residents). 94.4% of Ferndale residents speak English at home. 5.3% of Ferndale, MI residents are foreign-born (2.2% born in Asia, 1.0% born in North America, 1.0% born in Latin America, 0.9% born in Europe), which is 13.4% less than the foreign-born rate of 6.0% across the entire state of Michigan.
Race distribution in Ferndale
2000 2022
7,806,691 78.6% White alone 1,402,047 14.1% Black alone 323,877 3.3% Hispanic 175,311 1.8% Asian alone 163,487 1.6% Two or more races 53,421 0.5% American Indian alone 11,465 0.1% Other race alone 2,145 0.02% Native Hawaiian and Other
7,289,051 72.6% White alone 1,310,464 13.1% Black alone 572,405 5.7% Hispanic 450,031 4.5% Two or more races 335,732 3.3% Asian alone 45,217 0.5% Other race alone 29,011 0.3% American Indian alone 2,207 0.02% Native Hawaiian and Other
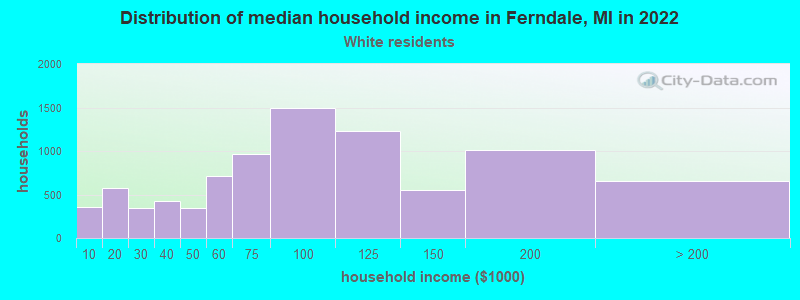
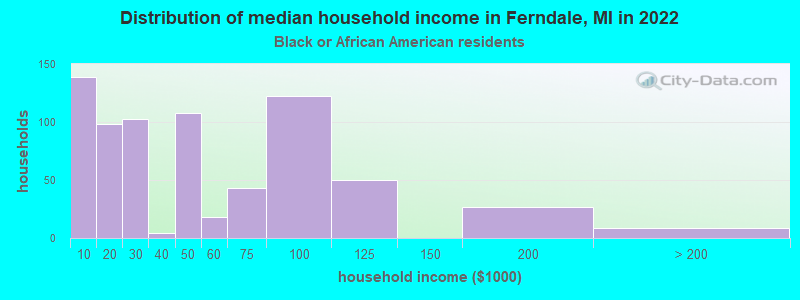
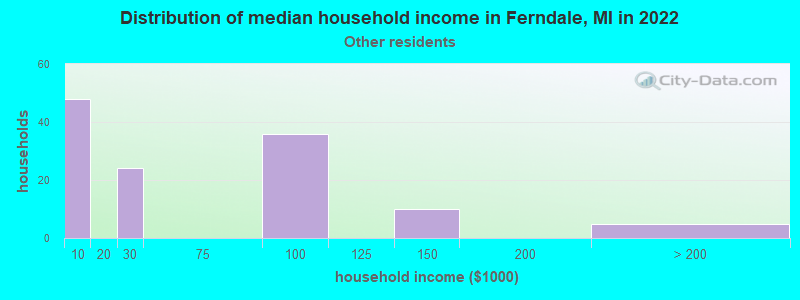
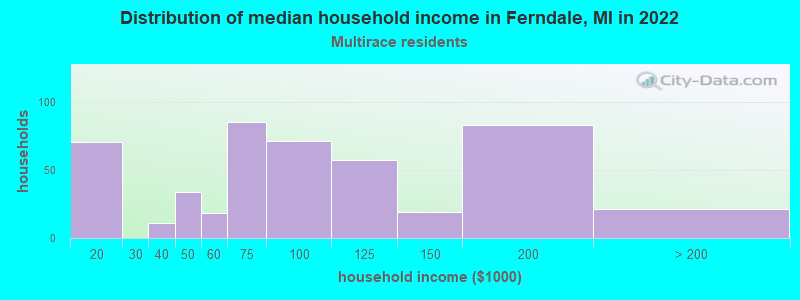
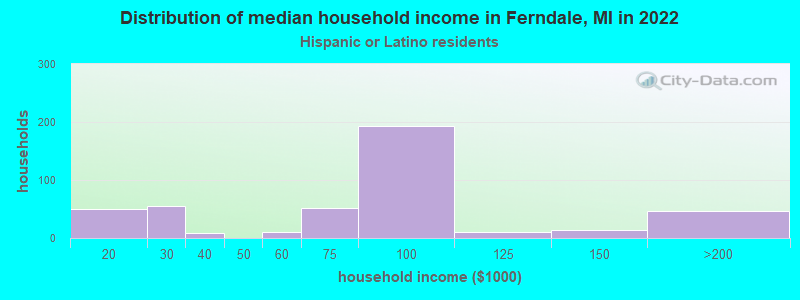
Income and house value in Ferndale Median household income in 2022 $84,945 White non-Hispanic householders$42,657 Black householders$176,795 Asian householders$84,248 Two or more races householders$79,709 Hispanic or Latino race householdersMedian 2022 house value $237,694 White Non-Hispanic householders$229,114 Black or African American householders$200,127 American Indian or Alaska Native householders $262,507 Asian householders$220,302 Native Hawaiian and other Pacific Islander householders$285,001 Some other race householders$268,073 Two or more races householders$266,218 Hispanic or Latino householders
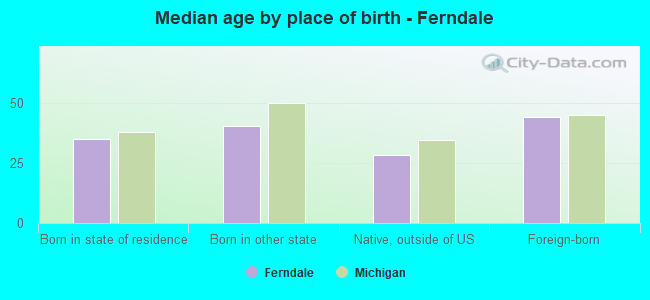
Median age by race in Ferndale
36.4 Median age for White residents37.7 35.5 38.5 Median age for Black or African American residents33.0 46.1 36.6 Median age for American Indian / Alaska Native residents-505,050,504.5 -728,395,061.0 44.8 Median age for Asian residents45.6 37.9 -670,531,400.3 Median age for Native Hawaiian / Pacific Islander residents-674,772,035.8 -699,588,476.7 18.3 Median age for Other race residents0.0 19.9 29.3 Median age for Two or more races residents35.0 27.6 36.1 Median age for White alone residents37.5 35.3 32.0 Median age for Hispanic or Latino residents39.2 29.3
Owner/renter occupied households by race in Ferndale
House owners and renters - White residents 5,975 69.7% Owner occupied2,593 30.3% Renter occupiedHouse owners and renters - Black or African American residents 201 29.3% Owner occupied487 70.7% Renter occupiedHouse owners and renters - American Indian / Alaska Native residents 9 100.0% Renter occupiedHouse owners and renters - Asian residents 309 84.2% Owner occupied58 15.8% Renter occupiedHouse owners and renters - Native Hawaiian / Pacific Islander residents 23 100.0% Renter occupiedHouse owners and renters - Other race residents 51 40.7% Owner occupied75 59.3% Renter occupiedHouse owners and renters - Two or more races residents 336 77.8% Owner occupied96 22.2% Renter occupiedHouse owners and renters - White alone residents 5,974 70.3% Owner occupied2,519 29.7% Renter occupiedHouse owners and renters - Hispanic or Latino residents 117 30.4% Owner occupied267 69.6% Renter occupied
Language usage in Ferndale
English speakers - Total 94.4% of residents of Ferndale speak English at home.
2.8% of residents speak Spanish at home 465 90.8% Speak English very well47 9.2% Speak English less than very well2.8% of residents speak other language at home 459 88.6% Speak English very well59 11.4% Speak English less than very well
English speakers - Born in the United States 95.4% of residents of Ferndale speak English at home.
3.4% of residents speak Spanish at home 106 100.0% Speak English very well1.5% of residents speak other language at home 46 100.0% Speak English very well
English speakers - Native, born elsewhere 91.2% of residents of Ferndale speak English at home.
16.9% of residents speak Spanish at home 23 100.0% Speak English very well
English speakers - Foreign-born 55.7% of residents of Ferndale speak English at home.
23.2% of residents speak Spanish at home 210 88.2% Speak English very well28 11.8% Speak English less than very well25.3% of residents speak other language at home 217 83.8% Speak English very well42 16.2% Speak English less than very well
White (Caucasian) - Speak only English Native:
98.5% (14,291)Foreign-born:
54.6% (249)
White (Caucasian) - Speak another language Native:
1.6% (238)Foreign-born:
47.9% (219)
Black or African American - Speak only English Native:
98.5% (1,030)Foreign-born:
19.5% (7)
Black or African American - Speak another language Native:
1.5% (16)Foreign-born:
84.8% (29)
Asian - Speak only English Native:
75.2% (123)Foreign-born:
91.2% (304)
Asian - Speak another language Native:
26.1% (43)Foreign-born:
12.2% (41)
Other race - Speak another language Native:
72.7% (202)Foreign-born:
100.0% (102)
Two or more races - Speak only English Native:
92.1% (1,186)Foreign-born:
34.3% (35)
Two or more races - Speak another language Native:
7.8% (101)Foreign-born:
62.4% (64)
White alone - Speak only English Native:
98.4% (14,200)Foreign-born:
61.1% (252)
White alone - Speak another language Native:
1.5% (220)Foreign-born:
40.8% (169)
Hispanic or Latino - Speak only English Native:
62.3% (392)Foreign-born:
4.0% (9)
Hispanic or Latino - Speak another language Native:
37.7% (237)Foreign-born:
96.8% (225)
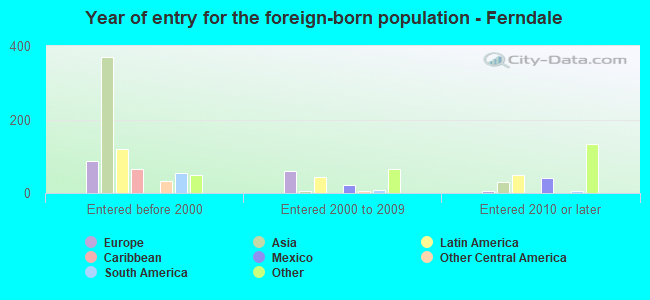
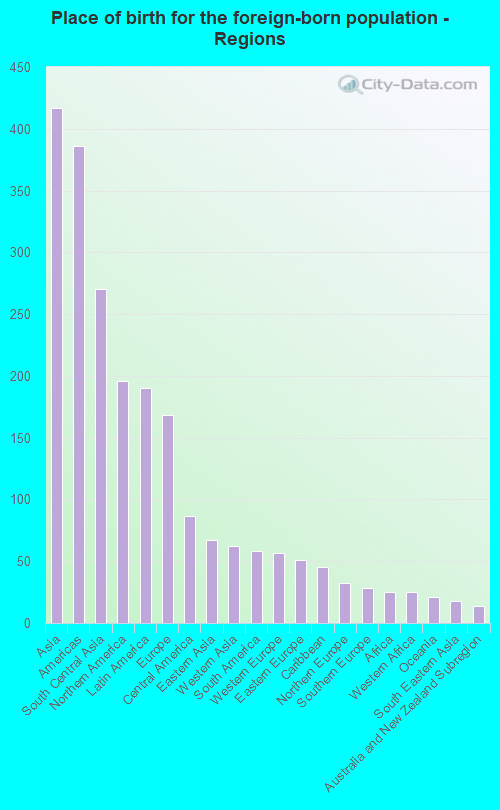
Foreign-born residents in Ferndale 1,017 residents are foreign born (2.2% Asia , 1.0% North America , 1.0% Latin America , 0.9% Europe ).
This city:
5.3%Michigan:
6.9%
Marital status for residents in Ferndale Marital status - White (Caucasian) population 15 years and over
Males 53.1% Never married37.5% Now married1.0% Separated1.1% Widowed7.3% DivorcedFemales 50.8% Never married33.0% Now married0.0% Separated5.1% Widowed11.1% DivorcedWomen who gave birth in the past 12 months Now married:
100.0% (259)Unmarried:
0.0% (0)
Women who did not give birth in the past 12 months Now married:
26.6% (1,308)Unmarried:
73.4% (3,603)
Marital status - Black or African American population 15 years and over
Males 70.0% Never married13.7% Now married0.0% Separated4.0% Widowed12.4% DivorcedFemales 52.2% Never married19.4% Now married7.5% Separated8.7% Widowed12.3% DivorcedWomen who did not give birth in the past 12 months Now married:
17.1% (31)Unmarried:
82.9% (152)
Marital status - American Indian / Alaska Native population 15 years and over
Males 50.0% Never married0.0% Now married0.0% Separated50.0% Widowed0.0% DivorcedFemales 100.0% Never married0.0% Now married0.0% Separated0.0% Widowed0.0% DivorcedWomen who did not give birth in the past 12 months Now married:
0.0% (0)Unmarried:
100.0% (8)
Marital status - Asian population 15 years and over
Males 27.2% Never married72.8% Now married0.0% Separated0.0% Widowed0.0% DivorcedFemales 40.7% Never married46.4% Now married0.0% Separated0.0% Widowed12.9% DivorcedWomen who gave birth in the past 12 months Now married:
100.0% (14)Unmarried:
0.0% (0)
Women who did not give birth in the past 12 months Now married:
31.6% (31)Unmarried:
68.4% (68)
Marital status - Other race population 15 years and over
Males 93.7% Never married6.3% Now married0.0% Separated0.0% Widowed0.0% DivorcedFemales 54.0% Never married10.6% Now married14.8% Separated0.0% Widowed20.6% DivorcedWomen who did not give birth in the past 12 months Now married:
27.1% (56)Unmarried:
72.9% (149)
Marital status - Two or more races population 15 years and over
Males 41.3% Never married49.9% Now married1.2% Separated2.3% Widowed5.3% DivorcedFemales 55.9% Never married27.2% Now married1.9% Separated1.6% Widowed13.4% DivorcedWomen who did not give birth in the past 12 months Now married:
22.2% (86)Unmarried:
77.8% (302)
Marital status - White alone, not Hispanic / Latino population 15 years and over
Males 53.2% Never married37.1% Now married1.1% Separated1.2% Widowed7.5% DivorcedFemales 50.5% Never married33.0% Now married0.0% Separated5.2% Widowed11.3% DivorcedWomen who gave birth in the past 12 months Now married:
100.0% (261)Unmarried:
0.0% (0)
Women who did not give birth in the past 12 months Now married:
26.6% (1,297)Unmarried:
73.4% (3,575)
Marital status - Hispanic or Latino population 15 years and over
Males 53.5% Never married46.5% Now married0.0% Separated0.0% Widowed0.0% DivorcedFemales 65.9% Never married19.4% Now married7.0% Separated1.0% Widowed6.7% DivorcedWomen who gave birth in the past 12 months Now married:
100.0% (3)Unmarried:
0.0% (0)
Women who did not give birth in the past 12 months Now married:
24.4% (91)Unmarried:
75.6% (282)
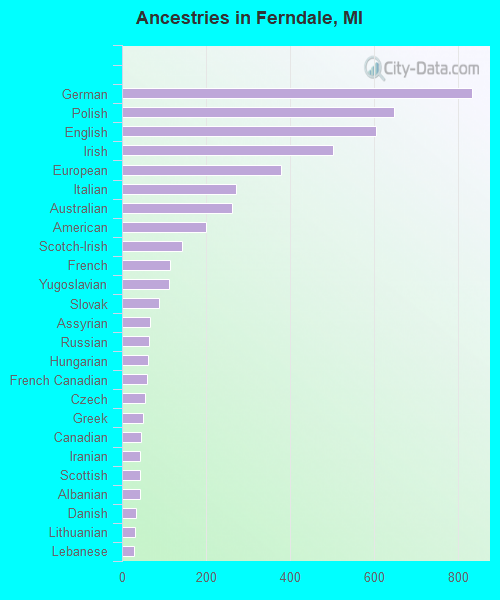
Ancestries in Ferndale
833 12.1% German649 9.4% Polish605 8.8% English504 7.3% Irish379 5.5% European271 3.9% Italian261 3.8% Australian200 2.9% American142 2.1% Scotch-Irish115 1.7% French111 1.6% Yugoslavian87 1.3% Slovak66 1.0% Assyrian65 0.9% Russian61 0.9% Hungarian59 0.9% French Canadian56 0.8% Czech50 0.7% Greek46 0.7% Canadian44 0.6% Iranian44 0.6% Scottish42 0.6% Albanian33 0.5% Danish31 0.4% Lithuanian29 0.4% Lebanese29 0.4% Dutch27 0.4% Ukrainian24 0.3% Finnish21 0.3% Belizean19 0.3% Welsh18 0.3% British17 0.2% Northern European17 0.2% Swedish17 0.2% Nigerian13 0.2% Scandinavian10 0.1% Syrian9 0.1% Portuguese8 0.1% Romanian7 0.1% Belgian4 0.06% Macedonian4 0.06% Maltese3 0.04% Armenian3 0.04% Eastern European
Children Nativity (place of birth) in Ferndale
Children under 6 years - Living with two parents Both parents native 635 100.0% NativeOne native, one foreign-born parent 190 100.0% NativeChildren under 6 years - Living with one parent Native parent 167 100.0% NativeForeign-born parent 27 100.0% Native
Children 6 to 17 years - Living with two parents Both parents native 487 100.0% NativeOne native, one foreign-born parent 16 100.0% NativeChildren 6 to 17 years - Living with one parent Native parent 431 100.0% Native
Grandparents responsible for own grandchildren in Ferndale
Grandparents (30 to 59 years) White / Caucasian 4 100.0% Not responsible for grandchildrenBlack or African American 8 100.0% Not responsible for grandchildrenWhite alone, not Hispanic / Latino 4 100.0% Not responsible for grandchildrenGrandparents (60 years and over) White / Caucasian 28 23.4% Responsible for grandchildren91 76.6% Not responsible for grandchildrenBlack or African American 7 100.0% Not responsible for grandchildrenWhite alone, not Hispanic / Latino 29 24.0% Responsible for grandchildren92 76.0% Not responsible for grandchildren