Races in Fircrest, Washington (WA) Detailed Stats
Ancestries, Foreign-born residents, place of birth
Settings
X


Recent posts about races in Fircrest, Washington on our local forum with over 2,400,000 registered users:
 | Love West Seattle, but it's changing and becoming too expensive. Where to go? (33 replies) |
| Seattle job (legal) market + tips on moving (22 replies) |
| Daily Life in University Place/Tacoma? (5 replies) |
| Fircrest neighborhood? (6 replies) |
| Relocating from Miami FL to Tacoma WA HELP! (14 replies) |
| Young Family looking for safe, friendly area in Tacoma (5 replies) |
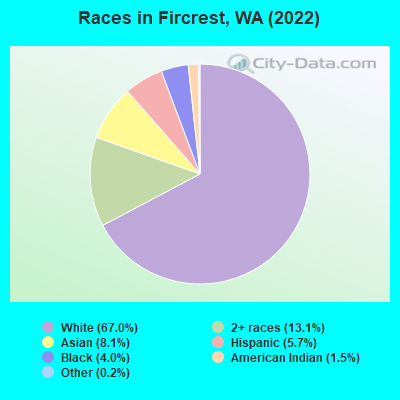
According to 2022 data, the most numerous races in Fircrest, WA are White alone (4,796 residents), Hispanic (406 residents), and Asian alone (582 residents). 84.7% of Fircrest residents speak English at home. 11.4% of Fircrest, WA residents are foreign-born (7.2% born in Asia, 2.2% born in Europe), which is 32.0% less than the foreign-born rate of 15.0% across the entire state of Washington.
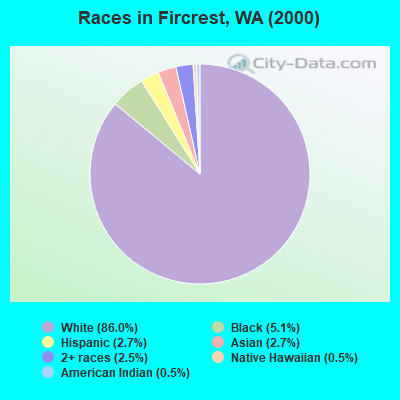
Race distribution in Fircrest
2000
2022

- 5,04886.0%White alone
- 3005.1%Black alone
- 1582.7%Hispanic
- 1562.7%Asian alone
- 1482.5%Two or more races
- 270.5%American Indian alone
- 300.5%Native Hawaiian and Other
Pacific Islander alone - 10.02%Other race alone
-
- 4,79667.0%White alone
- 93913.1%Two or more races
- 5828.1%Asian alone
- 4065.7%Hispanic
- 2834.0%Black alone
- 1111.5%American Indian alone
- 170.2%Other race alone
2000
2022
-
- 4,652,49078.9%White alone
- 441,5097.5%Hispanic
- 319,4015.4%Asian alone
- 184,6313.1%Black alone
- 175,9263.0%Two or more races
- 85,3961.4%American Indian alone
- 22,7790.4%Native Hawaiian and Other
Pacific Islander alone - 11,9890.2%Other race alone

-
- 4,941,45663.5%White alone
- 1,093,31314.0%Hispanic
- 755,8329.7%Asian alone
- 523,4486.7%Two or more races
- 299,5373.8%Black alone
- 69,0240.9%American Indian alone
- 52,2310.7%Native Hawaiian and Other
Pacific Islander alone - 50,9450.7%Other race alone

Income and house value in Fircrest
- Median household income in 2022
- $99,642White non-Hispanic householders
- $130,194Asian householders
- $190,022Two or more races householders
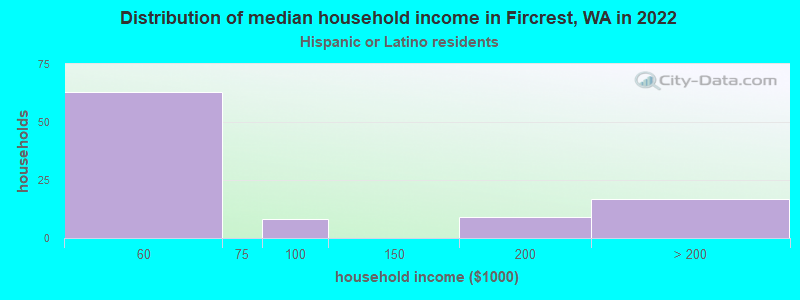
- $64,376Hispanic or Latino race householders
- Median 2022 house value
- $576,858White Non-Hispanic householders
- $489,014Black or African American householders
- $519,955Asian householders
- $577,925Two or more races householders
- $882,359Hispanic or Latino householders
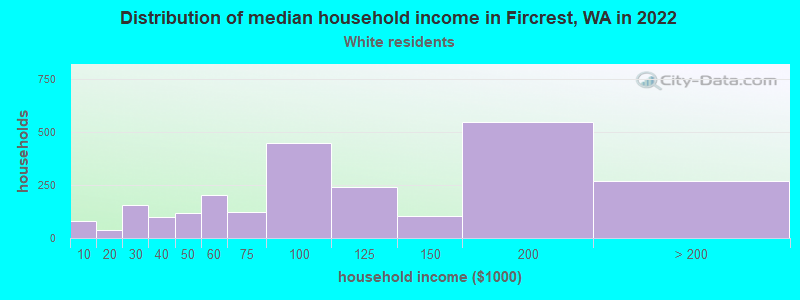
Household income for White non-Hispanic householders
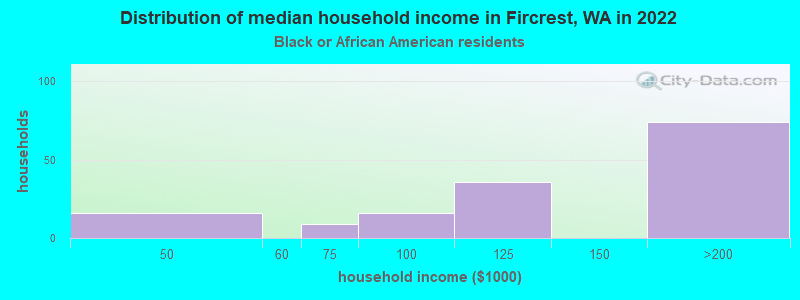
Household income for Black householders
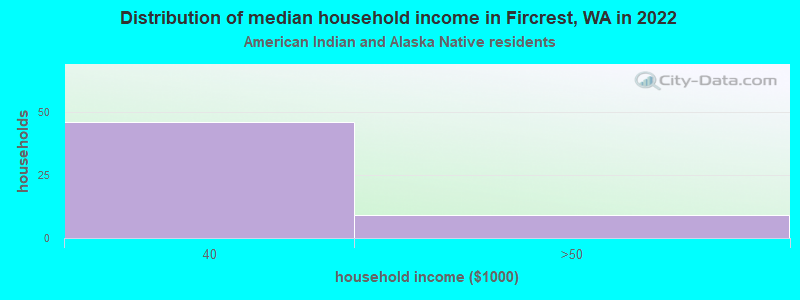
Household income for American Indian and Alaska Native householders
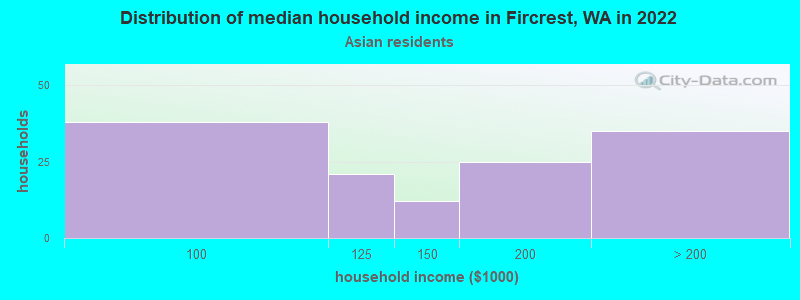
Household income for Asian householders
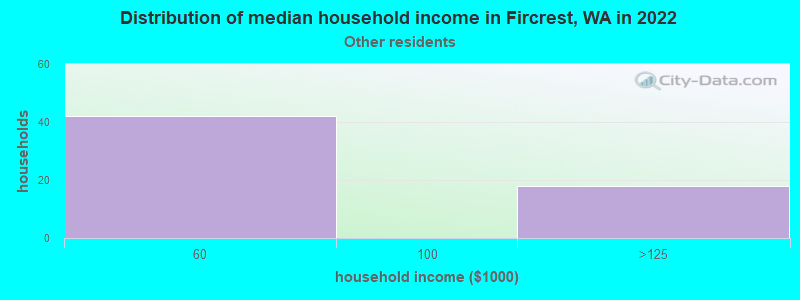
Household income for Some other race householders
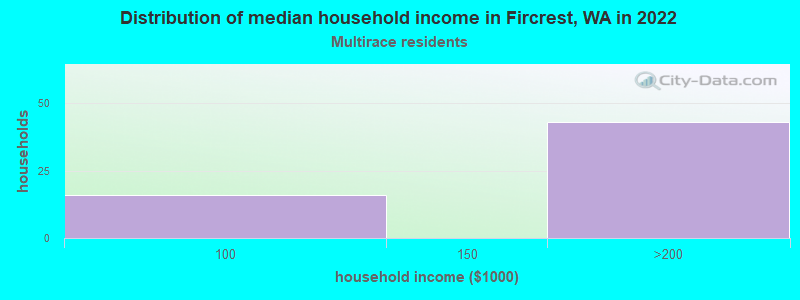
Household income for Two or more races householders
Household income for Hispanic or Latino race householders
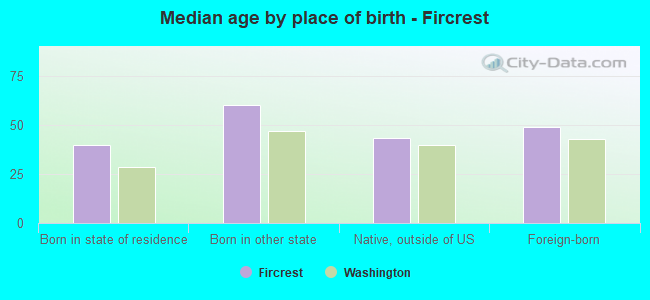
Median age by race in Fircrest
- 50.1Median age for White residents
- 50.6Males
- 49.0Females
- 61.6Median age for Black or African American residents
- 52.5Males
- 70.1Females
- 33.4Median age for American Indian / Alaska Native residents
- -622,057,000.6Males
- 32.3Females
- 46.2Median age for Asian residents
- 43.6Males
- 45.6Females
- -683,229,813.0Median age for Native Hawaiian / Pacific Islander residents
- -736,612,021.1Males
- -634,538,152.0Females
- 33.2Median age for Other race residents
- 33.2Males
- -734,982,331.4Females
- 18.8Median age for Two or more races residents
- 16.9Males
- 24.1Females
- 50.7Median age for White alone residents
- 50.8Males
- 50.6Females
- 13.4Median age for Hispanic or Latino residents
- 13.2Males
- 20.7Females
Owner/renter occupied households by race in Fircrest
- House owners and renters - White residents
- 1,82875.5%Owner occupied
- 59224.5%Renter occupied
- House owners and renters - Black or African American residents
- 8452.0%Owner occupied
- 7848.0%Renter occupied
- House owners and renters - American Indian / Alaska Native residents
- 3371.3%Owner occupied
- 1328.7%Renter occupied
- House owners and renters - Asian residents
- 9880.4%Owner occupied
- 2419.6%Renter occupied
- House owners and renters - Native Hawaiian / Pacific Islander residents
- 12100.0%Owner occupied
- House owners and renters - Other race residents
- 1636.1%Owner occupied
- 2963.9%Renter occupied
- House owners and renters - Two or more races residents
- 1930.0%Owner occupied
- 4470.0%Renter occupied
- House owners and renters - White alone residents
- 1,83175.7%Owner occupied
- 58924.3%Renter occupied
- House owners and renters - Hispanic or Latino residents
- 3443.0%Owner occupied
- 4557.0%Renter occupied
Language usage in Fircrest
- English speakers - Total
- 84.7% of residents of Fircrest speak English at home.
- 0.7% of residents speak Spanish at home
- 3983.0%Speak English very well
- 817.0%Speak English less than very well
- 14.9% of residents speak other language at home
- 83281.1%Speak English very well
- 19418.9%Speak English less than very well
- English speakers - Born in the United States
- 91.4% of residents of Fircrest speak English at home.
- 1.8% of residents speak Spanish at home
- 30100.0%Speak English very well
- 6.4% of residents speak other language at home
- 107100.0%Speak English very well
- English speakers - Native, born elsewhere
- 97.9% of residents of Fircrest speak English at home.
- 4.2% of residents speak other language at home
- 8100.0%Speak English very well
- English speakers - Foreign-born
- 21.7% of residents of Fircrest speak English at home.
- 1.1% of residents speak Spanish at home
- 9100.0%Speak English less than very well
- 79.1% of residents speak other language at home
- 51978.2%Speak English very well
- 14521.8%Speak English less than very well
White (Caucasian) - Speak only English
| Native: | 96.2% (4,266) |
| Foreign-born: | 40.3% (124) |
White (Caucasian) - Speak another language
| Native: | 3.4% (151) |
| Foreign-born: | 57.6% (177) |
Asian - Speak only English
| Native: | 18.0% (24) |
| Foreign-born: | 10.6% (48) |
Asian - Speak another language
| Native: | 75.6% (101) |
| Foreign-born: | 86.6% (397) |
Two or more races - Speak another language
| Native: | 5.0% (47) |
| Foreign-born: | 100.0% (53) |
White alone - Speak only English
| Native: | 95.5% (4,108) |
| Foreign-born: | 37.7% (131) |
White alone - Speak another language
| Native: | 4.0% (174) |
| Foreign-born: | 59.8% (207) |
Hispanic or Latino - Speak another language
| Native: | 12.0% (40) |
| Foreign-born: | 100.0% (10) |
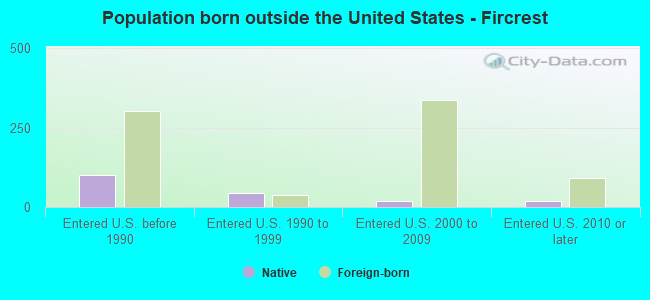
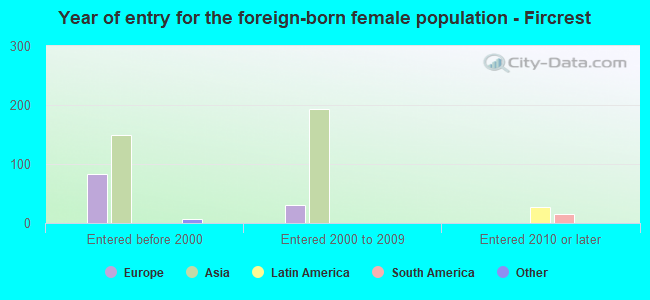
Foreign-born residents in Fircrest
814 residents are foreign born (7.2% Asia, 2.2% Europe).
| This city: | 11.4% |
| Washington: | 14.9% |

Marital status for residents in Fircrest
Marital status - White (Caucasian) population 15 years and over
- Males
- 28.4%Never married
- 57.0%Now married
- 0.8%Separated
- 0.8%Widowed
- 13.1%Divorced
- Females
- 30.6%Never married
- 40.5%Now married
- 2.9%Separated
- 6.6%Widowed
- 19.3%Divorced
Women who gave birth in the past 12 months
| Now married: | 100.0% (50) |
| Unmarried: | 0.0% (0) |
Women who did not give birth in the past 12 months
| Now married: | 28.7% (323) |
| Unmarried: | 71.3% (803) |
Marital status - Black or African American population 15 years and over
- Males
- 31.4%Never married
- 59.8%Now married
- 0.0%Separated
- 0.0%Widowed
- 8.8%Divorced
- Females
- 19.5%Never married
- 16.1%Now married
- 0.0%Separated
- 47.1%Widowed
- 17.2%Divorced
Women who did not give birth in the past 12 months
| Now married: | 45.2% (14) |
| Unmarried: | 54.8% (17) |
Marital status - Asian population 15 years and over
- Males
- 36.3%Never married
- 56.5%Now married
- 0.0%Separated
- 0.0%Widowed
- 7.3%Divorced
- Females
- 55.6%Never married
- 37.6%Now married
- 0.0%Separated
- 3.4%Widowed
- 3.4%Divorced
Women who gave birth in the past 12 months
| Now married: | 100.0% (11) |
| Unmarried: | 0.0% (0) |
Women who did not give birth in the past 12 months
| Now married: | 28.3% (81) |
| Unmarried: | 71.7% (206) |
Marital status - Other race population 15 years and over
- Males
- 31.0%Never married
- 69.0%Now married
- 0.0%Separated
- 0.0%Widowed
- 0.0%Divorced
- Females
- 0.0%Never married
- 100.0%Now married
- 0.0%Separated
- 0.0%Widowed
- 0.0%Divorced
Women who did not give birth in the past 12 months
| Now married: | 100.0% (33) |
| Unmarried: | 0.0% (0) |
Marital status - Two or more races population 15 years and over
- Males
- 72.0%Never married
- 28.0%Now married
- 0.0%Separated
- 0.0%Widowed
- 0.0%Divorced
- Females
- 79.0%Never married
- 16.6%Now married
- 0.0%Separated
- 0.0%Widowed
- 4.5%Divorced
Women who did not give birth in the past 12 months
| Now married: | 0.0% (0) |
| Unmarried: | 100.0% (326) |
Marital status - White alone, not Hispanic / Latino population 15 years and over
- Males
- 28.8%Never married
- 56.8%Now married
- 0.8%Separated
- 0.8%Widowed
- 12.8%Divorced
- Females
- 30.6%Never married
- 40.1%Now married
- 3.0%Separated
- 6.7%Widowed
- 19.6%Divorced
Women who gave birth in the past 12 months
| Now married: | 100.0% (51) |
| Unmarried: | 0.0% (0) |
Women who did not give birth in the past 12 months
| Now married: | 27.5% (309) |
| Unmarried: | 72.5% (813) |
Marital status - Hispanic or Latino population 15 years and over
- Males
- 20.2%Never married
- 67.3%Now married
- 0.0%Separated
- 0.0%Widowed
- 12.5%Divorced
- Females
- 16.7%Never married
- 83.3%Now married
- 0.0%Separated
- 0.0%Widowed
- 0.0%Divorced
Women who did not give birth in the past 12 months
| Now married: | 83.3% (70) |
| Unmarried: | 16.7% (14) |
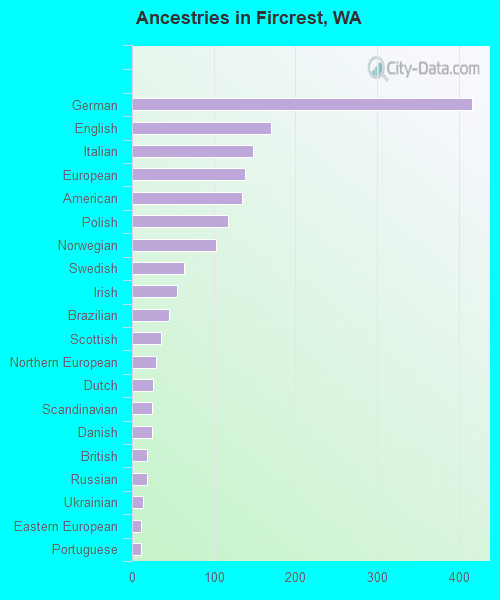
Ancestries in Fircrest

- 41615.1%German
- 1706.2%English
- 1485.4%Italian
- 1385.0%European
- 1344.8%American
- 1184.3%Polish
- 1033.7%Norwegian
- 642.3%Swedish
- 552.0%Irish
- 451.6%Brazilian
- 361.3%Scottish
- 291.0%Northern European
- 260.9%Dutch
- 250.9%Scandinavian
- 240.9%Danish
- 180.7%British
- 180.7%Russian
- 140.5%Ukrainian
- 110.4%Eastern European
- 110.4%Portuguese
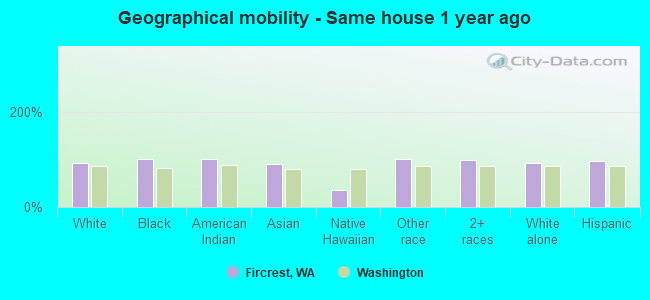
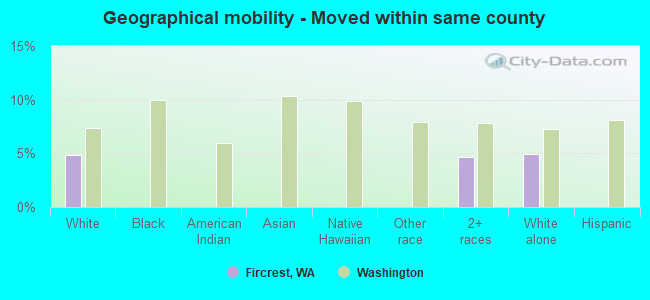
Geographical mobility in Fircrest

- Same house 1 year ago
- 4,52993.0%White (Caucasian)
- 298100.0%Black or African American
- 122100.0%American Indian / Alaska Native
- 52590.4%Asian
- 1236.5%Native Hawaiian / Pacific Islander
- 139100.0%Other race
- 1,05197.8%Two or more races
- 4,42492.7%White alone, not Hispanic / Latino
- 39596.6%Hispanic or Latino
-
- Moved within same county
- 2384.9%White / Caucasian
- 504.7%Two or more races
- 2375.0%White alone, not Hispanic / Latino
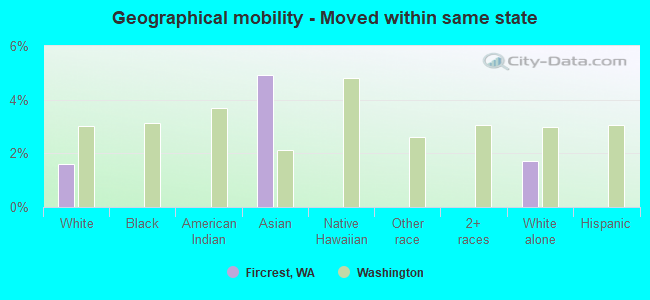
-
- Moved within same state
- 781.6%White / Caucasian
- 294.9%Asian
- 811.7%White alone, not Hispanic / Latino
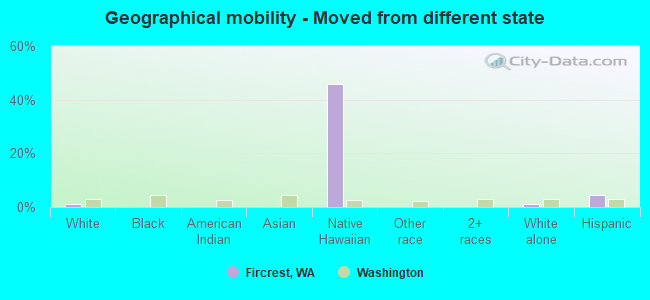
-
- Moved from different state
- 591.2%White / Caucasian
- 1545.9%Native Hawaiian / Pacific Islander
- 581.2%White alone, not Hispanic / Latino
- 184.5%Hispanic or Latino
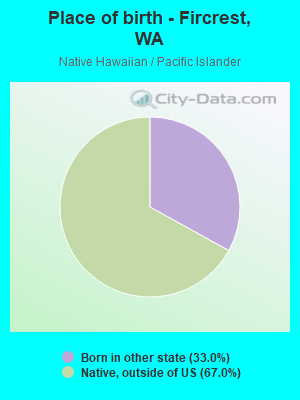
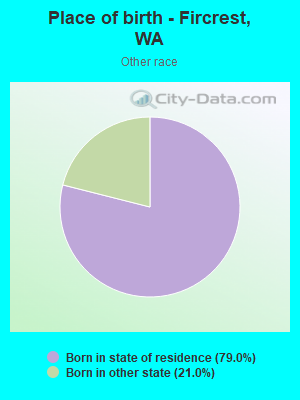
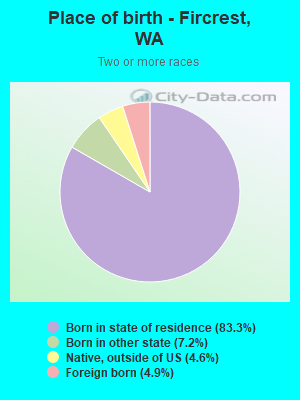
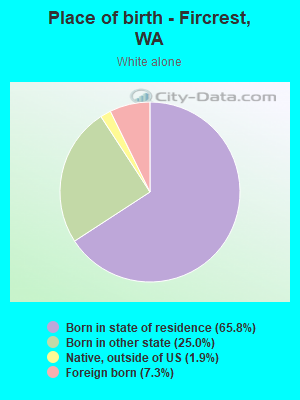
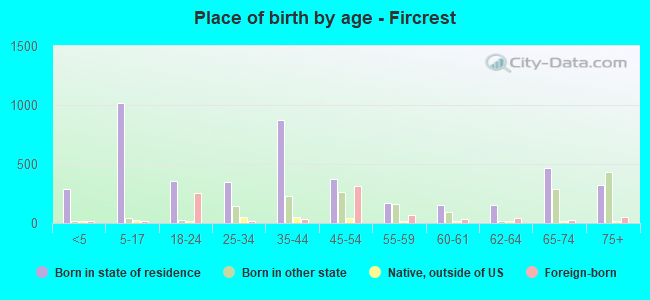
Children Nativity (place of birth) in Fircrest
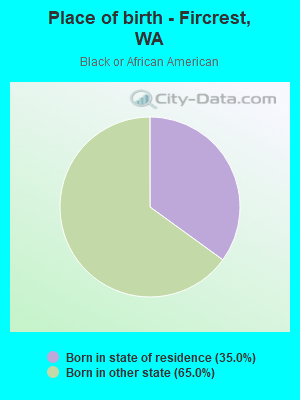
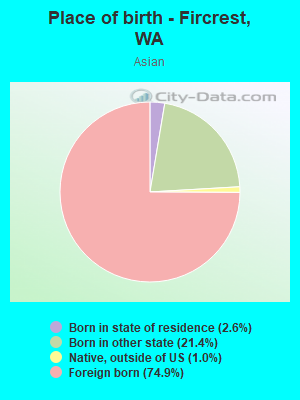
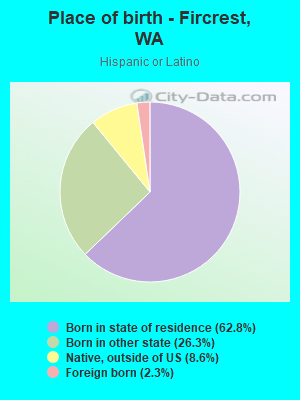
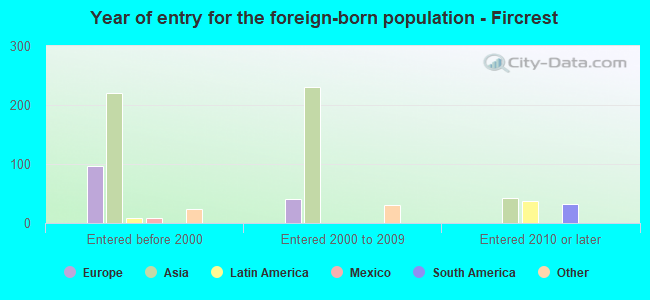
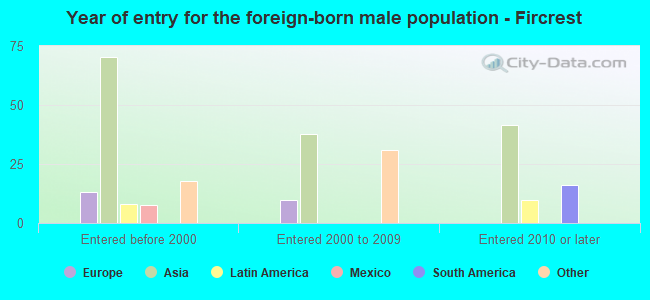
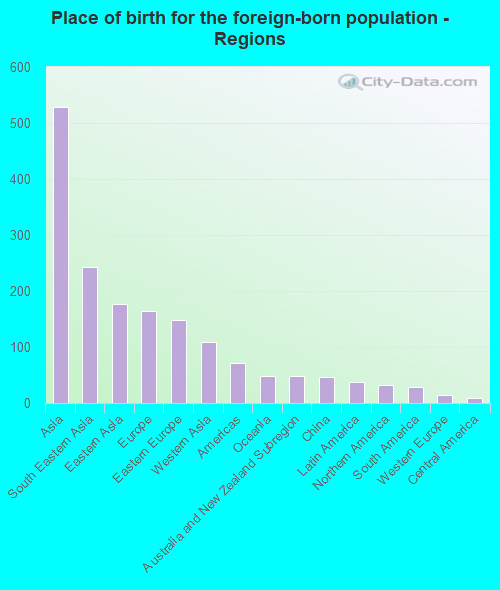
Place of birth for residents in Fircrest
![Place of birth for the foreign-born population - Regions]()
- 529Asia
- 243South Eastern Asia
- 176Eastern Asia
- 165Europe
- 149Eastern Europe
- 109Western Asia
- 71Americas
- 48Oceania
- 48Australia and New Zealand Subregion
- 47China
- 38Latin America
- 33Northern America
- 29South America
- 15Western Europe
- 9Central America
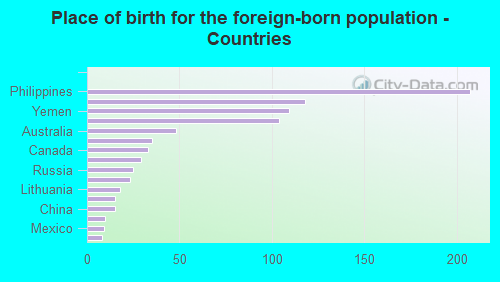
![Place of birth for the foreign-born population - Countries]()
- 207Philippines
- 118Korea
- 109Yemen
- 104Poland
- 48Australia
- 35Vietnam
- 33Canada
- 29Brazil
- 25Russia
- 23Taiwan
- 18Lithuania
- 15Netherlands
- 15China
- 10Japan
- 9Mexico
- 8Hong Kong
Grandparents responsible for own grandchildren in Fircrest
Zip codes: 98466.