Races in Fishers, Indiana (IN) Detailed Stats
Data:
Races - White alone (%)
Races - White alone (% change since 2000)
Races - Black alone (%)
Races - Black alone (% change since 2000)
Races - American Indian alone (%)
Races - American Indian alone (% change since 2000)
Races - Asian alone (%)
Races - Asian alone (% change since 2000)
Races - Hispanic (%)
Races - Hispanic (% change since 2000)
Races - Native Hawaiian and Other Pacific Islander alone (%)
Races - Native Hawaiian and Other Pacific Islander alone (% change since 2000)
Races - Two or more races(%)
Races - Two or more races(% change since 2000)
Races - Other race alone (%)
Races - Other race alone (% change since 2000)
Racial diversity
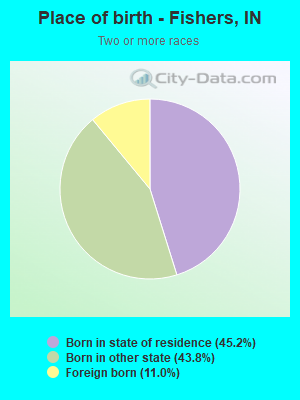
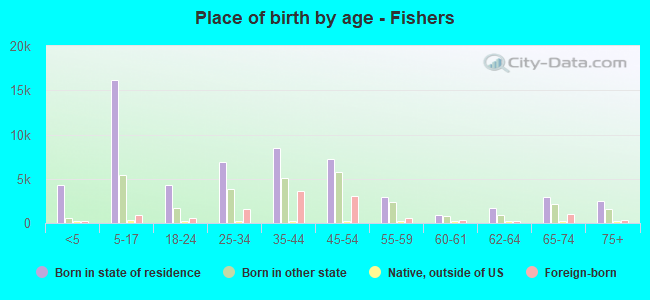
Place of birth - Born in state of residence (%)
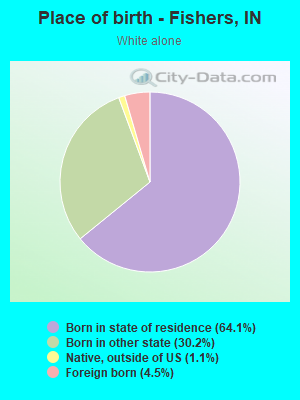
Place of birth - Born in state of residence (%) - White
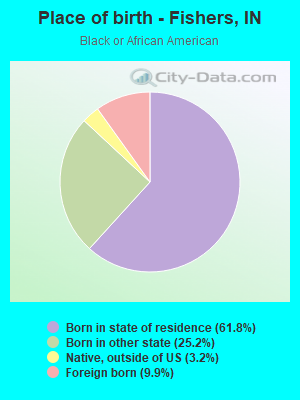
Place of birth - Born in state of residence (%) - Black or African American
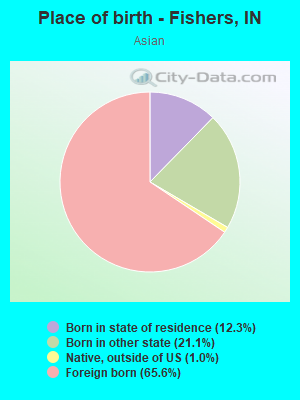
Place of birth - Born in state of residence (%) - Asian
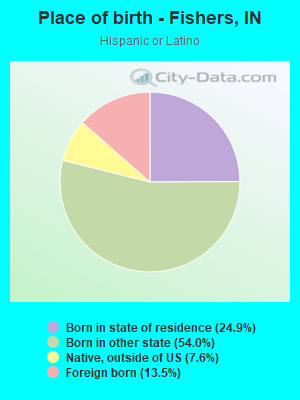
Place of birth - Born in state of residence (%) - Hispanic or Latino
Place of birth - Born in state of residence (%) - American Indian and Alaska Native
Place of birth - Born in state of residence (%) - Multirace
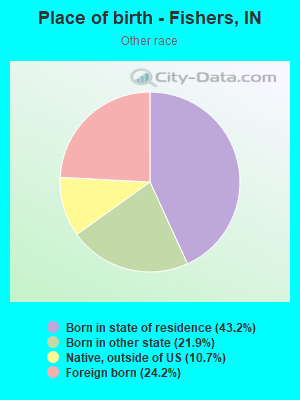
Place of birth - Born in state of residence (%) - Other Race
Place of birth - Born in other state (%)
Place of birth - Born in other state (%) - White
Place of birth - Born in other state (%) - Black or African American
Place of birth - Born in other state (%) - Asian
Place of birth - Born in other state (%) - Hispanic or Latino
Place of birth - Born in other state (%) - American Indian and Alaska Native
Place of birth - Born in other state (%) - Multirace
Place of birth - Born in other state (%) - Other Race
Place of birth - Native, outside of US (%)
Place of birth - Native, outside of US (%) - White
Place of birth - Native, outside of US (%) - Black or African American
Place of birth - Native, outside of US (%) - Asian
Place of birth - Native, outside of US (%) - Hispanic or Latino
Place of birth - Native, outside of US (%) - American Indian and Alaska Native
Place of birth - Native, outside of US (%) - Multirace
Place of birth - Native, outside of US (%) - Other Race
Place of birth - Foreign born (%)
Place of birth - Foreign born (%) - White
Place of birth - Foreign born (%) - Black or African American
Place of birth - Foreign born (%) - Asian
Place of birth - Foreign born (%) - Hispanic or Latino
Place of birth - Foreign born (%) - American Indian and Alaska Native
Place of birth - Foreign born (%) - Multirace
Place of birth - Foreign born (%) - Other Race
Residents speaking English at home (%)
Residents speaking English at home - Born in the United States (%)
Residents speaking English at home - Native, born elsewhere (%)
Residents speaking English at home - Foreign born (%)
Residents speaking Spanish at home (%)
Residents speaking Spanish at home - Born in the United States (%)
Residents speaking Spanish at home - Native, born elsewhere (%)
Residents speaking Spanish at home - Foreign born (%)
Residents speaking other language at home (%)
Residents speaking other language at home - Born in the United States (%)
Residents speaking other language at home - Native, born elsewhere (%)
Residents speaking other language at home - Foreign born (%)
Marital status - Never married (%)
Marital status - Now married (%)
Marital status - Separated (%)
Marital status - Widowed (%)
Marital status - Divorced (%)
Ancestries Reported - Arab (%)
Ancestries Reported - Czech (%)
Ancestries Reported - Danish (%)
Ancestries Reported - Dutch (%)
Ancestries Reported - English (%)
Ancestries Reported - French (%)
Ancestries Reported - French Canadian (%)
Ancestries Reported - German (%)
Ancestries Reported - Greek (%)
Ancestries Reported - Hungarian (%)
Ancestries Reported - Irish (%)
Ancestries Reported - Italian (%)
Ancestries Reported - Lithuanian (%)
Ancestries Reported - Norwegian (%)
Ancestries Reported - Polish (%)
Ancestries Reported - Portuguese (%)
Ancestries Reported - Russian (%)
Ancestries Reported - Scotch-Irish (%)
Ancestries Reported - Scottish (%)
Ancestries Reported - Slovak (%)
Ancestries Reported - Subsaharan African (%)
Ancestries Reported - Swedish (%)
Ancestries Reported - Swiss (%)
Ancestries Reported - Ukrainian (%)
Ancestries Reported - United States (%)
Ancestries Reported - Welsh (%)
Ancestries Reported - West Indian (%)
Ancestries Reported - Other (%)
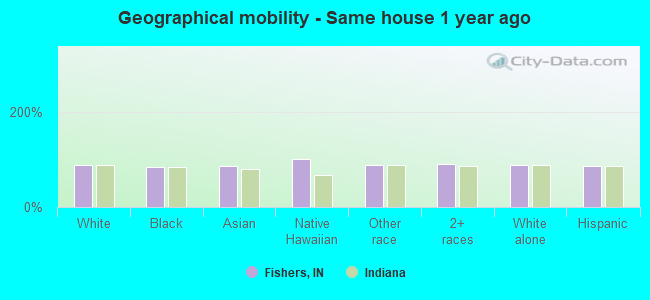
Geographical mobility - Same house 1 year ago (%)
Geographical mobility - Same house 1 year ago (%) - White
Geographical mobility - Same house 1 year ago (%) - Black or African American
Geographical mobility - Same house 1 year ago (%) - Asian
Geographical mobility - Same house 1 year ago (%) - Hispanic or Latino
Geographical mobility - Same house 1 year ago (%) - American Indian and Alaska Native
Geographical mobility - Same house 1 year ago (%) - Multirace
Geographical mobility - Same house 1 year ago (%) - Other Race
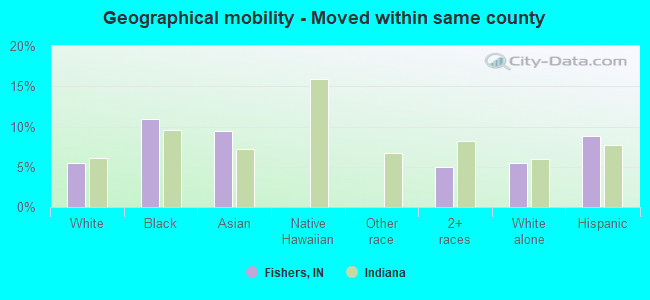
Geographical mobility - Moved within same county (%)
Geographical mobility - Moved within same county (%) - White
Geographical mobility - Moved within same county (%) - Black or African American
Geographical mobility - Moved within same county (%) - Asian
Geographical mobility - Moved within same county (%) - Hispanic or Latino
Geographical mobility - Moved within same county (%) - American Indian and Alaska Native
Geographical mobility - Moved within same county (%) - Multirace
Geographical mobility - Moved within same county (%) - Other Race
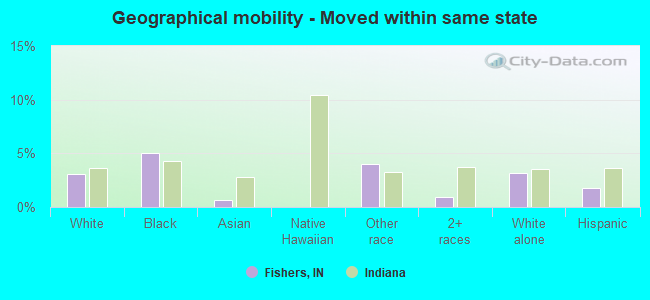
Geographical mobility - Moved from different county within same state (%)
Geographical mobility - Moved from different county within same state (%) - White
Geographical mobility - Moved from different county within same state (%) - Black or African American
Geographical mobility - Moved from different county within same state (%) - Asian
Geographical mobility - Moved from different county within same state (%) - Hispanic or Latino
Geographical mobility - Moved from different county within same state (%) - American Indian and Alaska Native
Geographical mobility - Moved from different county within same state (%) - Multirace
Geographical mobility - Moved from different county within same state (%) - Other Race
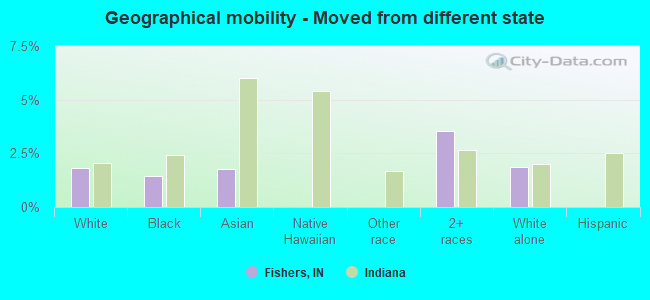
Geographical mobility - Moved from different state (%)
Geographical mobility - Moved from different state (%) - White
Geographical mobility - Moved from different state (%) - Black or African American
Geographical mobility - Moved from different state (%) - Asian
Geographical mobility - Moved from different state (%) - Hispanic or Latino
Geographical mobility - Moved from different state (%) - American Indian and Alaska Native
Geographical mobility - Moved from different state (%) - Multirace
Geographical mobility - Moved from different state (%) - Other Race
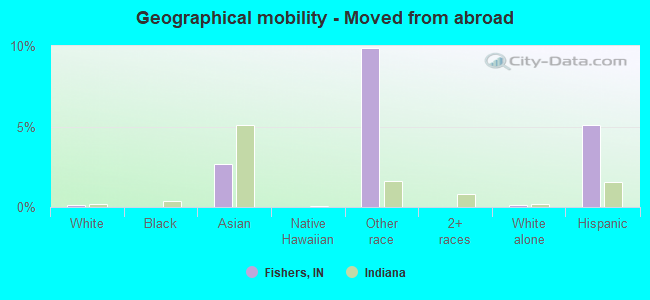
Geographical mobility - Moved from abroad (%)
Geographical mobility - Moved from abroad (%) - White
Geographical mobility - Moved from abroad (%) - Black or African American
Geographical mobility - Moved from abroad (%) - Asian
Geographical mobility - Moved from abroad (%) - Hispanic or Latino
Geographical mobility - Moved from abroad (%) - American Indian and Alaska Native
Geographical mobility - Moved from abroad (%) - Multirace
Geographical mobility - Moved from abroad (%) - Other Race
Place of birth for the foreign-born population - Ireland (%)
Place of birth for the foreign-born population - Denmark (%)
Place of birth for the foreign-born population - Norway (%)
Place of birth for the foreign-born population - Sweden (%)
Place of birth for the foreign-born population - United Kingdom (%)
Place of birth for the foreign-born population - England (%)
Place of birth for the foreign-born population - Scotland (%)
Place of birth for the foreign-born population - Other Northern Europe (%)
Place of birth for the foreign-born population - Austria (%)
Place of birth for the foreign-born population - Belgium (%)
Place of birth for the foreign-born population - France (%)
Place of birth for the foreign-born population - Germany (%)
Place of birth for the foreign-born population - Netherlands (%)
Place of birth for the foreign-born population - Switzerland (%)
Place of birth for the foreign-born population - Other Western Europe (%)
Place of birth for the foreign-born population - Greece (%)
Place of birth for the foreign-born population - Italy (%)
Place of birth for the foreign-born population - Portugal (%)
Place of birth for the foreign-born population - Spain (%)
Place of birth for the foreign-born population - Other Southern Europe (%)
Place of birth for the foreign-born population - Albania (%)
Place of birth for the foreign-born population - Belarus (%)
Place of birth for the foreign-born population - Bosnia and Herzegovina (%)
Place of birth for the foreign-born population - Bulgaria (%)
Place of birth for the foreign-born population - Croatia (%)
Place of birth for the foreign-born population - Czechoslovakia (%)
Place of birth for the foreign-born population - Hungary (%)
Place of birth for the foreign-born population - Latvia (%)
Place of birth for the foreign-born population - Lithuania (%)
Place of birth for the foreign-born population - North Macedonia (Macedonia) (%)
Place of birth for the foreign-born population - Moldova (%)
Place of birth for the foreign-born population - Poland (%)
Place of birth for the foreign-born population - Romania (%)
Place of birth for the foreign-born population - Russia (%)
Place of birth for the foreign-born population - Serbia (%)
Place of birth for the foreign-born population - Ukraine (%)
Place of birth for the foreign-born population - Other Eastern Europe (%)
Place of birth for the foreign-born population - China (%)
Place of birth for the foreign-born population - Hong Kong (%)
Place of birth for the foreign-born population - Taiwan (%)
Place of birth for the foreign-born population - Japan (%)
Place of birth for the foreign-born population - Korea (%)
Place of birth for the foreign-born population - Other Eastern Asia (%)
Place of birth for the foreign-born population - Afghanistan (%)
Place of birth for the foreign-born population - Bangladesh (%)
Place of birth for the foreign-born population - India (%)
Place of birth for the foreign-born population - Iran (%)
Place of birth for the foreign-born population - Kazakhstan (%)
Place of birth for the foreign-born population - Nepal (%)
Place of birth for the foreign-born population - Pakistan (%)
Place of birth for the foreign-born population - Sri Lanka (%)
Place of birth for the foreign-born population - Uzbekistan (%)
Place of birth for the foreign-born population - Other South Central Asia (%)
Place of birth for the foreign-born population - Burma (%)
Place of birth for the foreign-born population - Cambodia (%)
Place of birth for the foreign-born population - Indonesia (%)
Place of birth for the foreign-born population - Laos (%)
Place of birth for the foreign-born population - Malaysia (%)
Place of birth for the foreign-born population - Philippines (%)
Place of birth for the foreign-born population - Singapore (%)
Place of birth for the foreign-born population - Thailand (%)
Place of birth for the foreign-born population - Vietnam (%)
Place of birth for the foreign-born population - Other South Eastern Asia (%)
Place of birth for the foreign-born population - Armenia (%)
Place of birth for the foreign-born population - Iraq (%)
Place of birth for the foreign-born population - Israel (%)
Place of birth for the foreign-born population - Jordan (%)
Place of birth for the foreign-born population - Kuwait (%)
Place of birth for the foreign-born population - Lebanon (%)
Place of birth for the foreign-born population - Saudi Arabia (%)
Place of birth for the foreign-born population - Syria (%)
Place of birth for the foreign-born population - Turkey (%)
Place of birth for the foreign-born population - Yemen (%)
Place of birth for the foreign-born population - Other Western Asia (%)
Place of birth for the foreign-born population - Eritrea (%)
Place of birth for the foreign-born population - Ethiopia (%)
Place of birth for the foreign-born population - Kenya (%)
Place of birth for the foreign-born population - Somalia (%)
Place of birth for the foreign-born population - Uganda (%)
Place of birth for the foreign-born population - Zimbabwe (%)
Place of birth for the foreign-born population - Other Eastern Africa (%)
Place of birth for the foreign-born population - Cameroon (%)
Place of birth for the foreign-born population - Congo (%)
Place of birth for the foreign-born population - Democratic Republic of Congo (Zaire) (%)
Place of birth for the foreign-born population - Other Middle Africa (%)
Place of birth for the foreign-born population - Egypt (%)
Place of birth for the foreign-born population - Morocco (%)
Place of birth for the foreign-born population - Sudan (%)
Place of birth for the foreign-born population - Other Northern Africa (%)
Place of birth for the foreign-born population - South Africa (%)
Place of birth for the foreign-born population - Other Southern Africa (%)
Place of birth for the foreign-born population - Cabo Verde (%)
Place of birth for the foreign-born population - Ghana (%)
Place of birth for the foreign-born population - Liberia (%)
Place of birth for the foreign-born population - Nigeria (%)
Place of birth for the foreign-born population - Senegal (%)
Place of birth for the foreign-born population - Sierra Leone (%)
Place of birth for the foreign-born population - Other Western Africa (%)
Place of birth for the foreign-born population - Australia (%)
Place of birth for the foreign-born population - New Zealand (%)
Place of birth for the foreign-born population - Fiji (%)
Place of birth for the foreign-born population - Micronesia (%)
Place of birth for the foreign-born population - Bahamas (%)
Place of birth for the foreign-born population - Barbados (%)
Place of birth for the foreign-born population - Cuba (%)
Place of birth for the foreign-born population - Dominica (%)
Place of birth for the foreign-born population - Dominican Republic (%)
Place of birth for the foreign-born population - Grenada (%)
Place of birth for the foreign-born population - Haiti (%)
Place of birth for the foreign-born population - Jamaica (%)
Place of birth for the foreign-born population - St. Vincent and the Grenadines (%)
Place of birth for the foreign-born population - Trinidad and Tobago (%)
Place of birth for the foreign-born population - West Indies (%)
Place of birth for the foreign-born population - Other Caribbean (%)
Place of birth for the foreign-born population - Belize (%)
Place of birth for the foreign-born population - Costa Rica (%)
Place of birth for the foreign-born population - El Salvador (%)
Place of birth for the foreign-born population - Guatemala (%)
Place of birth for the foreign-born population - Honduras (%)
Place of birth for the foreign-born population - Mexico (%)
Place of birth for the foreign-born population - Nicaragua (%)
Place of birth for the foreign-born population - Panama (%)
Place of birth for the foreign-born population - Other Central America (%)
Place of birth for the foreign-born population - Argentina (%)
Place of birth for the foreign-born population - Bolivia (%)
Place of birth for the foreign-born population - Brazil (%)
Place of birth for the foreign-born population - Chile (%)
Place of birth for the foreign-born population - Colombia (%)
Place of birth for the foreign-born population - Ecuador (%)
Place of birth for the foreign-born population - Guyana (%)
Place of birth for the foreign-born population - Peru (%)
Place of birth for the foreign-born population - Uruguay (%)
Place of birth for the foreign-born population - Venezuela (%)
Place of birth for the foreign-born population - Other South America (%)
Place of birth for the foreign-born population - Canada (%)
Place of birth for the foreign-born population - Other Northern America (%)
Place of birth for the foreign-born population - Other (%)
Latest news about races in Fishers, IN collected exclusively by city-data.com from local newspapers, TV, and radio stations
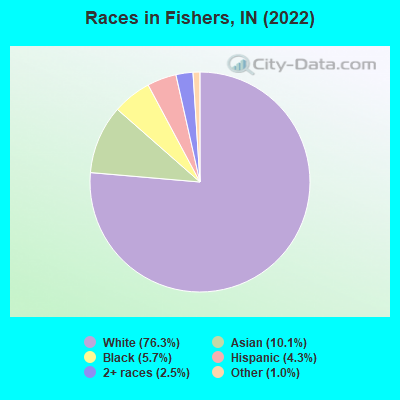
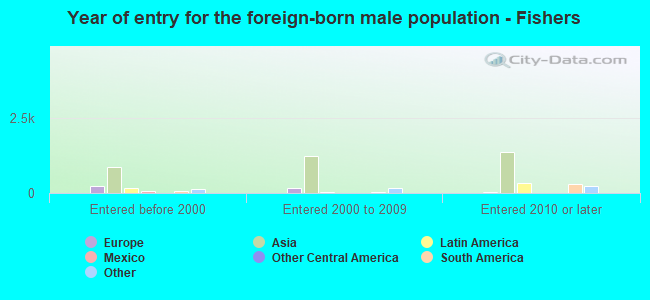
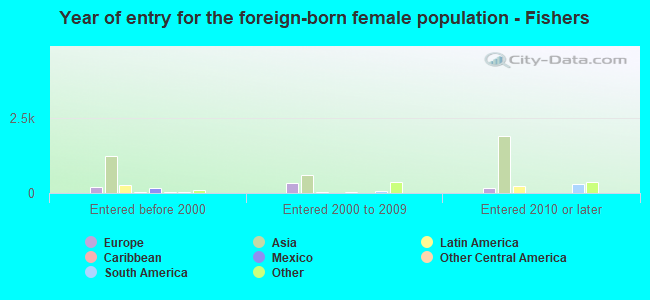
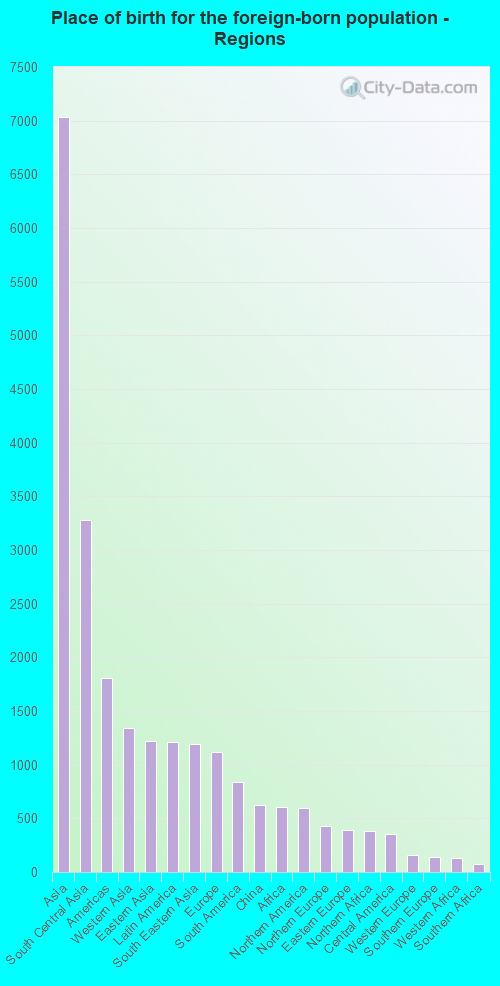
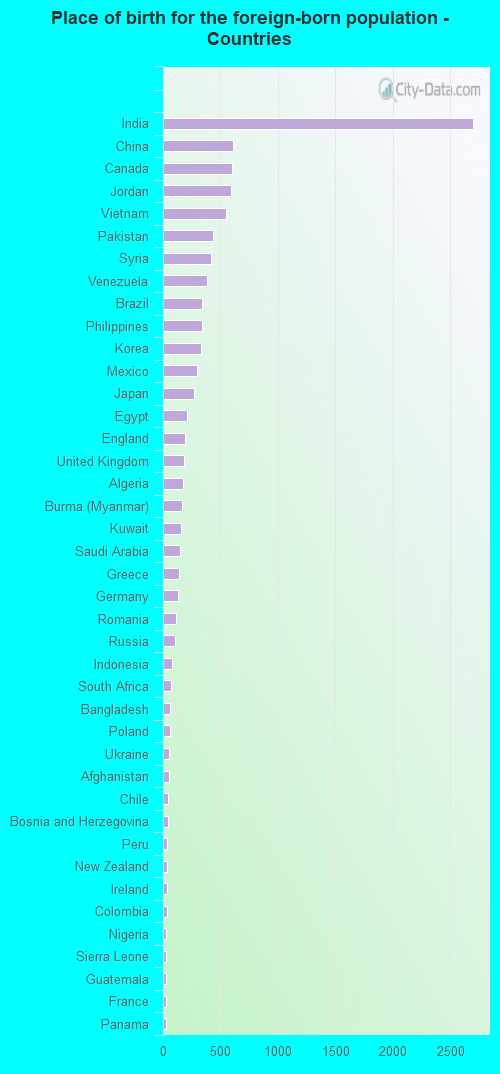
According to 2022 data, the most numerous races in Fishers, IN are White alone (77,983 residents), Black alone (5,788 residents), and Hispanic (4,384 residents). 87.4% of Fishers residents speak English at home. 10.3% of Fishers, IN residents are foreign-born (6.5% born in Asia, 1.1% born in Latin America, 1.0% born in Europe), which is 41.6% greater than the foreign-born rate of 6.0% across the entire state of Indiana.
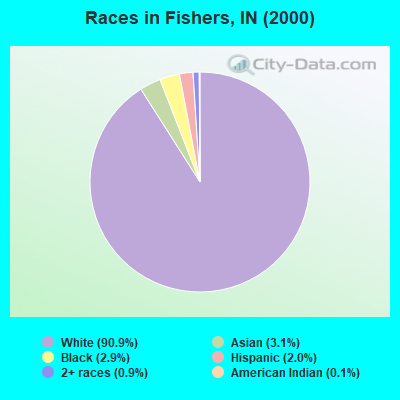
Race distribution in Fishers
2000 2022
5,219,373 85.8% White alone 505,462 8.3% Black alone 214,536 3.5% Hispanic 61,115 1.0% Two or more races 58,424 1.0% Asian alone 13,654 0.2% American Indian alone 6,348 0.1% Other race alone 1,573 0.03% Native Hawaiian and Other
5,192,455 76.0% White alone 628,054 9.2% Black alone 534,528 7.8% Hispanic 263,242 3.9% Two or more races 172,880 2.5% Asian alone 33,467 0.5% Other race alone 5,866 0.09% American Indian alone 2,545 0.04% Native Hawaiian and Other
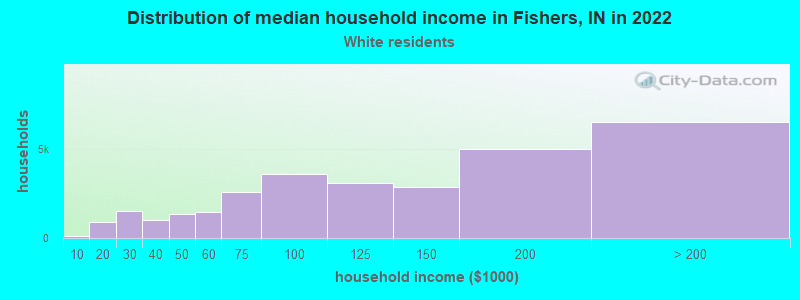
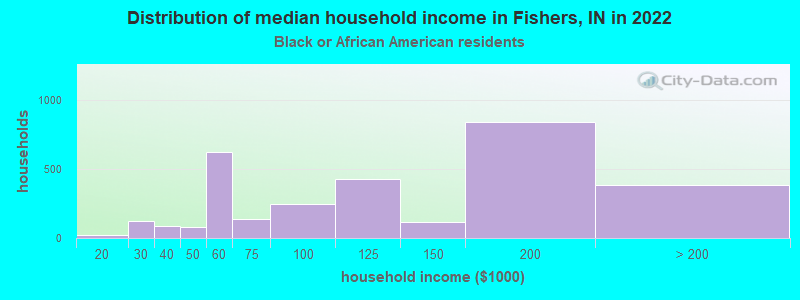
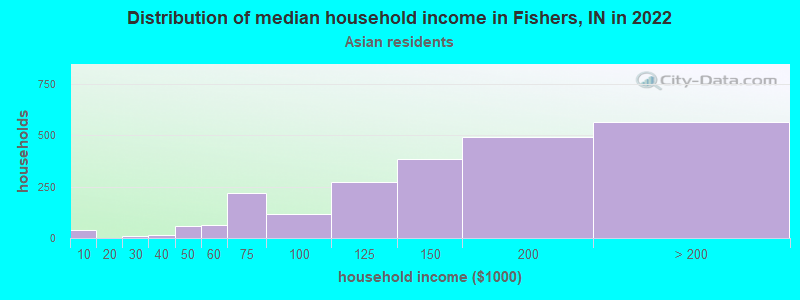
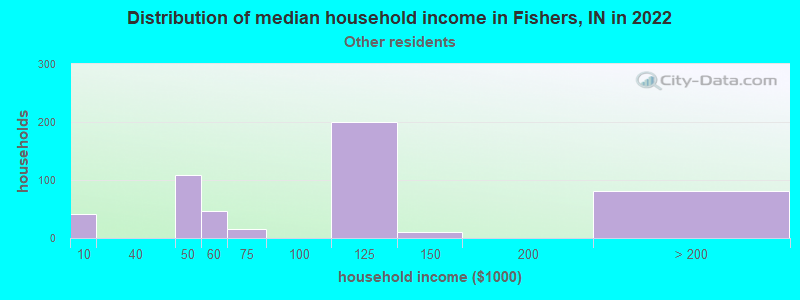
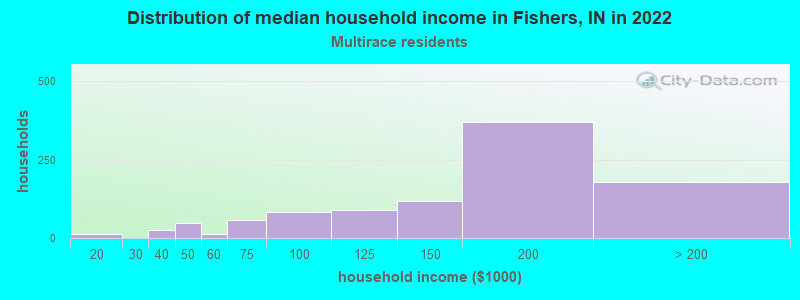
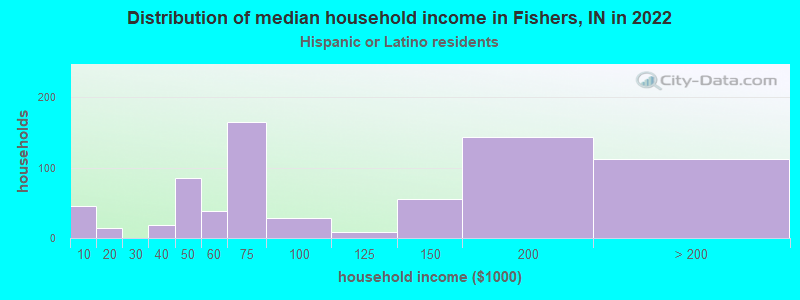
Income and house value in Fishers Median household income in 2022 $118,574 White non-Hispanic householders$100,846 Black householders$158,448 Asian householders$120,970 Some other race householders$151,336 Two or more races householdersMedian 2022 house value $367,914 White Non-Hispanic householders$369,514 Black or African American householders$428,471 American Indian or Alaska Native householders $391,680 Asian householders$307,357 Some other race householders$461,149 Two or more races householders$377,055 Hispanic or Latino householders
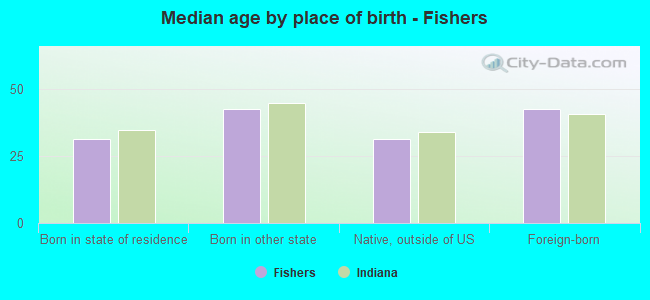
Median age by race in Fishers
38.8 Median age for White residents35.9 41.2 32.8 Median age for Black or African American residents32.6 36.0 -666,666,666.0 Median age for American Indian / Alaska Native residents-666,666,666.0 -666,666,666.0 37.7 Median age for Asian residents39.9 35.5 -666,666,666.0 Median age for Native Hawaiian / Pacific Islander residents-666,666,666.0 -666,666,666.0 31.1 Median age for Other race residents31.0 31.3 33.6 Median age for Two or more races residents22.3 33.9 39.0 Median age for White alone residents36.2 41.3 31.7 Median age for Hispanic or Latino residents31.3 32.9
Owner/renter occupied households by race in Fishers
House owners and renters - White residents 23,407 78.6% Owner occupied6,382 21.4% Renter occupiedHouse owners and renters - Black or African American residents 1,850 57.9% Owner occupied1,344 42.1% Renter occupiedHouse owners and renters - Asian residents 2,465 78.2% Owner occupied689 21.8% Renter occupiedHouse owners and renters - Other race residents 170 37.4% Owner occupied284 62.6% Renter occupiedHouse owners and renters - Two or more races residents 765 71.2% Owner occupied309 28.8% Renter occupiedHouse owners and renters - White alone residents 23,354 78.8% Owner occupied6,290 21.2% Renter occupiedHouse owners and renters - Hispanic or Latino residents 534 38.9% Owner occupied838 61.1% Renter occupied
Language usage in Fishers
English speakers - Total 87.4% of residents of Fishers speak English at home.
2.1% of residents speak Spanish at home 1,626 81.1% Speak English very well379 18.9% Speak English less than very well10.8% of residents speak other language at home 7,294 69.4% Speak English very well3,211 30.6% Speak English less than very well
English speakers - Born in the United States 93.9% of residents of Fishers speak English at home.
2.7% of residents speak Spanish at home 872 97.4% Speak English very well23 2.6% Speak English less than very well3.6% of residents speak other language at home 1,156 95.4% Speak English very well56 4.6% Speak English less than very well
English speakers - Native, born elsewhere 69.5% of residents of Fishers speak English at home.
9.7% of residents speak Spanish at home 12 15.0% Speak English very well68 85.0% Speak English less than very well20.5% of residents speak other language at home 170 100.0% Speak English very well
English speakers - Foreign-born 14.1% of residents of Fishers speak English at home.
6.7% of residents speak Spanish at home 403 58.2% Speak English very well289 41.8% Speak English less than very well80.9% of residents speak other language at home 5,298 63.0% Speak English very well3,114 37.0% Speak English less than very well
White (Caucasian) - Speak only English Native:
98.3% (70,915)Foreign-born:
19.0% (671)
White (Caucasian) - Speak another language Native:
1.7% (1,261)Foreign-born:
81.0% (2,855)
Black or African American - Speak only English Native:
98.3% (4,492)Foreign-born:
8.8% (19)
Black or African American - Speak another language Native:
1.6% (71)Foreign-born:
99.1% (209)
Asian - Speak only English Native:
58.2% (1,518)Foreign-born:
5.0% (337)
Asian - Speak another language Native:
41.8% (1,092)Foreign-born:
95.0% (6,459)
Other race - Speak only English Native:
83.9% (901)Foreign-born:
9.1% (33)
Other race - Speak another language Native:
13.7% (148)Foreign-born:
100.0% (367)
Two or more races - Speak only English Native:
88.7% (3,601)Foreign-born:
29.4% (115)
Two or more races - Speak another language Native:
11.2% (456)Foreign-born:
75.9% (298)
White alone - Speak only English Native:
98.3% (70,454)Foreign-born:
19.0% (671)
White alone - Speak another language Native:
1.7% (1,208)Foreign-born:
81.0% (2,855)
Hispanic or Latino - Speak only English Native:
67.9% (1,593)Foreign-born:
6.4% (45)
Hispanic or Latino - Speak another language Native:
32.0% (750)Foreign-born:
93.3% (654)
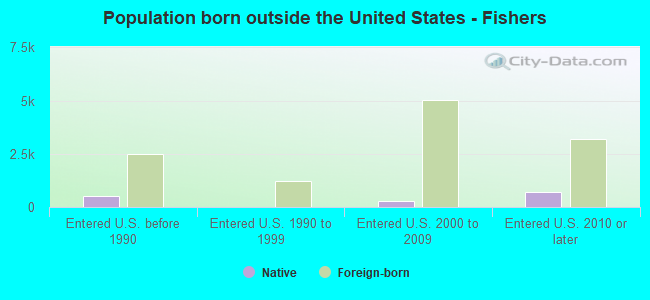
Foreign-born residents in Fishers 10,615 residents are foreign born (6.5% Asia , 1.1% Latin America , 1.0% Europe ).
This city:
10.3%Indiana:
5.6%
Marital status for residents in Fishers Marital status - White (Caucasian) population 15 years and over
Males 32.5% Never married60.3% Now married0.3% Separated1.2% Widowed5.7% DivorcedFemales 20.9% Never married59.8% Now married0.9% Separated6.4% Widowed12.0% DivorcedWomen who gave birth in the past 12 months Now married:
100.0% (511)Unmarried:
0.0% (0)
Women who did not give birth in the past 12 months Now married:
58.3% (10,119)Unmarried:
41.7% (7,244)
Marital status - Black or African American population 15 years and over
Males 31.2% Never married67.3% Now married0.0% Separated0.0% Widowed1.6% DivorcedFemales 35.6% Never married38.4% Now married1.1% Separated4.2% Widowed20.7% DivorcedWomen who did not give birth in the past 12 months Now married:
40.8% (778)Unmarried:
59.2% (1,129)
Marital status - Asian population 15 years and over
Males 19.2% Never married76.7% Now married0.0% Separated2.7% Widowed1.4% DivorcedFemales 13.3% Never married79.3% Now married0.0% Separated6.3% Widowed1.1% DivorcedWomen who gave birth in the past 12 months Now married:
100.0% (94)Unmarried:
0.0% (0)
Women who did not give birth in the past 12 months Now married:
78.1% (1,975)Unmarried:
21.9% (552)
Marital status - Other race population 15 years and over
Males 28.9% Never married71.1% Now married0.0% Separated0.0% Widowed0.0% DivorcedFemales 16.3% Never married71.3% Now married12.4% Separated0.0% Widowed0.0% DivorcedWomen who did not give birth in the past 12 months Now married:
82.5% (457)Unmarried:
17.5% (97)
Marital status - Two or more races population 15 years and over
Males 62.4% Never married36.0% Now married0.0% Separated0.0% Widowed1.7% DivorcedFemales 45.6% Never married47.6% Now married0.0% Separated3.0% Widowed3.8% DivorcedWomen who gave birth in the past 12 months Now married:
100.0% (5)Unmarried:
0.0% (0)
Women who did not give birth in the past 12 months Now married:
37.0% (477)Unmarried:
63.0% (812)
Marital status - White alone, not Hispanic / Latino population 15 years and over
Males 32.4% Never married60.6% Now married0.0% Separated1.2% Widowed5.8% DivorcedFemales 20.7% Never married60.0% Now married0.9% Separated6.5% Widowed11.9% DivorcedWomen who gave birth in the past 12 months Now married:
100.0% (511)Unmarried:
0.0% (0)
Women who did not give birth in the past 12 months Now married:
58.4% (10,033)Unmarried:
41.6% (7,159)
Marital status - Hispanic or Latino population 15 years and over
Males 47.6% Never married47.8% Now married1.2% Separated0.0% Widowed3.4% DivorcedFemales 33.5% Never married46.6% Now married5.1% Separated1.0% Widowed13.9% DivorcedWomen who gave birth in the past 12 months Now married:
100.0% (23)Unmarried:
0.0% (0)
Women who did not give birth in the past 12 months Now married:
40.1% (397)Unmarried:
59.9% (592)
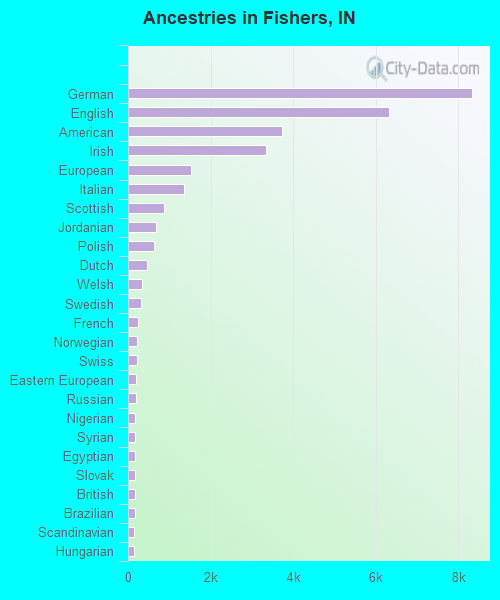
Ancestries in Fishers
8,328 18.4% German6,325 14.0% English3,728 8.2% American3,332 7.3% Irish1,525 3.4% European1,367 3.0% Italian872 1.9% Scottish678 1.5% Jordanian626 1.4% Polish469 1.0% Dutch347 0.8% Welsh309 0.7% Swedish252 0.6% French228 0.5% Norwegian216 0.5% Swiss196 0.4% Eastern European185 0.4% Russian167 0.4% Nigerian166 0.4% Syrian163 0.4% Egyptian162 0.4% Slovak160 0.4% British159 0.4% Brazilian145 0.3% Scandinavian137 0.3% Hungarian132 0.3% Czech130 0.3% Romanian127 0.3% African123 0.3% Scotch-Irish92 0.2% Belgian91 0.2% Arab90 0.2% Latvian67 0.1% Portuguese67 0.1% Serbian63 0.1% Lithuanian63 0.1% Yugoslavian54 0.1% Armenian50 0.1% Greek44 0.10% Slovene44 0.10% Ukrainian39 0.09% Austrian39 0.09% Northern European38 0.08% Czechoslovakian35 0.08% Liberian25 0.06% Luxembourger22 0.05% Canadian21 0.05% French Canadian20 0.04% Croatian20 0.04% Celtic20 0.04% Bahamian18 0.04% Iranian16 0.04% Lebanese15 0.03% Jamaican10 0.02% Australian
Geographical mobility in Fishers Same house 1 year ago 69,782 89.4% White (Caucasian)4,196 83.1% Black or African American7,714 86.2% Asian27 100.0% Native Hawaiian / Pacific Islander1,297 88.2% Other race4,336 90.5% Two or more races69,360 89.5% White alone, not Hispanic / Latino2,708 85.4% Hispanic or LatinoMoved within same county 4,295 5.5% White / Caucasian552 10.9% Black or African American840 9.4% Asian236 4.9% Two or more races4,203 5.4% White alone, not Hispanic / Latino281 8.8% Hispanic or LatinoMoved within same state 2,435 3.1% White / Caucasian253 5.0% Black or African American61 0.7% Asian60 4.0% Other race43 0.9% Two or more races2,435 3.1% White alone, not Hispanic / Latino56 1.8% Hispanic or LatinoMoved from different state 1,429 1.8% White / Caucasian72 1.4% Black or African American159 1.8% Asian170 3.5% Two or more races1,429 1.8% White alone, not Hispanic / LatinoMoved from abroad 112 0.1% White237 2.6% Asian145 9.9% Other race112 0.1% White alone, not Hispanic / Latino162 5.1% Hispanic or Latino
Children Nativity (place of birth) in Fishers
Children under 6 years - Living with two parents Both parents native 3,959 100.0% NativeBoth parents foreign-born 1,434 100.0% NativeOne native, one foreign-born parent 437 100.0% NativeChildren under 6 years - Living with one parent Native parent 805 100.0% NativeForeign-born parent 36 100.0% NativeChildren 6 to 17 years - Living with two parents Both parents native 13,720 99.1% Native118 0.9% Foreign-bornBoth parents foreign-born 2,225 77.6% Native642 22.4% Foreign-bornOne native, one foreign-born parent 1,075 100.0% NativeChildren 6 to 17 years - Living with one parent Native parent 2,897 100.0% NativeForeign-born parent 297 63.6% Native170 36.4% Foreign-born
Grandparents responsible for own grandchildren in Fishers
Grandparents (30 to 59 years) White / Caucasian 36 27.0% Responsible for grandchildren99 73.0% Not responsible for grandchildrenBlack or African American 20 100.0% Responsible for grandchildrenAsian 21 27.7% Responsible for grandchildren54 72.3% Not responsible for grandchildrenTwo or more races 31 100.0% Not responsible for grandchildrenWhite alone, not Hispanic / Latino 38 26.6% Responsible for grandchildren104 73.4% Not responsible for grandchildrenGrandparents (60 years and over) White / Caucasian 56 9.1% Responsible for grandchildren557 90.9% Not responsible for grandchildrenBlack or African American 30 100.0% Not responsible for grandchildrenAsian 283 100.0% Not responsible for grandchildrenTwo or more races 15 100.0% Not responsible for grandchildrenWhite alone, not Hispanic / Latino 53 9.7% Responsible for grandchildren489 90.3% Not responsible for grandchildren