Races in Fitchburg, Wisconsin (WI) Detailed Stats
Data:
Races - White alone (%)
Races - White alone (% change since 2000)
Races - Black alone (%)
Races - Black alone (% change since 2000)
Races - American Indian alone (%)
Races - American Indian alone (% change since 2000)
Races - Asian alone (%)
Races - Asian alone (% change since 2000)
Races - Hispanic (%)
Races - Hispanic (% change since 2000)
Races - Native Hawaiian and Other Pacific Islander alone (%)
Races - Native Hawaiian and Other Pacific Islander alone (% change since 2000)
Races - Two or more races(%)
Races - Two or more races(% change since 2000)
Races - Other race alone (%)
Races - Other race alone (% change since 2000)
Racial diversity
Place of birth - Born in state of residence (%)
Place of birth - Born in state of residence (%) - White
Place of birth - Born in state of residence (%) - Black or African American
Place of birth - Born in state of residence (%) - Asian
Place of birth - Born in state of residence (%) - Hispanic or Latino
Place of birth - Born in state of residence (%) - American Indian and Alaska Native
Place of birth - Born in state of residence (%) - Multirace
Place of birth - Born in state of residence (%) - Other Race
Place of birth - Born in other state (%)
Place of birth - Born in other state (%) - White
Place of birth - Born in other state (%) - Black or African American
Place of birth - Born in other state (%) - Asian
Place of birth - Born in other state (%) - Hispanic or Latino
Place of birth - Born in other state (%) - American Indian and Alaska Native
Place of birth - Born in other state (%) - Multirace
Place of birth - Born in other state (%) - Other Race
Place of birth - Native, outside of US (%)
Place of birth - Native, outside of US (%) - White
Place of birth - Native, outside of US (%) - Black or African American
Place of birth - Native, outside of US (%) - Asian
Place of birth - Native, outside of US (%) - Hispanic or Latino
Place of birth - Native, outside of US (%) - American Indian and Alaska Native
Place of birth - Native, outside of US (%) - Multirace
Place of birth - Native, outside of US (%) - Other Race
Place of birth - Foreign born (%)
Place of birth - Foreign born (%) - White
Place of birth - Foreign born (%) - Black or African American
Place of birth - Foreign born (%) - Asian
Place of birth - Foreign born (%) - Hispanic or Latino
Place of birth - Foreign born (%) - American Indian and Alaska Native
Place of birth - Foreign born (%) - Multirace
Place of birth - Foreign born (%) - Other Race
Residents speaking English at home (%)
Residents speaking English at home - Born in the United States (%)
Residents speaking English at home - Native, born elsewhere (%)
Residents speaking English at home - Foreign born (%)
Residents speaking Spanish at home (%)
Residents speaking Spanish at home - Born in the United States (%)
Residents speaking Spanish at home - Native, born elsewhere (%)
Residents speaking Spanish at home - Foreign born (%)
Residents speaking other language at home (%)
Residents speaking other language at home - Born in the United States (%)
Residents speaking other language at home - Native, born elsewhere (%)
Residents speaking other language at home - Foreign born (%)
Marital status - Never married (%)
Marital status - Now married (%)
Marital status - Separated (%)
Marital status - Widowed (%)
Marital status - Divorced (%)
Ancestries Reported - Arab (%)
Ancestries Reported - Czech (%)
Ancestries Reported - Danish (%)
Ancestries Reported - Dutch (%)
Ancestries Reported - English (%)
Ancestries Reported - French (%)
Ancestries Reported - French Canadian (%)
Ancestries Reported - German (%)
Ancestries Reported - Greek (%)
Ancestries Reported - Hungarian (%)
Ancestries Reported - Irish (%)
Ancestries Reported - Italian (%)
Ancestries Reported - Lithuanian (%)
Ancestries Reported - Norwegian (%)
Ancestries Reported - Polish (%)
Ancestries Reported - Portuguese (%)
Ancestries Reported - Russian (%)
Ancestries Reported - Scotch-Irish (%)
Ancestries Reported - Scottish (%)
Ancestries Reported - Slovak (%)
Ancestries Reported - Subsaharan African (%)
Ancestries Reported - Swedish (%)
Ancestries Reported - Swiss (%)
Ancestries Reported - Ukrainian (%)
Ancestries Reported - United States (%)
Ancestries Reported - Welsh (%)
Ancestries Reported - West Indian (%)
Ancestries Reported - Other (%)
Geographical mobility - Same house 1 year ago (%)
Geographical mobility - Same house 1 year ago (%) - White
Geographical mobility - Same house 1 year ago (%) - Black or African American
Geographical mobility - Same house 1 year ago (%) - Asian
Geographical mobility - Same house 1 year ago (%) - Hispanic or Latino
Geographical mobility - Same house 1 year ago (%) - American Indian and Alaska Native
Geographical mobility - Same house 1 year ago (%) - Multirace
Geographical mobility - Same house 1 year ago (%) - Other Race
Geographical mobility - Moved within same county (%)
Geographical mobility - Moved within same county (%) - White
Geographical mobility - Moved within same county (%) - Black or African American
Geographical mobility - Moved within same county (%) - Asian
Geographical mobility - Moved within same county (%) - Hispanic or Latino
Geographical mobility - Moved within same county (%) - American Indian and Alaska Native
Geographical mobility - Moved within same county (%) - Multirace
Geographical mobility - Moved within same county (%) - Other Race
Geographical mobility - Moved from different county within same state (%)
Geographical mobility - Moved from different county within same state (%) - White
Geographical mobility - Moved from different county within same state (%) - Black or African American
Geographical mobility - Moved from different county within same state (%) - Asian
Geographical mobility - Moved from different county within same state (%) - Hispanic or Latino
Geographical mobility - Moved from different county within same state (%) - American Indian and Alaska Native
Geographical mobility - Moved from different county within same state (%) - Multirace
Geographical mobility - Moved from different county within same state (%) - Other Race
Geographical mobility - Moved from different state (%)
Geographical mobility - Moved from different state (%) - White
Geographical mobility - Moved from different state (%) - Black or African American
Geographical mobility - Moved from different state (%) - Asian
Geographical mobility - Moved from different state (%) - Hispanic or Latino
Geographical mobility - Moved from different state (%) - American Indian and Alaska Native
Geographical mobility - Moved from different state (%) - Multirace
Geographical mobility - Moved from different state (%) - Other Race
Geographical mobility - Moved from abroad (%)
Geographical mobility - Moved from abroad (%) - White
Geographical mobility - Moved from abroad (%) - Black or African American
Geographical mobility - Moved from abroad (%) - Asian
Geographical mobility - Moved from abroad (%) - Hispanic or Latino
Geographical mobility - Moved from abroad (%) - American Indian and Alaska Native
Geographical mobility - Moved from abroad (%) - Multirace
Geographical mobility - Moved from abroad (%) - Other Race
Place of birth for the foreign-born population - Ireland (%)
Place of birth for the foreign-born population - Denmark (%)
Place of birth for the foreign-born population - Norway (%)
Place of birth for the foreign-born population - Sweden (%)
Place of birth for the foreign-born population - United Kingdom (%)
Place of birth for the foreign-born population - England (%)
Place of birth for the foreign-born population - Scotland (%)
Place of birth for the foreign-born population - Other Northern Europe (%)
Place of birth for the foreign-born population - Austria (%)
Place of birth for the foreign-born population - Belgium (%)
Place of birth for the foreign-born population - France (%)
Place of birth for the foreign-born population - Germany (%)
Place of birth for the foreign-born population - Netherlands (%)
Place of birth for the foreign-born population - Switzerland (%)
Place of birth for the foreign-born population - Other Western Europe (%)
Place of birth for the foreign-born population - Greece (%)
Place of birth for the foreign-born population - Italy (%)
Place of birth for the foreign-born population - Portugal (%)
Place of birth for the foreign-born population - Spain (%)
Place of birth for the foreign-born population - Other Southern Europe (%)
Place of birth for the foreign-born population - Albania (%)
Place of birth for the foreign-born population - Belarus (%)
Place of birth for the foreign-born population - Bosnia and Herzegovina (%)
Place of birth for the foreign-born population - Bulgaria (%)
Place of birth for the foreign-born population - Croatia (%)
Place of birth for the foreign-born population - Czechoslovakia (%)
Place of birth for the foreign-born population - Hungary (%)
Place of birth for the foreign-born population - Latvia (%)
Place of birth for the foreign-born population - Lithuania (%)
Place of birth for the foreign-born population - North Macedonia (Macedonia) (%)
Place of birth for the foreign-born population - Moldova (%)
Place of birth for the foreign-born population - Poland (%)
Place of birth for the foreign-born population - Romania (%)
Place of birth for the foreign-born population - Russia (%)
Place of birth for the foreign-born population - Serbia (%)
Place of birth for the foreign-born population - Ukraine (%)
Place of birth for the foreign-born population - Other Eastern Europe (%)
Place of birth for the foreign-born population - China (%)
Place of birth for the foreign-born population - Hong Kong (%)
Place of birth for the foreign-born population - Taiwan (%)
Place of birth for the foreign-born population - Japan (%)
Place of birth for the foreign-born population - Korea (%)
Place of birth for the foreign-born population - Other Eastern Asia (%)
Place of birth for the foreign-born population - Afghanistan (%)
Place of birth for the foreign-born population - Bangladesh (%)
Place of birth for the foreign-born population - India (%)
Place of birth for the foreign-born population - Iran (%)
Place of birth for the foreign-born population - Kazakhstan (%)
Place of birth for the foreign-born population - Nepal (%)
Place of birth for the foreign-born population - Pakistan (%)
Place of birth for the foreign-born population - Sri Lanka (%)
Place of birth for the foreign-born population - Uzbekistan (%)
Place of birth for the foreign-born population - Other South Central Asia (%)
Place of birth for the foreign-born population - Burma (%)
Place of birth for the foreign-born population - Cambodia (%)
Place of birth for the foreign-born population - Indonesia (%)
Place of birth for the foreign-born population - Laos (%)
Place of birth for the foreign-born population - Malaysia (%)
Place of birth for the foreign-born population - Philippines (%)
Place of birth for the foreign-born population - Singapore (%)
Place of birth for the foreign-born population - Thailand (%)
Place of birth for the foreign-born population - Vietnam (%)
Place of birth for the foreign-born population - Other South Eastern Asia (%)
Place of birth for the foreign-born population - Armenia (%)
Place of birth for the foreign-born population - Iraq (%)
Place of birth for the foreign-born population - Israel (%)
Place of birth for the foreign-born population - Jordan (%)
Place of birth for the foreign-born population - Kuwait (%)
Place of birth for the foreign-born population - Lebanon (%)
Place of birth for the foreign-born population - Saudi Arabia (%)
Place of birth for the foreign-born population - Syria (%)
Place of birth for the foreign-born population - Turkey (%)
Place of birth for the foreign-born population - Yemen (%)
Place of birth for the foreign-born population - Other Western Asia (%)
Place of birth for the foreign-born population - Eritrea (%)
Place of birth for the foreign-born population - Ethiopia (%)
Place of birth for the foreign-born population - Kenya (%)
Place of birth for the foreign-born population - Somalia (%)
Place of birth for the foreign-born population - Uganda (%)
Place of birth for the foreign-born population - Zimbabwe (%)
Place of birth for the foreign-born population - Other Eastern Africa (%)
Place of birth for the foreign-born population - Cameroon (%)
Place of birth for the foreign-born population - Congo (%)
Place of birth for the foreign-born population - Democratic Republic of Congo (Zaire) (%)
Place of birth for the foreign-born population - Other Middle Africa (%)
Place of birth for the foreign-born population - Egypt (%)
Place of birth for the foreign-born population - Morocco (%)
Place of birth for the foreign-born population - Sudan (%)
Place of birth for the foreign-born population - Other Northern Africa (%)
Place of birth for the foreign-born population - South Africa (%)
Place of birth for the foreign-born population - Other Southern Africa (%)
Place of birth for the foreign-born population - Cabo Verde (%)
Place of birth for the foreign-born population - Ghana (%)
Place of birth for the foreign-born population - Liberia (%)
Place of birth for the foreign-born population - Nigeria (%)
Place of birth for the foreign-born population - Senegal (%)
Place of birth for the foreign-born population - Sierra Leone (%)
Place of birth for the foreign-born population - Other Western Africa (%)
Place of birth for the foreign-born population - Australia (%)
Place of birth for the foreign-born population - New Zealand (%)
Place of birth for the foreign-born population - Fiji (%)
Place of birth for the foreign-born population - Micronesia (%)
Place of birth for the foreign-born population - Bahamas (%)
Place of birth for the foreign-born population - Barbados (%)
Place of birth for the foreign-born population - Cuba (%)
Place of birth for the foreign-born population - Dominica (%)
Place of birth for the foreign-born population - Dominican Republic (%)
Place of birth for the foreign-born population - Grenada (%)
Place of birth for the foreign-born population - Haiti (%)
Place of birth for the foreign-born population - Jamaica (%)
Place of birth for the foreign-born population - St. Vincent and the Grenadines (%)
Place of birth for the foreign-born population - Trinidad and Tobago (%)
Place of birth for the foreign-born population - West Indies (%)
Place of birth for the foreign-born population - Other Caribbean (%)
Place of birth for the foreign-born population - Belize (%)
Place of birth for the foreign-born population - Costa Rica (%)
Place of birth for the foreign-born population - El Salvador (%)
Place of birth for the foreign-born population - Guatemala (%)
Place of birth for the foreign-born population - Honduras (%)
Place of birth for the foreign-born population - Mexico (%)
Place of birth for the foreign-born population - Nicaragua (%)
Place of birth for the foreign-born population - Panama (%)
Place of birth for the foreign-born population - Other Central America (%)
Place of birth for the foreign-born population - Argentina (%)
Place of birth for the foreign-born population - Bolivia (%)
Place of birth for the foreign-born population - Brazil (%)
Place of birth for the foreign-born population - Chile (%)
Place of birth for the foreign-born population - Colombia (%)
Place of birth for the foreign-born population - Ecuador (%)
Place of birth for the foreign-born population - Guyana (%)
Place of birth for the foreign-born population - Peru (%)
Place of birth for the foreign-born population - Uruguay (%)
Place of birth for the foreign-born population - Venezuela (%)
Place of birth for the foreign-born population - Other South America (%)
Place of birth for the foreign-born population - Canada (%)
Place of birth for the foreign-born population - Other Northern America (%)
Place of birth for the foreign-born population - Other (%)
Latest news about races in Fitchburg, WI collected exclusively by city-data.com from local newspapers, TV, and radio stations
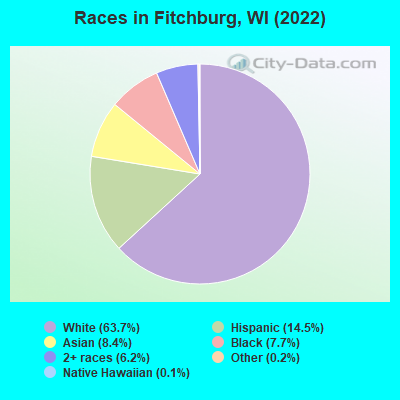
According to 2022 data, the most numerous races in Fitchburg, WI are White alone (19,289 residents), Hispanic (4,386 residents), and Black alone (2,328 residents). 82.8% of Fitchburg residents speak English at home. 12.4% of Fitchburg, WI residents are foreign-born (6.0% born in Latin America, 5.1% born in Asia), which is 59.7% greater than the foreign-born rate of 5.0% across the entire state of Wisconsin.
Race distribution in Fitchburg
2000 2022
4,681,630 87.3% White alone 300,245 5.6% Black alone 192,921 3.6% Hispanic 87,995 1.6% Asian alone 51,921 1.0% Two or more races 43,980 0.8% American Indian alone 3,637 0.07% Other race alone 1,346 0.03% Native Hawaiian and Other
4,654,031 79.0% White alone 447,022 7.6% Hispanic 345,678 5.9% Black alone 217,532 3.7% Two or more races 172,242 2.9% Asian alone 33,762 0.6% American Indian alone 19,680 0.3% Other race alone 2,592 0.04% Native Hawaiian and Other
Income and house value in Fitchburg Median household income in 2022 $101,935 White non-Hispanic householders$44,025 Black householders$121,324 Asian householders$46,805 Some other race householders$44,686 Two or more races householders$42,601 Hispanic or Latino race householdersMedian 2022 house value $408,739 White Non-Hispanic householdersover $1,000,000 Black or African American householders $406,879 Asian householders$484,302 Some other race householders$782,835 Two or more races householders$392,463 Hispanic or Latino householders
Median age by race in Fitchburg
38.4 Median age for White residents36.7 39.7 29.1 Median age for Black or African American residents29.6 30.0 50.2 Median age for American Indian / Alaska Native residents-584,362,139.3 54.1 37.0 Median age for Asian residents34.8 36.7 -825,688,072.6 Median age for Native Hawaiian / Pacific Islander residents-862,745,097.2 -732,444,443.7 24.8 Median age for Other race residents22.5 25.5 25.5 Median age for Two or more races residents23.3 27.2 40.0 Median age for White alone residents37.9 42.9 26.8 Median age for Hispanic or Latino residents22.6 29.2
Owner/renter occupied households by race in Fitchburg
House owners and renters - White residents 6,017 55.6% Owner occupied4,810 44.4% Renter occupiedHouse owners and renters - Black or African American residents 58 6.5% Owner occupied833 93.5% Renter occupiedHouse owners and renters - American Indian / Alaska Native residents 4 13.7% Owner occupied26 86.3% Renter occupiedHouse owners and renters - Asian residents 593 58.2% Owner occupied426 41.8% Renter occupiedHouse owners and renters - Native Hawaiian / Pacific Islander residents 63 100.0% Renter occupiedHouse owners and renters - Other race residents 520 100.0% Renter occupiedHouse owners and renters - Two or more races residents 188 13.9% Owner occupied1,162 86.1% Renter occupiedHouse owners and renters - White alone residents 5,947 57.7% Owner occupied4,366 42.3% Renter occupiedHouse owners and renters - Hispanic or Latino residents 173 11.2% Owner occupied1,373 88.8% Renter occupied
Language usage in Fitchburg
English speakers - Total 82.8% of residents of Fitchburg speak English at home.
8.7% of residents speak Spanish at home 1,496 59.7% Speak English very well1,011 40.3% Speak English less than very well8.3% of residents speak other language at home 1,642 69.2% Speak English very well730 30.8% Speak English less than very well
English speakers - Born in the United States 93.5% of residents of Fitchburg speak English at home.
2.7% of residents speak Spanish at home 181 69.3% Speak English very well80 30.7% Speak English less than very well3.7% of residents speak other language at home 338 95.2% Speak English very well17 4.8% Speak English less than very well
English speakers - Native, born elsewhere 68.4% of residents of Fitchburg speak English at home.
25.0% of residents speak Spanish at home 131 79.9% Speak English very well33 20.1% Speak English less than very well3.4% of residents speak other language at home 22 100.0% Speak English less than very well
English speakers - Foreign-born 15.8% of residents of Fitchburg speak English at home.
36.7% of residents speak Spanish at home 535 39.9% Speak English very well807 60.1% Speak English less than very well46.8% of residents speak other language at home 1,145 66.9% Speak English very well566 33.1% Speak English less than very well
White (Caucasian) - Speak only English Native:
97.2% (18,639)Foreign-born:
31.4% (206)
White (Caucasian) - Speak another language Native:
2.7% (518)Foreign-born:
68.7% (450)
Black or African American - Speak only English Native:
98.3% (2,024)Foreign-born:
9.5% (19)
Black or African American - Speak another language Native:
1.6% (33)Foreign-born:
100.0% (197)
Asian - Speak only English Native:
58.7% (598)Foreign-born:
17.2% (256)
Asian - Speak another language Native:
40.5% (412)Foreign-born:
83.6% (1,243)
Other race - Speak only English Native:
57.0% (266)Foreign-born:
5.4% (29)
Other race - Speak another language Native:
42.0% (196)Foreign-born:
94.2% (511)
Two or more races - Speak only English Native:
75.0% (1,893)Foreign-born:
9.1% (56)
Two or more races - Speak another language Native:
27.2% (685)Foreign-born:
97.1% (593)
White alone - Speak only English Native:
98.9% (18,093)Foreign-born:
28.1% (73)
White alone - Speak another language Native:
1.1% (193)Foreign-born:
77.1% (201)
Hispanic or Latino - Speak only English Native:
50.8% (1,146)Foreign-born:
16.0% (278)
Hispanic or Latino - Speak another language Native:
50.2% (1,133)Foreign-born:
84.5% (1,462)
Foreign-born residents in Fitchburg 3,751 residents are foreign born (6.0% Latin America , 5.1% Asia ).
This city:
12.4%Wisconsin:
5.0%
Marital status for residents in Fitchburg Marital status - White (Caucasian) population 15 years and over
Males 41.2% Never married48.0% Now married0.9% Separated1.7% Widowed8.1% DivorcedFemales 29.7% Never married51.3% Now married0.7% Separated7.1% Widowed11.1% DivorcedWomen who gave birth in the past 12 months Now married:
100.0% (198)Unmarried:
0.0% (0)
Women who did not give birth in the past 12 months Now married:
40.7% (1,900)Unmarried:
59.3% (2,764)
Marital status - Black or African American population 15 years and over
Males 66.8% Never married21.2% Now married0.3% Separated0.0% Widowed11.7% DivorcedFemales 55.8% Never married23.1% Now married1.8% Separated3.0% Widowed16.4% DivorcedWomen who gave birth in the past 12 months Now married:
52.9% (10)Unmarried:
47.1% (9)
Women who did not give birth in the past 12 months Now married:
28.0% (198)Unmarried:
72.0% (510)
Marital status - American Indian / Alaska Native population 15 years and over
Males 0.0% Never married100.0% Now married0.0% Separated0.0% Widowed0.0% DivorcedFemales 45.7% Never married0.0% Now married0.0% Separated34.3% Widowed20.0% DivorcedWomen who did not give birth in the past 12 months Now married:
0.0% (0)Unmarried:
100.0% (15)
Marital status - Asian population 15 years and over
Males 47.0% Never married47.1% Now married0.0% Separated0.0% Widowed6.0% DivorcedFemales 40.3% Never married48.0% Now married0.0% Separated3.0% Widowed8.7% DivorcedWomen who did not give birth in the past 12 months Now married:
48.7% (410)Unmarried:
51.3% (433)
Marital status - Other race population 15 years and over
Males 48.1% Never married36.5% Now married0.0% Separated0.0% Widowed15.4% DivorcedFemales 39.7% Never married60.3% Now married0.0% Separated0.0% Widowed0.0% DivorcedWomen who gave birth in the past 12 months Now married:
100.0% (24)Unmarried:
0.0% (0)
Women who did not give birth in the past 12 months Now married:
56.0% (140)Unmarried:
44.0% (110)
Marital status - Two or more races population 15 years and over
Males 70.0% Never married26.1% Now married3.5% Separated0.0% Widowed0.5% DivorcedFemales 65.3% Never married25.9% Now married2.6% Separated3.0% Widowed3.2% DivorcedWomen who gave birth in the past 12 months Now married:
0.0% (0)Unmarried:
100.0% (80)
Women who did not give birth in the past 12 months Now married:
30.3% (266)Unmarried:
69.7% (611)
Marital status - White alone, not Hispanic / Latino population 15 years and over
Males 41.8% Never married47.8% Now married0.3% Separated1.8% Widowed8.2% DivorcedFemales 28.3% Never married51.9% Now married0.3% Separated7.5% Widowed12.1% DivorcedWomen who gave birth in the past 12 months Now married:
100.0% (203)Unmarried:
0.0% (0)
Women who did not give birth in the past 12 months Now married:
39.4% (1,644)Unmarried:
60.6% (2,525)
Marital status - Hispanic or Latino population 15 years and over
Males 45.3% Never married41.0% Now married6.8% Separated0.0% Widowed6.9% DivorcedFemales 47.1% Never married46.7% Now married3.1% Separated1.5% Widowed1.7% DivorcedWomen who gave birth in the past 12 months Now married:
39.4% (27)Unmarried:
60.6% (42)
Women who did not give birth in the past 12 months Now married:
49.3% (612)Unmarried:
50.7% (629)
Ancestries in Fitchburg
2,075 16.0% German603 4.7% English515 4.0% Norwegian499 3.9% Irish456 3.5% European456 3.5% Italian317 2.4% Polish294 2.3% American271 2.1% South African252 1.9% Swedish190 1.5% African150 1.2% Danish108 0.8% Somali99 0.8% Czech85 0.7% Dutch81 0.6% Ukrainian68 0.5% Albanian61 0.5% Lithuanian58 0.4% Hungarian38 0.3% Swiss37 0.3% Eastern European35 0.3% Finnish30 0.2% French Canadian27 0.2% Luxembourger23 0.2% Scandinavian19 0.1% Russian17 0.1% Welsh13 0.1% Scottish13 0.1% Nigerian12 0.09% Northern European12 0.09% Iranian11 0.08% Ethiopian9 0.07% Slovene6 0.05% British6 0.05% Egyptian6 0.05% Portuguese4 0.03% Jamaican1 0.01% Czechoslovakian
Geographical mobility in Fitchburg Same house 1 year ago 17,442 84.5% White (Caucasian)1,681 72.9% Black or African American31 78.5% American Indian / Alaska Native1,386 54.4% Asian42 100.0% Native Hawaiian / Pacific Islander886 77.3% Other race2,652 73.3% Two or more races16,161 84.7% White alone, not Hispanic / Latino3,325 76.9% Hispanic or LatinoMoved within same county 1,559 7.5% White / Caucasian409 17.7% Black or African American439 17.2% Asian175 15.3% Other race472 13.0% Two or more races1,497 7.8% White alone, not Hispanic / Latino372 8.6% Hispanic or LatinoMoved within same state 656 3.2% White / Caucasian187 8.1% Black or African American36 1.4% Asian11 1.0% Other race184 5.1% Two or more races650 3.4% White alone, not Hispanic / Latino118 2.7% Hispanic or LatinoMoved from different state 1,032 5.0% White / Caucasian52 2.3% Black or African American6 14.1% American Indian / Alaska Native628 24.6% Asian35 3.1% Other race76 2.1% Two or more races782 4.1% White alone, not Hispanic / Latino409 9.4% Hispanic or LatinoMoved from abroad 68 1.9% Two or more races86 2.0% Hispanic or Latino
Children Nativity (place of birth) in Fitchburg
Children under 6 years - Living with two parents Both parents native 900 100.0% NativeBoth parents foreign-born 251 100.0% NativeOne native, one foreign-born parent 236 100.0% NativeChildren under 6 years - Living with one parent Native parent 452 100.0% NativeForeign-born parent 76 100.0% NativeChildren 6 to 17 years - Living with two parents Both parents native 1,447 99.5% Native7 0.5% Foreign-bornBoth parents foreign-born 368 77.2% Native108 22.8% Foreign-bornOne native, one foreign-born parent 438 100.0% NativeChildren 6 to 17 years - Living with one parent Native parent 801 100.0% NativeForeign-born parent 131 54.4% Native110 45.6% Foreign-born
Grandparents responsible for own grandchildren in Fitchburg
Grandparents (30 to 59 years) White / Caucasian 10 100.0% Not responsible for grandchildrenAsian 7 100.0% Not responsible for grandchildrenTwo or more races 22 100.0% Not responsible for grandchildrenWhite alone, not Hispanic / Latino 11 100.0% Not responsible for grandchildrenGrandparents (60 years and over) White / Caucasian 21 100.0% Responsible for grandchildrenAsian 11 20.6% Responsible for grandchildren42 79.4% Not responsible for grandchildrenWhite alone, not Hispanic / Latino 22 100.0% Responsible for grandchildren