Races in Fletcher, North Carolina (NC) Detailed Stats
Data:
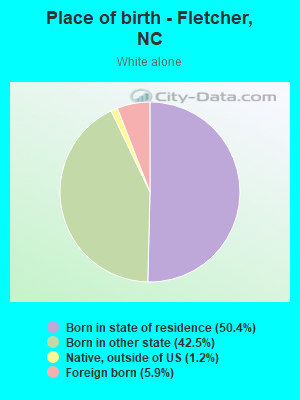
Races - White alone (%)
Races - White alone (% change since 2000)
Races - Black alone (%)
Races - Black alone (% change since 2000)
Races - American Indian alone (%)
Races - American Indian alone (% change since 2000)
Races - Asian alone (%)
Races - Asian alone (% change since 2000)
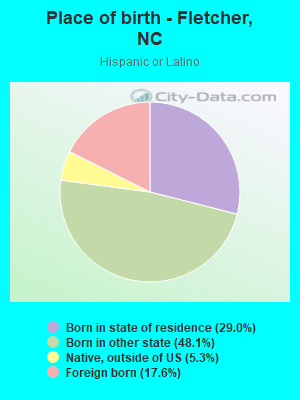
Races - Hispanic (%)
Races - Hispanic (% change since 2000)
Races - Native Hawaiian and Other Pacific Islander alone (%)
Races - Native Hawaiian and Other Pacific Islander alone (% change since 2000)
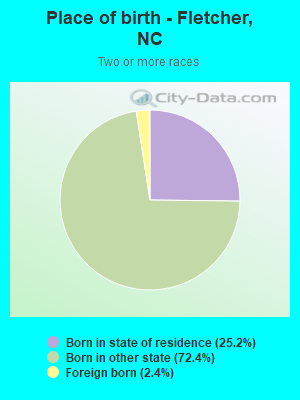
Races - Two or more races(%)
Races - Two or more races(% change since 2000)
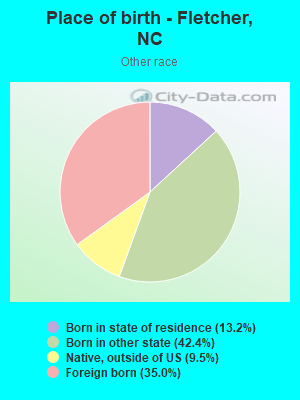
Races - Other race alone (%)
Races - Other race alone (% change since 2000)
Racial diversity
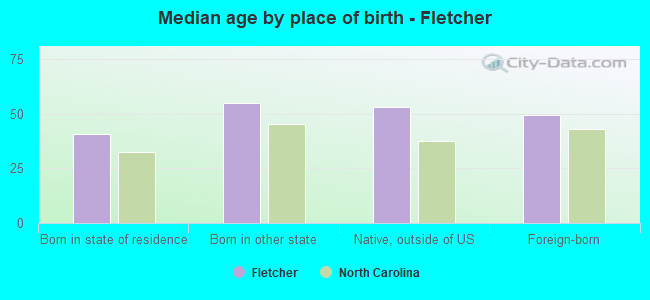
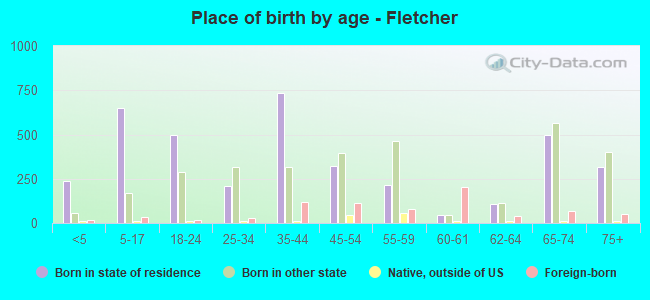
Place of birth - Born in state of residence (%)
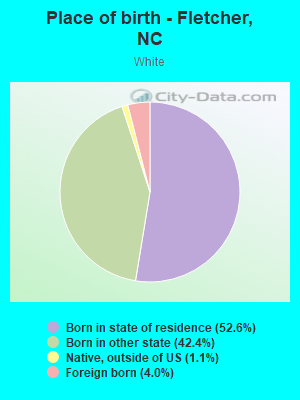
Place of birth - Born in state of residence (%) - White
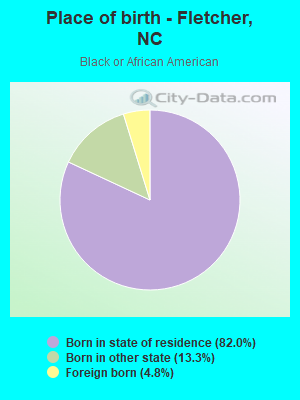
Place of birth - Born in state of residence (%) - Black or African American
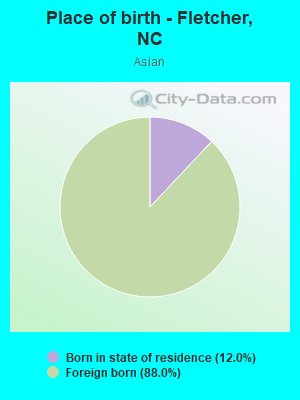
Place of birth - Born in state of residence (%) - Asian
Place of birth - Born in state of residence (%) - Hispanic or Latino
Place of birth - Born in state of residence (%) - American Indian and Alaska Native
Place of birth - Born in state of residence (%) - Multirace
Place of birth - Born in state of residence (%) - Other Race
Place of birth - Born in other state (%)
Place of birth - Born in other state (%) - White
Place of birth - Born in other state (%) - Black or African American
Place of birth - Born in other state (%) - Asian
Place of birth - Born in other state (%) - Hispanic or Latino
Place of birth - Born in other state (%) - American Indian and Alaska Native
Place of birth - Born in other state (%) - Multirace
Place of birth - Born in other state (%) - Other Race
Place of birth - Native, outside of US (%)
Place of birth - Native, outside of US (%) - White
Place of birth - Native, outside of US (%) - Black or African American
Place of birth - Native, outside of US (%) - Asian
Place of birth - Native, outside of US (%) - Hispanic or Latino
Place of birth - Native, outside of US (%) - American Indian and Alaska Native
Place of birth - Native, outside of US (%) - Multirace
Place of birth - Native, outside of US (%) - Other Race
Place of birth - Foreign born (%)
Place of birth - Foreign born (%) - White
Place of birth - Foreign born (%) - Black or African American
Place of birth - Foreign born (%) - Asian
Place of birth - Foreign born (%) - Hispanic or Latino
Place of birth - Foreign born (%) - American Indian and Alaska Native
Place of birth - Foreign born (%) - Multirace
Place of birth - Foreign born (%) - Other Race
Residents speaking English at home (%)
Residents speaking English at home - Born in the United States (%)
Residents speaking English at home - Native, born elsewhere (%)
Residents speaking English at home - Foreign born (%)
Residents speaking Spanish at home (%)
Residents speaking Spanish at home - Born in the United States (%)
Residents speaking Spanish at home - Native, born elsewhere (%)
Residents speaking Spanish at home - Foreign born (%)
Residents speaking other language at home (%)
Residents speaking other language at home - Born in the United States (%)
Residents speaking other language at home - Native, born elsewhere (%)
Residents speaking other language at home - Foreign born (%)
Marital status - Never married (%)
Marital status - Now married (%)
Marital status - Separated (%)
Marital status - Widowed (%)
Marital status - Divorced (%)
Ancestries Reported - Arab (%)
Ancestries Reported - Czech (%)
Ancestries Reported - Danish (%)
Ancestries Reported - Dutch (%)
Ancestries Reported - English (%)
Ancestries Reported - French (%)
Ancestries Reported - French Canadian (%)
Ancestries Reported - German (%)
Ancestries Reported - Greek (%)
Ancestries Reported - Hungarian (%)
Ancestries Reported - Irish (%)
Ancestries Reported - Italian (%)
Ancestries Reported - Lithuanian (%)
Ancestries Reported - Norwegian (%)
Ancestries Reported - Polish (%)
Ancestries Reported - Portuguese (%)
Ancestries Reported - Russian (%)
Ancestries Reported - Scotch-Irish (%)
Ancestries Reported - Scottish (%)
Ancestries Reported - Slovak (%)
Ancestries Reported - Subsaharan African (%)
Ancestries Reported - Swedish (%)
Ancestries Reported - Swiss (%)
Ancestries Reported - Ukrainian (%)
Ancestries Reported - United States (%)
Ancestries Reported - Welsh (%)
Ancestries Reported - West Indian (%)
Ancestries Reported - Other (%)
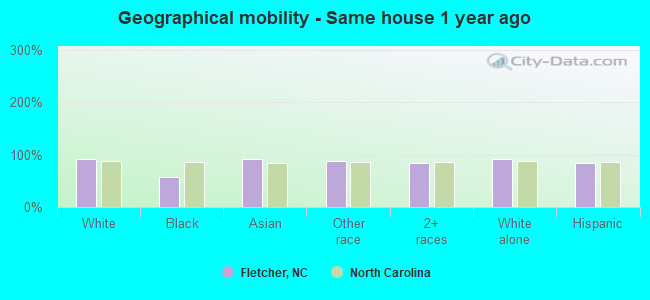
Geographical mobility - Same house 1 year ago (%)
Geographical mobility - Same house 1 year ago (%) - White
Geographical mobility - Same house 1 year ago (%) - Black or African American
Geographical mobility - Same house 1 year ago (%) - Asian
Geographical mobility - Same house 1 year ago (%) - Hispanic or Latino
Geographical mobility - Same house 1 year ago (%) - American Indian and Alaska Native
Geographical mobility - Same house 1 year ago (%) - Multirace
Geographical mobility - Same house 1 year ago (%) - Other Race
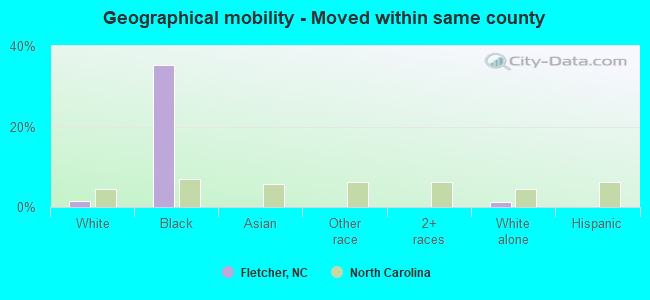
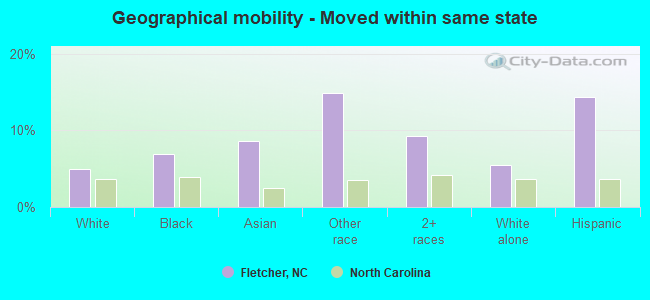
Geographical mobility - Moved within same county (%)
Geographical mobility - Moved within same county (%) - White
Geographical mobility - Moved within same county (%) - Black or African American
Geographical mobility - Moved within same county (%) - Asian
Geographical mobility - Moved within same county (%) - Hispanic or Latino
Geographical mobility - Moved within same county (%) - American Indian and Alaska Native
Geographical mobility - Moved within same county (%) - Multirace
Geographical mobility - Moved within same county (%) - Other Race
Geographical mobility - Moved from different county within same state (%)
Geographical mobility - Moved from different county within same state (%) - White
Geographical mobility - Moved from different county within same state (%) - Black or African American
Geographical mobility - Moved from different county within same state (%) - Asian
Geographical mobility - Moved from different county within same state (%) - Hispanic or Latino
Geographical mobility - Moved from different county within same state (%) - American Indian and Alaska Native
Geographical mobility - Moved from different county within same state (%) - Multirace
Geographical mobility - Moved from different county within same state (%) - Other Race
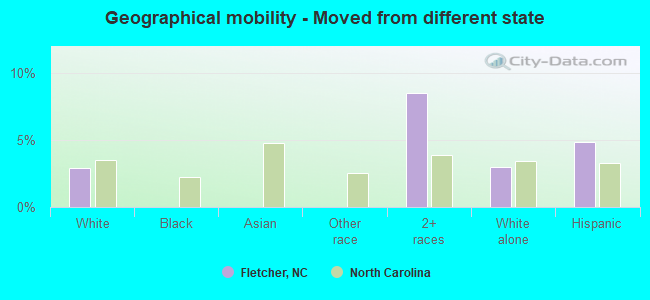
Geographical mobility - Moved from different state (%)
Geographical mobility - Moved from different state (%) - White
Geographical mobility - Moved from different state (%) - Black or African American
Geographical mobility - Moved from different state (%) - Asian
Geographical mobility - Moved from different state (%) - Hispanic or Latino
Geographical mobility - Moved from different state (%) - American Indian and Alaska Native
Geographical mobility - Moved from different state (%) - Multirace
Geographical mobility - Moved from different state (%) - Other Race
Geographical mobility - Moved from abroad (%)
Geographical mobility - Moved from abroad (%) - White
Geographical mobility - Moved from abroad (%) - Black or African American
Geographical mobility - Moved from abroad (%) - Asian
Geographical mobility - Moved from abroad (%) - Hispanic or Latino
Geographical mobility - Moved from abroad (%) - American Indian and Alaska Native
Geographical mobility - Moved from abroad (%) - Multirace
Geographical mobility - Moved from abroad (%) - Other Race
Place of birth for the foreign-born population - Ireland (%)
Place of birth for the foreign-born population - Denmark (%)
Place of birth for the foreign-born population - Norway (%)
Place of birth for the foreign-born population - Sweden (%)
Place of birth for the foreign-born population - United Kingdom (%)
Place of birth for the foreign-born population - England (%)
Place of birth for the foreign-born population - Scotland (%)
Place of birth for the foreign-born population - Other Northern Europe (%)
Place of birth for the foreign-born population - Austria (%)
Place of birth for the foreign-born population - Belgium (%)
Place of birth for the foreign-born population - France (%)
Place of birth for the foreign-born population - Germany (%)
Place of birth for the foreign-born population - Netherlands (%)
Place of birth for the foreign-born population - Switzerland (%)
Place of birth for the foreign-born population - Other Western Europe (%)
Place of birth for the foreign-born population - Greece (%)
Place of birth for the foreign-born population - Italy (%)
Place of birth for the foreign-born population - Portugal (%)
Place of birth for the foreign-born population - Spain (%)
Place of birth for the foreign-born population - Other Southern Europe (%)
Place of birth for the foreign-born population - Albania (%)
Place of birth for the foreign-born population - Belarus (%)
Place of birth for the foreign-born population - Bosnia and Herzegovina (%)
Place of birth for the foreign-born population - Bulgaria (%)
Place of birth for the foreign-born population - Croatia (%)
Place of birth for the foreign-born population - Czechoslovakia (%)
Place of birth for the foreign-born population - Hungary (%)
Place of birth for the foreign-born population - Latvia (%)
Place of birth for the foreign-born population - Lithuania (%)
Place of birth for the foreign-born population - North Macedonia (Macedonia) (%)
Place of birth for the foreign-born population - Moldova (%)
Place of birth for the foreign-born population - Poland (%)
Place of birth for the foreign-born population - Romania (%)
Place of birth for the foreign-born population - Russia (%)
Place of birth for the foreign-born population - Serbia (%)
Place of birth for the foreign-born population - Ukraine (%)
Place of birth for the foreign-born population - Other Eastern Europe (%)
Place of birth for the foreign-born population - China (%)
Place of birth for the foreign-born population - Hong Kong (%)
Place of birth for the foreign-born population - Taiwan (%)
Place of birth for the foreign-born population - Japan (%)
Place of birth for the foreign-born population - Korea (%)
Place of birth for the foreign-born population - Other Eastern Asia (%)
Place of birth for the foreign-born population - Afghanistan (%)
Place of birth for the foreign-born population - Bangladesh (%)
Place of birth for the foreign-born population - India (%)
Place of birth for the foreign-born population - Iran (%)
Place of birth for the foreign-born population - Kazakhstan (%)
Place of birth for the foreign-born population - Nepal (%)
Place of birth for the foreign-born population - Pakistan (%)
Place of birth for the foreign-born population - Sri Lanka (%)
Place of birth for the foreign-born population - Uzbekistan (%)
Place of birth for the foreign-born population - Other South Central Asia (%)
Place of birth for the foreign-born population - Burma (%)
Place of birth for the foreign-born population - Cambodia (%)
Place of birth for the foreign-born population - Indonesia (%)
Place of birth for the foreign-born population - Laos (%)
Place of birth for the foreign-born population - Malaysia (%)
Place of birth for the foreign-born population - Philippines (%)
Place of birth for the foreign-born population - Singapore (%)
Place of birth for the foreign-born population - Thailand (%)
Place of birth for the foreign-born population - Vietnam (%)
Place of birth for the foreign-born population - Other South Eastern Asia (%)
Place of birth for the foreign-born population - Armenia (%)
Place of birth for the foreign-born population - Iraq (%)
Place of birth for the foreign-born population - Israel (%)
Place of birth for the foreign-born population - Jordan (%)
Place of birth for the foreign-born population - Kuwait (%)
Place of birth for the foreign-born population - Lebanon (%)
Place of birth for the foreign-born population - Saudi Arabia (%)
Place of birth for the foreign-born population - Syria (%)
Place of birth for the foreign-born population - Turkey (%)
Place of birth for the foreign-born population - Yemen (%)
Place of birth for the foreign-born population - Other Western Asia (%)
Place of birth for the foreign-born population - Eritrea (%)
Place of birth for the foreign-born population - Ethiopia (%)
Place of birth for the foreign-born population - Kenya (%)
Place of birth for the foreign-born population - Somalia (%)
Place of birth for the foreign-born population - Uganda (%)
Place of birth for the foreign-born population - Zimbabwe (%)
Place of birth for the foreign-born population - Other Eastern Africa (%)
Place of birth for the foreign-born population - Cameroon (%)
Place of birth for the foreign-born population - Congo (%)
Place of birth for the foreign-born population - Democratic Republic of Congo (Zaire) (%)
Place of birth for the foreign-born population - Other Middle Africa (%)
Place of birth for the foreign-born population - Egypt (%)
Place of birth for the foreign-born population - Morocco (%)
Place of birth for the foreign-born population - Sudan (%)
Place of birth for the foreign-born population - Other Northern Africa (%)
Place of birth for the foreign-born population - South Africa (%)
Place of birth for the foreign-born population - Other Southern Africa (%)
Place of birth for the foreign-born population - Cabo Verde (%)
Place of birth for the foreign-born population - Ghana (%)
Place of birth for the foreign-born population - Liberia (%)
Place of birth for the foreign-born population - Nigeria (%)
Place of birth for the foreign-born population - Senegal (%)
Place of birth for the foreign-born population - Sierra Leone (%)
Place of birth for the foreign-born population - Other Western Africa (%)
Place of birth for the foreign-born population - Australia (%)
Place of birth for the foreign-born population - New Zealand (%)
Place of birth for the foreign-born population - Fiji (%)
Place of birth for the foreign-born population - Micronesia (%)
Place of birth for the foreign-born population - Bahamas (%)
Place of birth for the foreign-born population - Barbados (%)
Place of birth for the foreign-born population - Cuba (%)
Place of birth for the foreign-born population - Dominica (%)
Place of birth for the foreign-born population - Dominican Republic (%)
Place of birth for the foreign-born population - Grenada (%)
Place of birth for the foreign-born population - Haiti (%)
Place of birth for the foreign-born population - Jamaica (%)
Place of birth for the foreign-born population - St. Vincent and the Grenadines (%)
Place of birth for the foreign-born population - Trinidad and Tobago (%)
Place of birth for the foreign-born population - West Indies (%)
Place of birth for the foreign-born population - Other Caribbean (%)
Place of birth for the foreign-born population - Belize (%)
Place of birth for the foreign-born population - Costa Rica (%)
Place of birth for the foreign-born population - El Salvador (%)
Place of birth for the foreign-born population - Guatemala (%)
Place of birth for the foreign-born population - Honduras (%)
Place of birth for the foreign-born population - Mexico (%)
Place of birth for the foreign-born population - Nicaragua (%)
Place of birth for the foreign-born population - Panama (%)
Place of birth for the foreign-born population - Other Central America (%)
Place of birth for the foreign-born population - Argentina (%)
Place of birth for the foreign-born population - Bolivia (%)
Place of birth for the foreign-born population - Brazil (%)
Place of birth for the foreign-born population - Chile (%)
Place of birth for the foreign-born population - Colombia (%)
Place of birth for the foreign-born population - Ecuador (%)
Place of birth for the foreign-born population - Guyana (%)
Place of birth for the foreign-born population - Peru (%)
Place of birth for the foreign-born population - Uruguay (%)
Place of birth for the foreign-born population - Venezuela (%)
Place of birth for the foreign-born population - Other South America (%)
Place of birth for the foreign-born population - Canada (%)
Place of birth for the foreign-born population - Other Northern America (%)
Place of birth for the foreign-born population - Other (%)
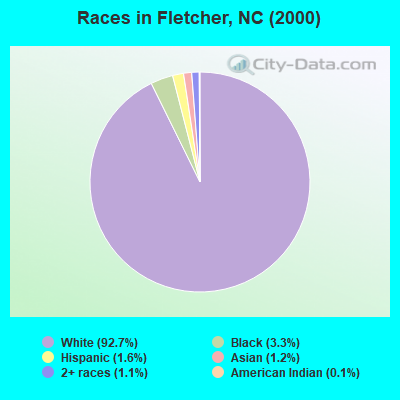
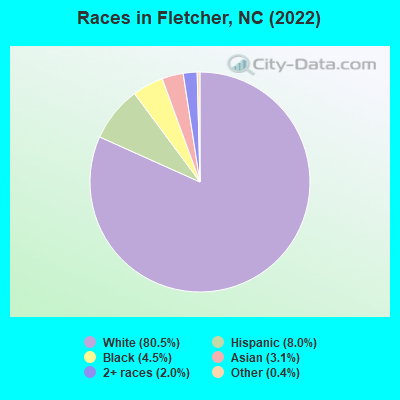
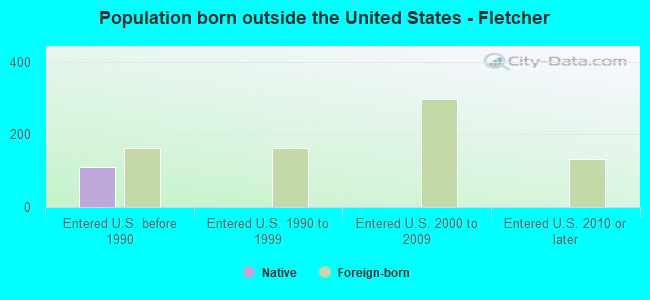
According to 2022 data, the most numerous races in Fletcher, NC are White alone (6,531 residents), Black alone (366 residents), and Hispanic (648 residents). 91.0% of Fletcher residents speak English at home. 9.3% of Fletcher, NC residents are foreign-born (3.9% born in Asia, 2.4% born in Europe, 1.5% born in Latin America), which is 13.9% greater than the foreign-born rate of 8.0% across the entire state of North Carolina.
Race distribution in Fletcher
2000 2022
5,647,155 70.2% White alone 1,723,301 21.4% Black alone 378,963 4.7% Hispanic 112,416 1.4% Asian alone 95,333 1.2% American Indian alone 79,965 1.0% Two or more races 9,015 0.1% Other race alone 3,165 0.04% Native Hawaiian and Other
6,497,519 60.7% White alone 2,155,650 20.1% Black alone 1,114,799 10.4% Hispanic 438,061 4.1% Two or more races 341,052 3.2% Asian alone 91,758 0.9% American Indian alone 50,180 0.5% Other race alone 9,954 0.09% Native Hawaiian and Other
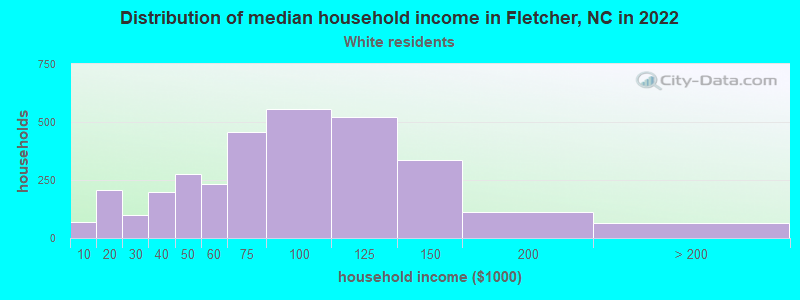
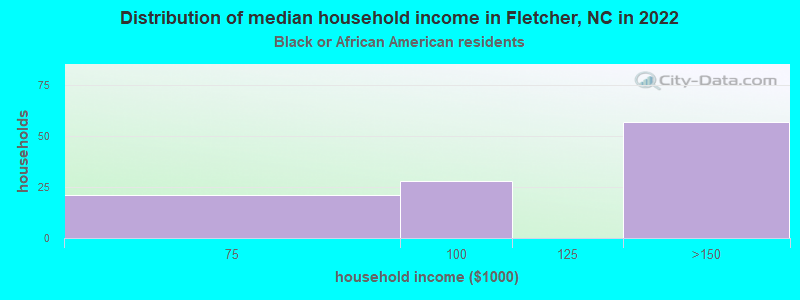
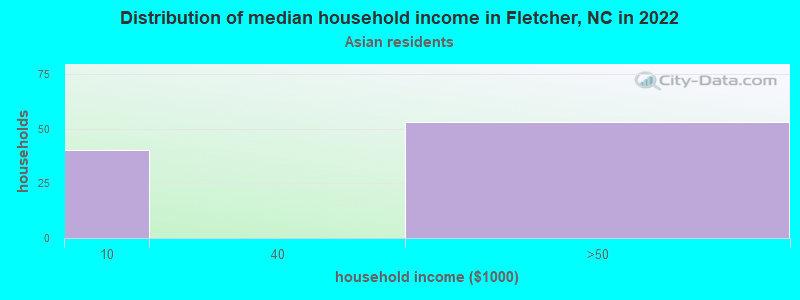
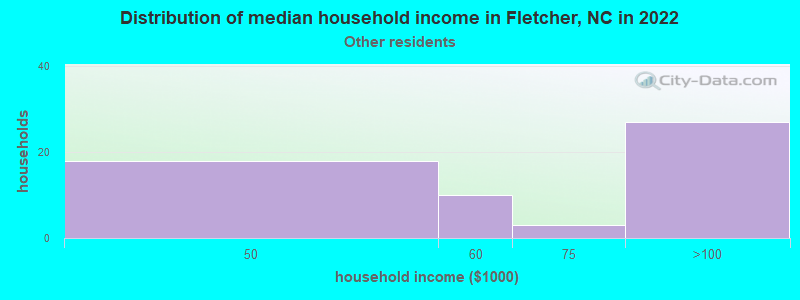
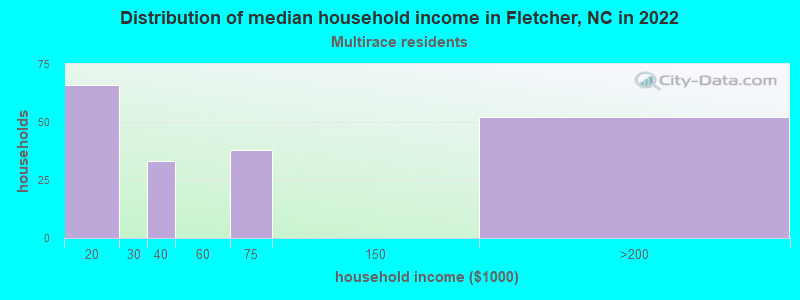
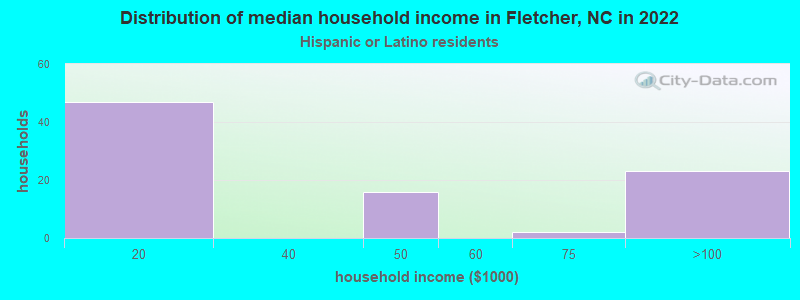
Income and house value in Fletcher Median household income in 2022 $73,122 White non-Hispanic householders$133,096 Black householders$52,292 Some other race householdersMedian 2022 house value $374,979 White Non-Hispanic householders$309,150 Black or African American householders $152,769 Asian householders$152,769 Some other race householders$263,874 Two or more races householders
Median age by race in Fletcher
49.5 Median age for White residents50.1 48.1 30.3 Median age for Black or African American residents46.0 12.7 -666,666,666.0 Median age for American Indian / Alaska Native residents-668,604,650.5 -682,971,013.8 59.9 Median age for Asian residents46.9 65.7 -743,471,581.4 Median age for Native Hawaiian / Pacific Islander residents-669,767,441.2 -666,666,666.0 33.4 Median age for Other race residents46.3 33.6 40.8 Median age for Two or more races residents32.7 82.9 49.4 Median age for White alone residents50.2 47.9 34.6 Median age for Hispanic or Latino residents34.9 30.3
Owner/renter occupied households by race in Fletcher
House owners and renters - White residents 2,504 78.3% Owner occupied693 21.7% Renter occupiedHouse owners and renters - Black or African American residents 67 100.0% Owner occupiedHouse owners and renters - Asian residents 92 100.0% Owner occupiedHouse owners and renters - Other race residents 58 100.0% Owner occupiedHouse owners and renters - Two or more races residents 81 54.2% Owner occupied69 45.8% Renter occupiedHouse owners and renters - White alone residents 2,541 78.3% Owner occupied704 21.7% Renter occupiedHouse owners and renters - Hispanic or Latino residents 44 42.1% Owner occupied61 57.9% Renter occupied
Language usage in Fletcher
English speakers - Total 91.0% of residents of Fletcher speak English at home.
4.2% of residents speak Spanish at home 221 68.0% Speak English very well104 32.0% Speak English less than very well5.7% of residents speak other language at home 16 3.6% Speak English very well426 96.4% Speak English less than very well
English speakers - Born in the United States 96.7% of residents of Fletcher speak English at home.
2.8% of residents speak Spanish at home 72 82.8% Speak English very well15 17.2% Speak English less than very well
English speakers - Native, born elsewhere 82.3% of residents of Fletcher speak English at home.
2.7% of residents speak Spanish at home 3 100.0% Speak English very well
English speakers - Foreign-born 42.5% of residents of Fletcher speak English at home.
16.6% of residents speak Spanish at home 62 47.7% Speak English very well68 52.3% Speak English less than very well49.1% of residents speak other language at home 15 3.9% Speak English very well370 96.1% Speak English less than very well
White (Caucasian) - Speak only English Native:
98.8% (5,870)Foreign-born:
71.2% (169)
White (Caucasian) - Speak another language Native:
1.3% (78)Foreign-born:
41.1% (98)
Black or African American - Speak only English Native:
97.9% (345)Foreign-born:
94.1% (17)
Asian - Speak only English Native:
83.4% (12)Foreign-born:
62.8% (144)
Other race - Speak another language Native:
15.1% (53)Foreign-born:
100.0% (124)
Two or more races - Speak another language Native:
31.0% (164)Foreign-born:
97.9% (13)
White alone - Speak only English Native:
98.8% (5,902)Foreign-born:
47.4% (170)
White alone - Speak another language Native:
1.1% (63)Foreign-born:
48.4% (174)
Hispanic or Latino - Speak only English Native:
80.1% (404)Foreign-born:
7.5% (8)
Hispanic or Latino - Speak another language Native:
27.7% (140)Foreign-born:
92.8% (100)
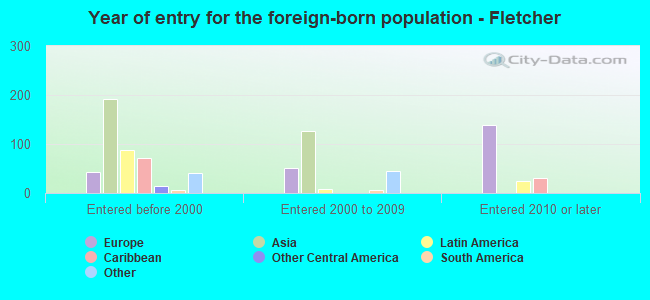
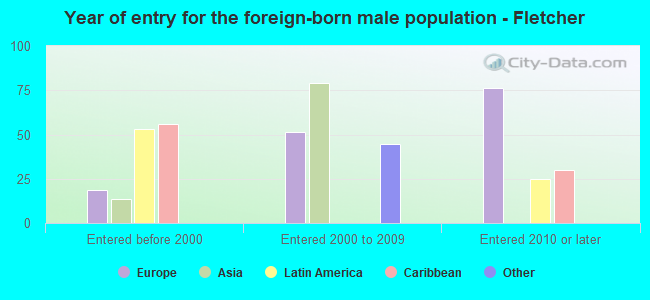
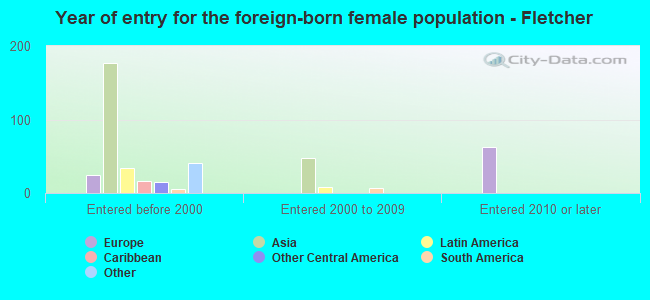
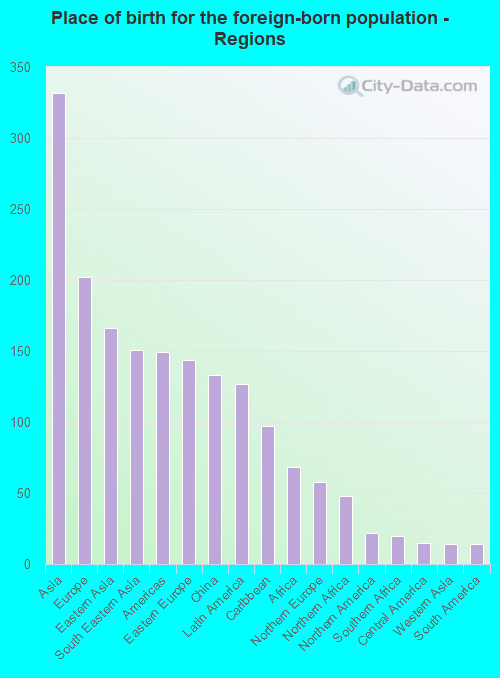
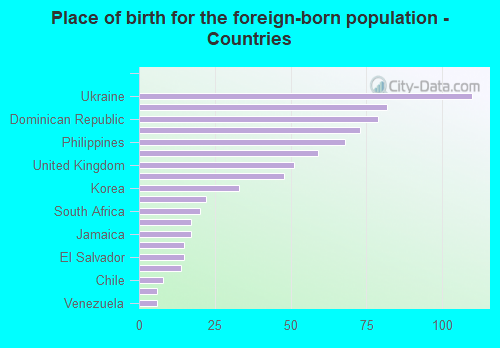
Foreign-born residents in Fletcher 754 residents are foreign born (3.9% Asia , 2.4% Europe , 1.5% Latin America ).
This city:
9.3%North Carolina:
8.3%
Marital status for residents in Fletcher Marital status - White (Caucasian) population 15 years and over
Males 20.1% Never married70.1% Now married0.1% Separated2.5% Widowed7.2% DivorcedFemales 18.1% Never married57.9% Now married1.4% Separated10.0% Widowed12.5% DivorcedWomen who gave birth in the past 12 months Now married:
100.0% (23)Unmarried:
0.0% (0)
Women who did not give birth in the past 12 months Now married:
67.3% (855)Unmarried:
32.7% (416)
Marital status - Black or African American population 15 years and over
Males 19.1% Never married68.8% Now married12.1% Separated0.0% Widowed0.0% DivorcedFemales 11.9% Never married82.2% Now married5.9% Separated0.0% Widowed0.0% DivorcedWomen who did not give birth in the past 12 months Now married:
70.0% (28)Unmarried:
30.0% (12)
Marital status - Asian population 15 years and over
Males 25.3% Never married74.7% Now married0.0% Separated0.0% Widowed0.0% DivorcedFemales 15.5% Never married64.3% Now married0.0% Separated20.3% Widowed0.0% DivorcedWomen who did not give birth in the past 12 months Now married:
47.5% (30)Unmarried:
52.5% (34)
Marital status - Other race population 15 years and over
Males 0.0% Never married51.8% Now married24.7% Separated0.0% Widowed23.5% DivorcedFemales 50.0% Never married44.2% Now married0.0% Separated0.0% Widowed5.8% DivorcedWomen who did not give birth in the past 12 months Now married:
10.3% (11)Unmarried:
89.7% (96)
Marital status - Two or more races population 15 years and over
Males 65.0% Never married35.0% Now married0.0% Separated0.0% Widowed0.0% DivorcedFemales 19.9% Never married47.0% Now married18.7% Separated0.0% Widowed14.5% DivorcedWomen who did not give birth in the past 12 months Now married:
19.7% (19)Unmarried:
80.3% (78)
Marital status - White alone, not Hispanic / Latino population 15 years and over
Males 19.5% Never married70.5% Now married0.1% Separated2.5% Widowed7.3% DivorcedFemales 18.1% Never married58.0% Now married1.4% Separated9.9% Widowed12.5% DivorcedWomen who gave birth in the past 12 months Now married:
100.0% (24)Unmarried:
0.0% (0)
Women who did not give birth in the past 12 months Now married:
67.3% (891)Unmarried:
32.7% (433)
Marital status - Hispanic or Latino population 15 years and over
Males 43.4% Never married38.5% Now married9.3% Separated0.0% Widowed8.8% DivorcedFemales 47.8% Never married48.7% Now married0.0% Separated2.6% Widowed0.9% DivorcedWomen who did not give birth in the past 12 months Now married:
7.7% (9)Unmarried:
92.3% (104)
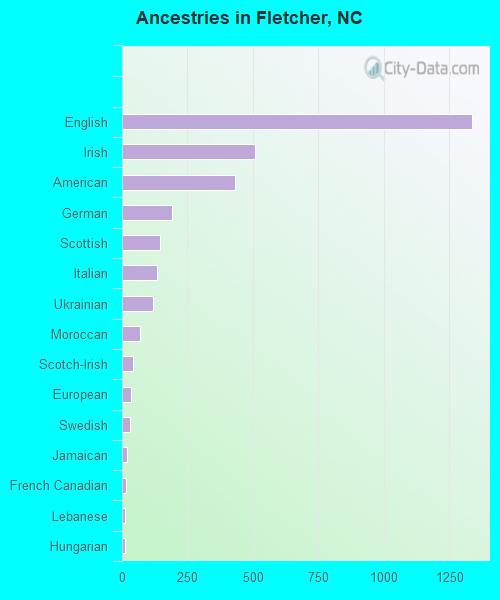
Ancestries in Fletcher
1,335 34.1% English507 13.0% Irish432 11.0% American192 4.9% German146 3.7% Scottish132 3.4% Italian119 3.0% Ukrainian68 1.7% Moroccan43 1.1% Scotch-Irish36 0.9% European31 0.8% Swedish19 0.5% Jamaican16 0.4% French Canadian13 0.3% Lebanese13 0.3% Hungarian12 0.3% Canadian12 0.3% Macedonian11 0.3% Northern European5 0.1% Russian
Children Nativity (place of birth) in Fletcher
Children under 6 years - Living with two parents Both parents native 265 100.0% Native0 0.0% Foreign-bornBoth parents foreign-born 17 100.0% Foreign-bornOne native, one foreign-born parent 61 100.0% NativeChildren under 6 years - Living with one parent Foreign-born parent 16 100.0% NativeChildren 6 to 17 years - Living with two parents Both parents native 493 100.0% NativeBoth parents foreign-born 20 22.7% Native66 77.3% Foreign-bornOne native, one foreign-born parent 32 100.0% NativeChildren 6 to 17 years - Living with one parent Native parent 158 100.0% Native