Races in Flint, Michigan (MI) Detailed Stats
Data:
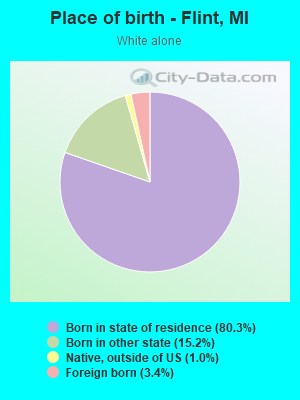
Races - White alone (%)
Races - White alone (% change since 2000)
Races - Black alone (%)
Races - Black alone (% change since 2000)
Races - American Indian alone (%)
Races - American Indian alone (% change since 2000)
Races - Asian alone (%)
Races - Asian alone (% change since 2000)
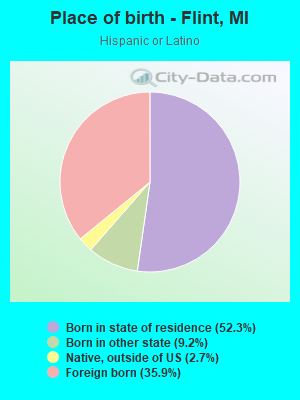
Races - Hispanic (%)
Races - Hispanic (% change since 2000)
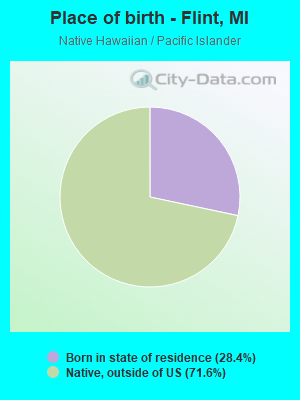
Races - Native Hawaiian and Other Pacific Islander alone (%)
Races - Native Hawaiian and Other Pacific Islander alone (% change since 2000)
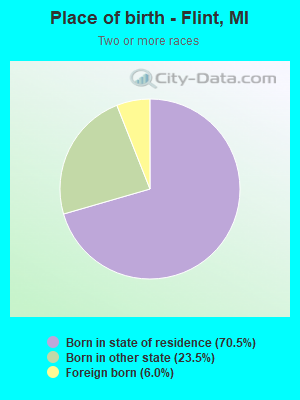
Races - Two or more races(%)
Races - Two or more races(% change since 2000)
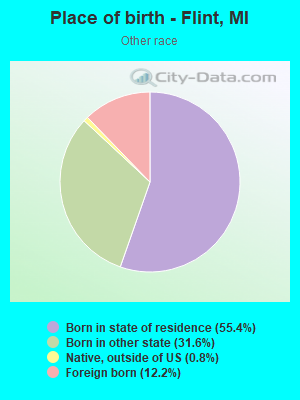
Races - Other race alone (%)
Races - Other race alone (% change since 2000)
Racial diversity
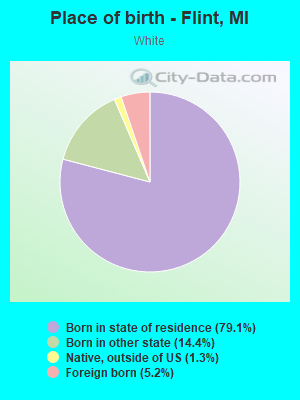
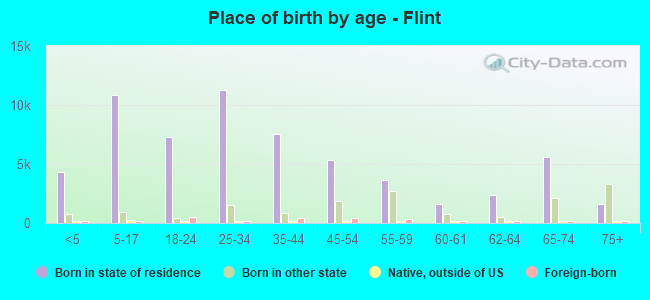
Place of birth - Born in state of residence (%)
Place of birth - Born in state of residence (%) - White
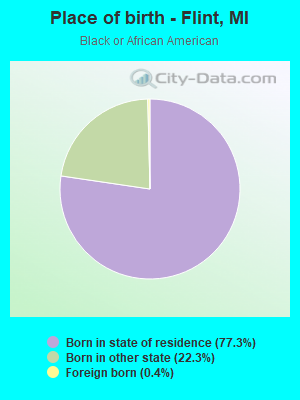
Place of birth - Born in state of residence (%) - Black or African American
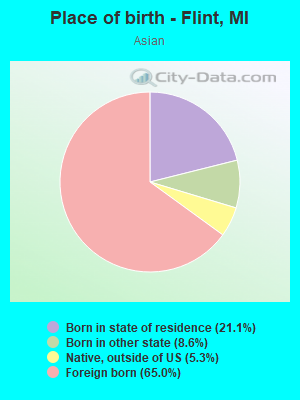
Place of birth - Born in state of residence (%) - Asian
Place of birth - Born in state of residence (%) - Hispanic or Latino
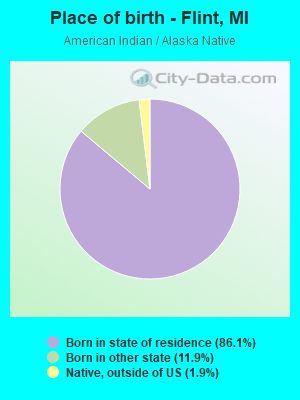
Place of birth - Born in state of residence (%) - American Indian and Alaska Native
Place of birth - Born in state of residence (%) - Multirace
Place of birth - Born in state of residence (%) - Other Race
Place of birth - Born in other state (%)
Place of birth - Born in other state (%) - White
Place of birth - Born in other state (%) - Black or African American
Place of birth - Born in other state (%) - Asian
Place of birth - Born in other state (%) - Hispanic or Latino
Place of birth - Born in other state (%) - American Indian and Alaska Native
Place of birth - Born in other state (%) - Multirace
Place of birth - Born in other state (%) - Other Race
Place of birth - Native, outside of US (%)
Place of birth - Native, outside of US (%) - White
Place of birth - Native, outside of US (%) - Black or African American
Place of birth - Native, outside of US (%) - Asian
Place of birth - Native, outside of US (%) - Hispanic or Latino
Place of birth - Native, outside of US (%) - American Indian and Alaska Native
Place of birth - Native, outside of US (%) - Multirace
Place of birth - Native, outside of US (%) - Other Race
Place of birth - Foreign born (%)
Place of birth - Foreign born (%) - White
Place of birth - Foreign born (%) - Black or African American
Place of birth - Foreign born (%) - Asian
Place of birth - Foreign born (%) - Hispanic or Latino
Place of birth - Foreign born (%) - American Indian and Alaska Native
Place of birth - Foreign born (%) - Multirace
Place of birth - Foreign born (%) - Other Race
Residents speaking English at home (%)
Residents speaking English at home - Born in the United States (%)
Residents speaking English at home - Native, born elsewhere (%)
Residents speaking English at home - Foreign born (%)
Residents speaking Spanish at home (%)
Residents speaking Spanish at home - Born in the United States (%)
Residents speaking Spanish at home - Native, born elsewhere (%)
Residents speaking Spanish at home - Foreign born (%)
Residents speaking other language at home (%)
Residents speaking other language at home - Born in the United States (%)
Residents speaking other language at home - Native, born elsewhere (%)
Residents speaking other language at home - Foreign born (%)
Marital status - Never married (%)
Marital status - Now married (%)
Marital status - Separated (%)
Marital status - Widowed (%)
Marital status - Divorced (%)
Ancestries Reported - Arab (%)
Ancestries Reported - Czech (%)
Ancestries Reported - Danish (%)
Ancestries Reported - Dutch (%)
Ancestries Reported - English (%)
Ancestries Reported - French (%)
Ancestries Reported - French Canadian (%)
Ancestries Reported - German (%)
Ancestries Reported - Greek (%)
Ancestries Reported - Hungarian (%)
Ancestries Reported - Irish (%)
Ancestries Reported - Italian (%)
Ancestries Reported - Lithuanian (%)
Ancestries Reported - Norwegian (%)
Ancestries Reported - Polish (%)
Ancestries Reported - Portuguese (%)
Ancestries Reported - Russian (%)
Ancestries Reported - Scotch-Irish (%)
Ancestries Reported - Scottish (%)
Ancestries Reported - Slovak (%)
Ancestries Reported - Subsaharan African (%)
Ancestries Reported - Swedish (%)
Ancestries Reported - Swiss (%)
Ancestries Reported - Ukrainian (%)
Ancestries Reported - United States (%)
Ancestries Reported - Welsh (%)
Ancestries Reported - West Indian (%)
Ancestries Reported - Other (%)
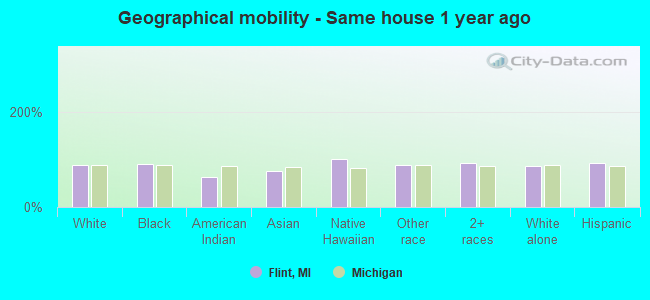
Geographical mobility - Same house 1 year ago (%)
Geographical mobility - Same house 1 year ago (%) - White
Geographical mobility - Same house 1 year ago (%) - Black or African American
Geographical mobility - Same house 1 year ago (%) - Asian
Geographical mobility - Same house 1 year ago (%) - Hispanic or Latino
Geographical mobility - Same house 1 year ago (%) - American Indian and Alaska Native
Geographical mobility - Same house 1 year ago (%) - Multirace
Geographical mobility - Same house 1 year ago (%) - Other Race
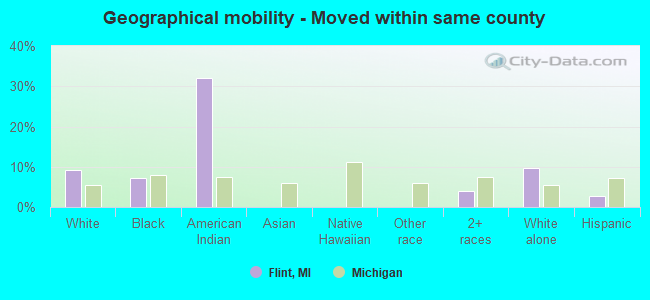
Geographical mobility - Moved within same county (%)
Geographical mobility - Moved within same county (%) - White
Geographical mobility - Moved within same county (%) - Black or African American
Geographical mobility - Moved within same county (%) - Asian
Geographical mobility - Moved within same county (%) - Hispanic or Latino
Geographical mobility - Moved within same county (%) - American Indian and Alaska Native
Geographical mobility - Moved within same county (%) - Multirace
Geographical mobility - Moved within same county (%) - Other Race
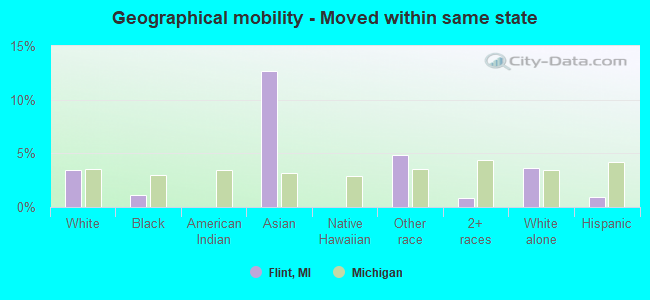
Geographical mobility - Moved from different county within same state (%)
Geographical mobility - Moved from different county within same state (%) - White
Geographical mobility - Moved from different county within same state (%) - Black or African American
Geographical mobility - Moved from different county within same state (%) - Asian
Geographical mobility - Moved from different county within same state (%) - Hispanic or Latino
Geographical mobility - Moved from different county within same state (%) - American Indian and Alaska Native
Geographical mobility - Moved from different county within same state (%) - Multirace
Geographical mobility - Moved from different county within same state (%) - Other Race
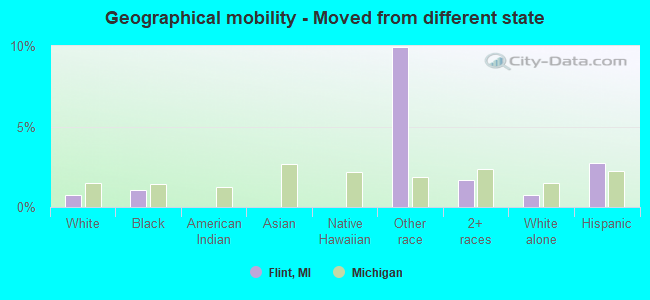
Geographical mobility - Moved from different state (%)
Geographical mobility - Moved from different state (%) - White
Geographical mobility - Moved from different state (%) - Black or African American
Geographical mobility - Moved from different state (%) - Asian
Geographical mobility - Moved from different state (%) - Hispanic or Latino
Geographical mobility - Moved from different state (%) - American Indian and Alaska Native
Geographical mobility - Moved from different state (%) - Multirace
Geographical mobility - Moved from different state (%) - Other Race
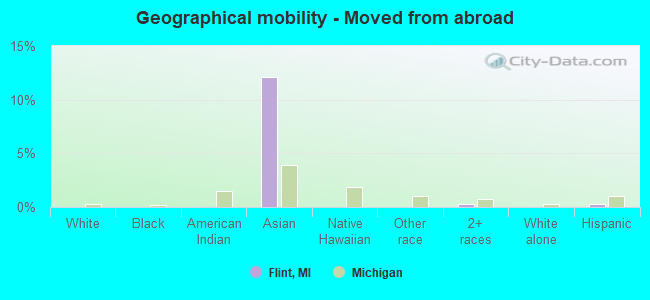
Geographical mobility - Moved from abroad (%)
Geographical mobility - Moved from abroad (%) - White
Geographical mobility - Moved from abroad (%) - Black or African American
Geographical mobility - Moved from abroad (%) - Asian
Geographical mobility - Moved from abroad (%) - Hispanic or Latino
Geographical mobility - Moved from abroad (%) - American Indian and Alaska Native
Geographical mobility - Moved from abroad (%) - Multirace
Geographical mobility - Moved from abroad (%) - Other Race
Place of birth for the foreign-born population - Ireland (%)
Place of birth for the foreign-born population - Denmark (%)
Place of birth for the foreign-born population - Norway (%)
Place of birth for the foreign-born population - Sweden (%)
Place of birth for the foreign-born population - United Kingdom (%)
Place of birth for the foreign-born population - England (%)
Place of birth for the foreign-born population - Scotland (%)
Place of birth for the foreign-born population - Other Northern Europe (%)
Place of birth for the foreign-born population - Austria (%)
Place of birth for the foreign-born population - Belgium (%)
Place of birth for the foreign-born population - France (%)
Place of birth for the foreign-born population - Germany (%)
Place of birth for the foreign-born population - Netherlands (%)
Place of birth for the foreign-born population - Switzerland (%)
Place of birth for the foreign-born population - Other Western Europe (%)
Place of birth for the foreign-born population - Greece (%)
Place of birth for the foreign-born population - Italy (%)
Place of birth for the foreign-born population - Portugal (%)
Place of birth for the foreign-born population - Spain (%)
Place of birth for the foreign-born population - Other Southern Europe (%)
Place of birth for the foreign-born population - Albania (%)
Place of birth for the foreign-born population - Belarus (%)
Place of birth for the foreign-born population - Bosnia and Herzegovina (%)
Place of birth for the foreign-born population - Bulgaria (%)
Place of birth for the foreign-born population - Croatia (%)
Place of birth for the foreign-born population - Czechoslovakia (%)
Place of birth for the foreign-born population - Hungary (%)
Place of birth for the foreign-born population - Latvia (%)
Place of birth for the foreign-born population - Lithuania (%)
Place of birth for the foreign-born population - North Macedonia (Macedonia) (%)
Place of birth for the foreign-born population - Moldova (%)
Place of birth for the foreign-born population - Poland (%)
Place of birth for the foreign-born population - Romania (%)
Place of birth for the foreign-born population - Russia (%)
Place of birth for the foreign-born population - Serbia (%)
Place of birth for the foreign-born population - Ukraine (%)
Place of birth for the foreign-born population - Other Eastern Europe (%)
Place of birth for the foreign-born population - China (%)
Place of birth for the foreign-born population - Hong Kong (%)
Place of birth for the foreign-born population - Taiwan (%)
Place of birth for the foreign-born population - Japan (%)
Place of birth for the foreign-born population - Korea (%)
Place of birth for the foreign-born population - Other Eastern Asia (%)
Place of birth for the foreign-born population - Afghanistan (%)
Place of birth for the foreign-born population - Bangladesh (%)
Place of birth for the foreign-born population - India (%)
Place of birth for the foreign-born population - Iran (%)
Place of birth for the foreign-born population - Kazakhstan (%)
Place of birth for the foreign-born population - Nepal (%)
Place of birth for the foreign-born population - Pakistan (%)
Place of birth for the foreign-born population - Sri Lanka (%)
Place of birth for the foreign-born population - Uzbekistan (%)
Place of birth for the foreign-born population - Other South Central Asia (%)
Place of birth for the foreign-born population - Burma (%)
Place of birth for the foreign-born population - Cambodia (%)
Place of birth for the foreign-born population - Indonesia (%)
Place of birth for the foreign-born population - Laos (%)
Place of birth for the foreign-born population - Malaysia (%)
Place of birth for the foreign-born population - Philippines (%)
Place of birth for the foreign-born population - Singapore (%)
Place of birth for the foreign-born population - Thailand (%)
Place of birth for the foreign-born population - Vietnam (%)
Place of birth for the foreign-born population - Other South Eastern Asia (%)
Place of birth for the foreign-born population - Armenia (%)
Place of birth for the foreign-born population - Iraq (%)
Place of birth for the foreign-born population - Israel (%)
Place of birth for the foreign-born population - Jordan (%)
Place of birth for the foreign-born population - Kuwait (%)
Place of birth for the foreign-born population - Lebanon (%)
Place of birth for the foreign-born population - Saudi Arabia (%)
Place of birth for the foreign-born population - Syria (%)
Place of birth for the foreign-born population - Turkey (%)
Place of birth for the foreign-born population - Yemen (%)
Place of birth for the foreign-born population - Other Western Asia (%)
Place of birth for the foreign-born population - Eritrea (%)
Place of birth for the foreign-born population - Ethiopia (%)
Place of birth for the foreign-born population - Kenya (%)
Place of birth for the foreign-born population - Somalia (%)
Place of birth for the foreign-born population - Uganda (%)
Place of birth for the foreign-born population - Zimbabwe (%)
Place of birth for the foreign-born population - Other Eastern Africa (%)
Place of birth for the foreign-born population - Cameroon (%)
Place of birth for the foreign-born population - Congo (%)
Place of birth for the foreign-born population - Democratic Republic of Congo (Zaire) (%)
Place of birth for the foreign-born population - Other Middle Africa (%)
Place of birth for the foreign-born population - Egypt (%)
Place of birth for the foreign-born population - Morocco (%)
Place of birth for the foreign-born population - Sudan (%)
Place of birth for the foreign-born population - Other Northern Africa (%)
Place of birth for the foreign-born population - South Africa (%)
Place of birth for the foreign-born population - Other Southern Africa (%)
Place of birth for the foreign-born population - Cabo Verde (%)
Place of birth for the foreign-born population - Ghana (%)
Place of birth for the foreign-born population - Liberia (%)
Place of birth for the foreign-born population - Nigeria (%)
Place of birth for the foreign-born population - Senegal (%)
Place of birth for the foreign-born population - Sierra Leone (%)
Place of birth for the foreign-born population - Other Western Africa (%)
Place of birth for the foreign-born population - Australia (%)
Place of birth for the foreign-born population - New Zealand (%)
Place of birth for the foreign-born population - Fiji (%)
Place of birth for the foreign-born population - Micronesia (%)
Place of birth for the foreign-born population - Bahamas (%)
Place of birth for the foreign-born population - Barbados (%)
Place of birth for the foreign-born population - Cuba (%)
Place of birth for the foreign-born population - Dominica (%)
Place of birth for the foreign-born population - Dominican Republic (%)
Place of birth for the foreign-born population - Grenada (%)
Place of birth for the foreign-born population - Haiti (%)
Place of birth for the foreign-born population - Jamaica (%)
Place of birth for the foreign-born population - St. Vincent and the Grenadines (%)
Place of birth for the foreign-born population - Trinidad and Tobago (%)
Place of birth for the foreign-born population - West Indies (%)
Place of birth for the foreign-born population - Other Caribbean (%)
Place of birth for the foreign-born population - Belize (%)
Place of birth for the foreign-born population - Costa Rica (%)
Place of birth for the foreign-born population - El Salvador (%)
Place of birth for the foreign-born population - Guatemala (%)
Place of birth for the foreign-born population - Honduras (%)
Place of birth for the foreign-born population - Mexico (%)
Place of birth for the foreign-born population - Nicaragua (%)
Place of birth for the foreign-born population - Panama (%)
Place of birth for the foreign-born population - Other Central America (%)
Place of birth for the foreign-born population - Argentina (%)
Place of birth for the foreign-born population - Bolivia (%)
Place of birth for the foreign-born population - Brazil (%)
Place of birth for the foreign-born population - Chile (%)
Place of birth for the foreign-born population - Colombia (%)
Place of birth for the foreign-born population - Ecuador (%)
Place of birth for the foreign-born population - Guyana (%)
Place of birth for the foreign-born population - Peru (%)
Place of birth for the foreign-born population - Uruguay (%)
Place of birth for the foreign-born population - Venezuela (%)
Place of birth for the foreign-born population - Other South America (%)
Place of birth for the foreign-born population - Canada (%)
Place of birth for the foreign-born population - Other Northern America (%)
Place of birth for the foreign-born population - Other (%)
Latest news about races in Flint, MI collected exclusively by city-data.com from local newspapers, TV, and radio stations
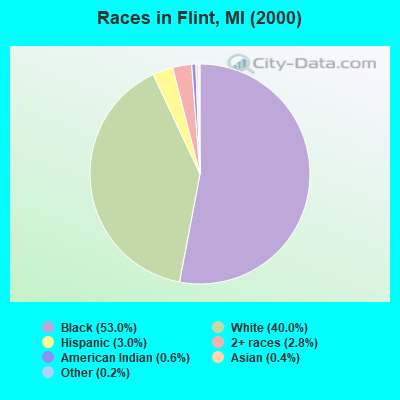
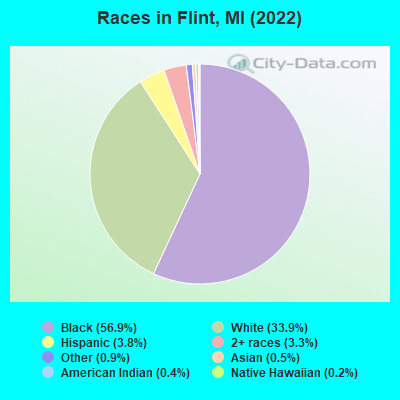
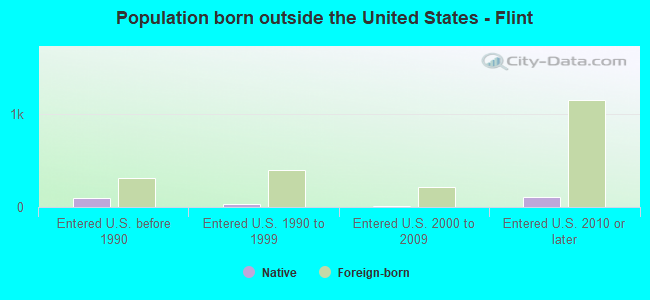
According to 2022 data, the most numerous races in Flint, MI are White alone (27,107 residents), Black alone (45,463 residents), and Hispanic (3,063 residents). 96.6% of Flint residents speak English at home. 2.5% of Flint, MI residents are foreign-born (1.0% born in Asia, 1.0% born in Latin America), which is 136.2% less than the foreign-born rate of 6.0% across the entire state of Michigan.
Race distribution in Flint
2000 2022
7,806,691 78.6% White alone 1,402,047 14.1% Black alone 323,877 3.3% Hispanic 175,311 1.8% Asian alone 163,487 1.6% Two or more races 53,421 0.5% American Indian alone 11,465 0.1% Other race alone 2,145 0.02% Native Hawaiian and Other
7,289,051 72.6% White alone 1,310,464 13.1% Black alone 572,405 5.7% Hispanic 450,031 4.5% Two or more races 335,732 3.3% Asian alone 45,217 0.5% Other race alone 29,011 0.3% American Indian alone 2,207 0.02% Native Hawaiian and Other
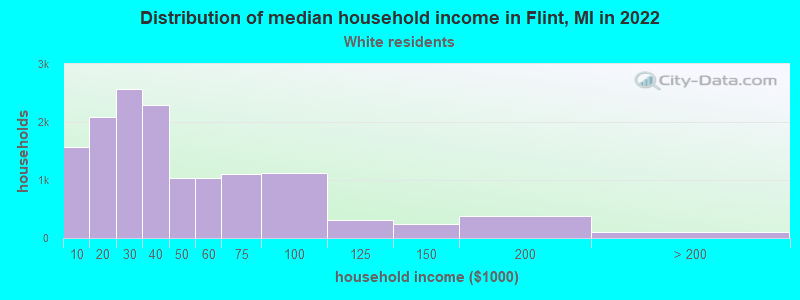
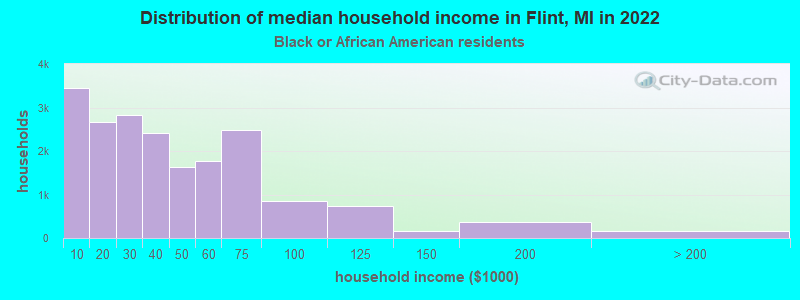
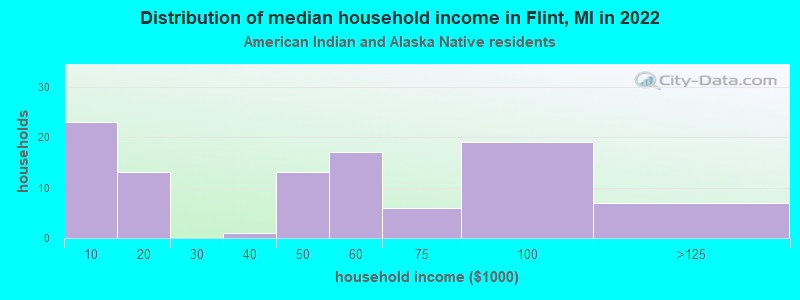
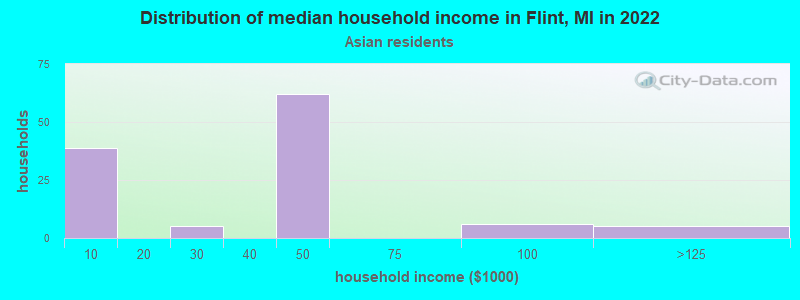
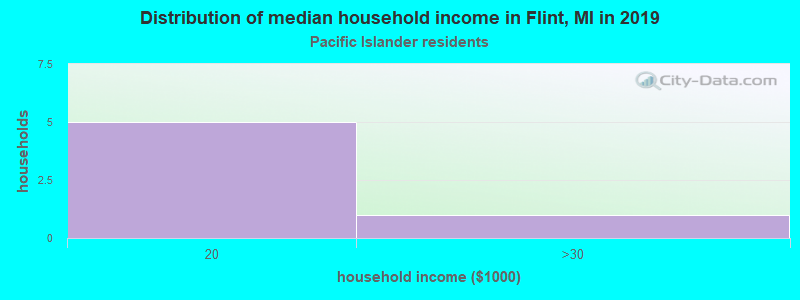
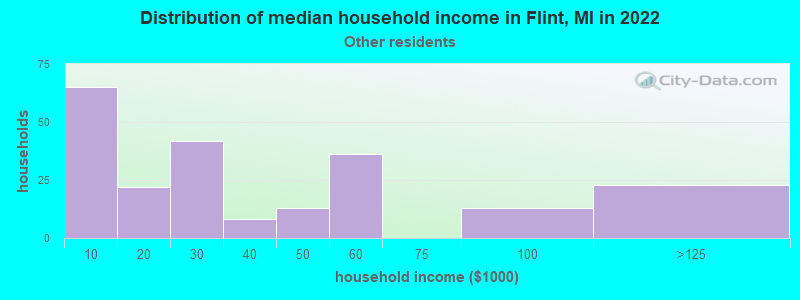
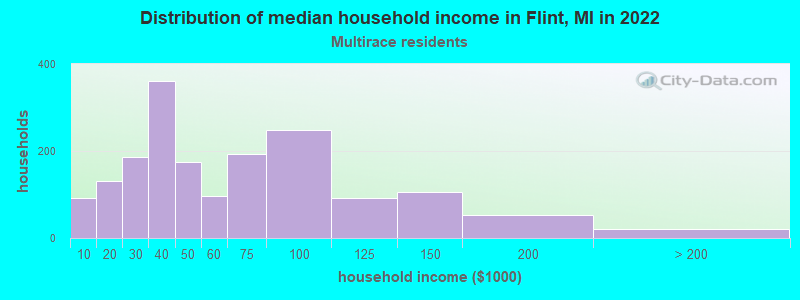
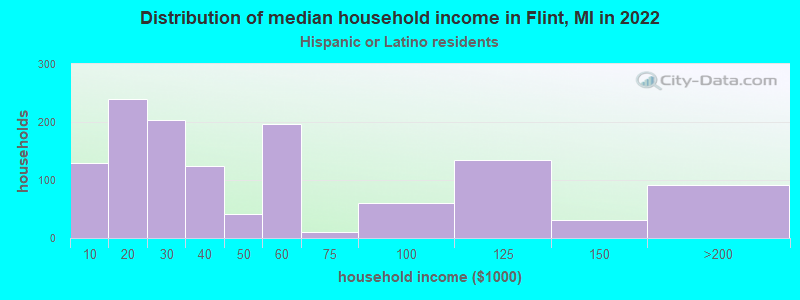
Income and house value in Flint Median household income in 2022 $32,252 White non-Hispanic householders$33,526 Black householders$2,499 Asian householders$51,844 Two or more races householders$28,368 Hispanic or Latino race householdersMedian 2022 house value $52,964 White Non-Hispanic householders$45,823 Black or African American householders$48,104 American Indian or Alaska Native householders $91,944 Asian householders$81,232 Native Hawaiian and other Pacific Islander householders$38,979 Some other race householders$48,005 Two or more races householders$46,220 Hispanic or Latino householders
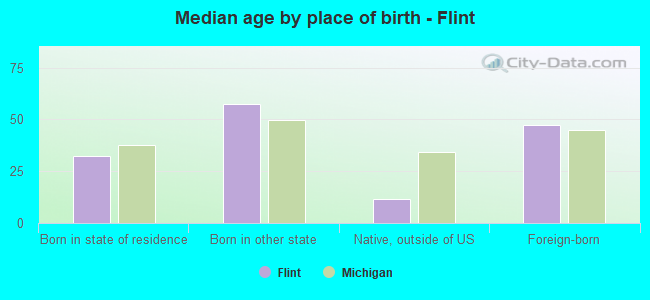
Median age by race in Flint
43.1 Median age for White residents43.4 41.9 33.6 Median age for Black or African American residents32.9 36.1 16.0 Median age for American Indian / Alaska Native residents10.7 -666,666,666.0 26.8 Median age for Asian residents26.5 47.0 -666,666,666.0 Median age for Native Hawaiian / Pacific Islander residents-666,666,666.0 -666,666,666.0 27.0 Median age for Other race residents12.2 30.1 25.7 Median age for Two or more races residents29.8 21.2 43.0 Median age for White alone residents43.6 41.6 31.8 Median age for Hispanic or Latino residents33.6 30.8
Owner/renter occupied households by race in Flint
House owners and renters - White residents 9,400 68.1% Owner occupied4,413 31.9% Renter occupiedHouse owners and renters - Black or African American residents 8,547 43.7% Owner occupied10,990 56.3% Renter occupiedHouse owners and renters - American Indian / Alaska Native residents 52 50.1% Owner occupied52 49.9% Renter occupiedHouse owners and renters - Asian residents 62 44.0% Owner occupied78 56.0% Renter occupiedHouse owners and renters - Native Hawaiian / Pacific Islander residents 11 100.0% Owner occupiedHouse owners and renters - Other race residents 128 34.4% Owner occupied244 65.6% Renter occupiedHouse owners and renters - Two or more races residents 650 65.1% Owner occupied349 34.9% Renter occupiedHouse owners and renters - White alone residents 8,911 68.5% Owner occupied4,098 31.5% Renter occupiedHouse owners and renters - Hispanic or Latino residents 873 59.8% Owner occupied588 40.2% Renter occupied
Language usage in Flint
English speakers - Total 96.6% of residents of Flint speak English at home.
1.6% of residents speak Spanish at home 612 50.4% Speak English very well603 49.6% Speak English less than very well1.8% of residents speak other language at home 871 62.5% Speak English very well522 37.5% Speak English less than very well
English speakers - Born in the United States 97.9% of residents of Flint speak English at home.
1.3% of residents speak Spanish at home 148 78.7% Speak English very well40 21.3% Speak English less than very well0.8% of residents speak other language at home 71 64.5% Speak English very well39 35.5% Speak English less than very well
English speakers - Native, born elsewhere 64.9% of residents of Flint speak English at home.
12.7% of residents speak Spanish at home 22 66.7% Speak English very well11 33.3% Speak English less than very well23.2% of residents speak other language at home 60 100.0% Speak English very well
English speakers - Foreign-born 22.2% of residents of Flint speak English at home.
36.7% of residents speak Spanish at home 104 14.5% Speak English very well612 85.5% Speak English less than very well47.6% of residents speak other language at home 426 45.9% Speak English very well503 54.1% Speak English less than very well
White (Caucasian) - Speak only English Native:
98.4% (25,754)Foreign-born:
7.1% (63)
White (Caucasian) - Speak another language Native:
1.5% (403)Foreign-born:
100.0% (888)
Black or African American - Speak only English Native:
99.7% (41,259)Foreign-born:
60.2% (290)
Black or African American - Speak another language Native:
0.5% (191)Foreign-born:
36.5% (176)
Asian - Speak only English Native:
15.2% (21)Foreign-born:
26.7% (104)
Asian - Speak another language Native:
63.7% (89)Foreign-born:
73.6% (288)
Other race - Speak only English Native:
72.4% (493)Foreign-born:
6.1% (11)
Other race - Speak another language Native:
29.3% (200)Foreign-born:
94.8% (174)
Two or more races - Speak only English Native:
92.1% (4,414)Foreign-born:
8.8% (11)
Two or more races - Speak another language Native:
8.1% (387)Foreign-born:
85.0% (103)
White alone - Speak only English Native:
98.6% (24,890)Foreign-born:
9.6% (60)
White alone - Speak another language Native:
1.4% (352)Foreign-born:
100.0% (632)
Hispanic or Latino - Speak only English Native:
79.4% (1,342)Foreign-born:
12.7% (140)
Hispanic or Latino - Speak another language Native:
20.6% (349)Foreign-born:
87.3% (959)
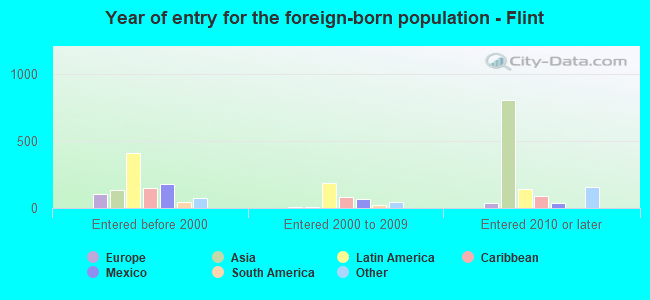
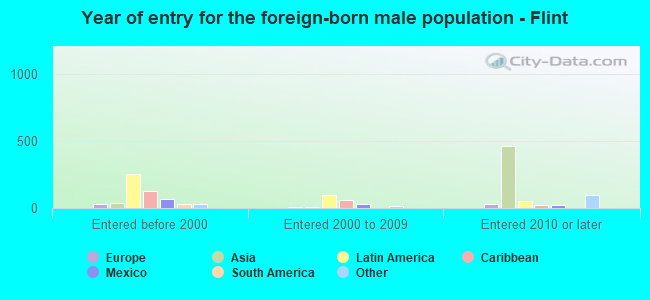
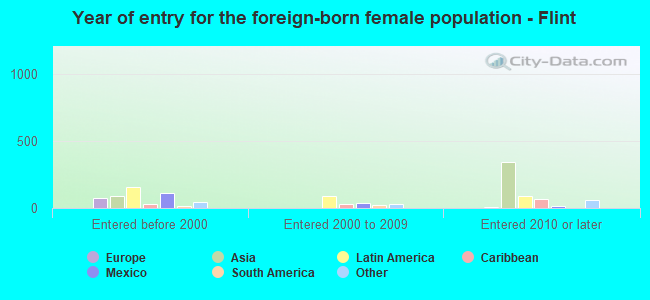
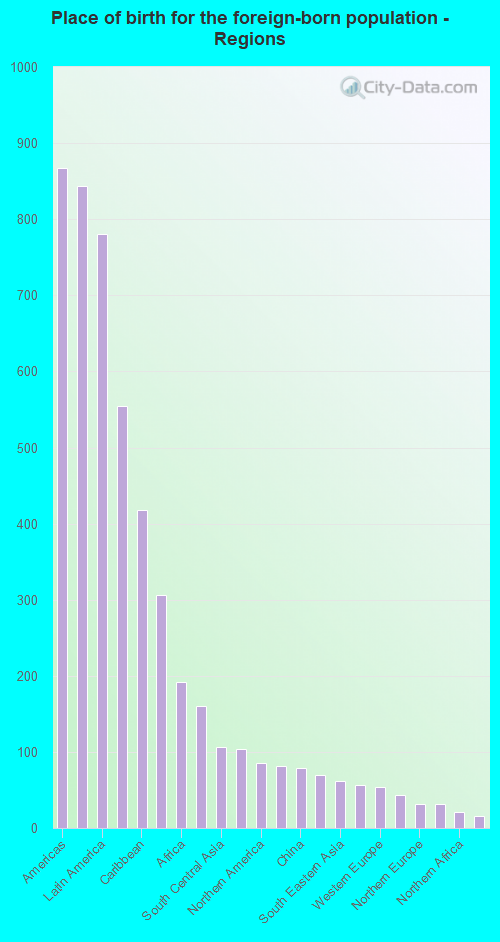
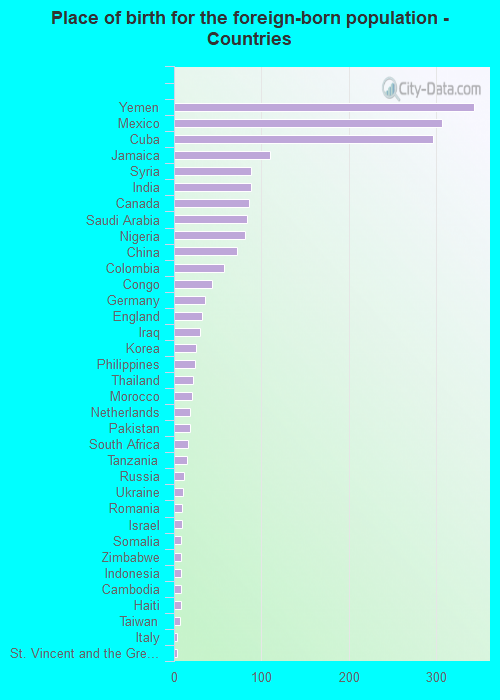
Foreign-born residents in Flint 2,063 residents are foreign born (1.0% Asia , 1.0% Latin America ).
This city:
2.5%Michigan:
6.9%
Marital status for residents in Flint Marital status - White (Caucasian) population 15 years and over
Males 42.8% Never married30.0% Now married4.0% Separated6.2% Widowed17.1% DivorcedFemales 42.3% Never married25.3% Now married2.8% Separated11.8% Widowed17.8% DivorcedWomen who gave birth in the past 12 months Now married:
27.2% (93)Unmarried:
72.8% (249)
Women who did not give birth in the past 12 months Now married:
31.8% (1,851)Unmarried:
68.2% (3,978)
Marital status - Black or African American population 15 years and over
Males 62.2% Never married16.6% Now married3.3% Separated2.9% Widowed14.9% DivorcedFemales 61.4% Never married13.5% Now married1.5% Separated9.6% Widowed13.9% DivorcedWomen who gave birth in the past 12 months Now married:
8.9% (72)Unmarried:
91.1% (734)
Women who did not give birth in the past 12 months Now married:
4.8% (451)Unmarried:
95.2% (8,961)
Marital status - American Indian / Alaska Native population 15 years and over
Males 79.2% Never married2.1% Now married0.0% Separated0.0% Widowed18.8% DivorcedFemales 34.4% Never married35.9% Now married0.0% Separated10.9% Widowed18.8% DivorcedWomen who gave birth in the past 12 months Now married:
0.0% (0)Unmarried:
100.0% (17)
Women who did not give birth in the past 12 months Now married:
52.5% (33)Unmarried:
47.5% (30)
Marital status - Asian population 15 years and over
Males 62.0% Never married9.3% Now married0.0% Separated0.0% Widowed28.7% DivorcedFemales 49.3% Never married50.7% Now married0.0% Separated0.0% Widowed0.0% DivorcedWomen who did not give birth in the past 12 months Now married:
33.0% (33)Unmarried:
67.0% (67)
Marital status - Native Hawaiian / Pacific Islander population 15 years and over
Males 0.0% Never married0.0% Now married0.0% Separated0.0% Widowed100.0% DivorcedFemales 0.0% Never married0.0% Now married0.0% Separated35.0% Widowed65.0% DivorcedMarital status - Other race population 15 years and over
Males 76.0% Never married18.3% Now married5.4% Separated0.4% Widowed0.0% DivorcedFemales 34.2% Never married29.8% Now married9.5% Separated14.6% Widowed11.9% DivorcedWomen who gave birth in the past 12 months Now married:
100.0% (12)Unmarried:
0.0% (0)
Women who did not give birth in the past 12 months Now married:
33.6% (61)Unmarried:
66.4% (121)
Marital status - Two or more races population 15 years and over
Males 65.5% Never married20.3% Now married0.0% Separated0.0% Widowed14.2% DivorcedFemales 63.0% Never married22.2% Now married2.1% Separated4.0% Widowed8.6% DivorcedWomen who gave birth in the past 12 months Now married:
0.0% (0)Unmarried:
100.0% (159)
Women who did not give birth in the past 12 months Now married:
18.8% (268)Unmarried:
81.2% (1,161)
Marital status - White alone, not Hispanic / Latino population 15 years and over
Males 43.2% Never married29.3% Now married4.3% Separated5.5% Widowed17.7% DivorcedFemales 42.6% Never married23.9% Now married2.9% Separated12.2% Widowed18.4% DivorcedWomen who gave birth in the past 12 months Now married:
27.2% (94)Unmarried:
72.8% (251)
Women who did not give birth in the past 12 months Now married:
32.5% (1,776)Unmarried:
67.5% (3,696)
Marital status - Hispanic or Latino population 15 years and over
Males 61.7% Never married22.6% Now married1.1% Separated2.0% Widowed12.5% DivorcedFemales 52.4% Never married26.1% Now married1.4% Separated4.2% Widowed15.8% DivorcedWomen who gave birth in the past 12 months Now married:
0.0% (0)Unmarried:
100.0% (57)
Women who did not give birth in the past 12 months Now married:
24.6% (206)Unmarried:
75.4% (632)
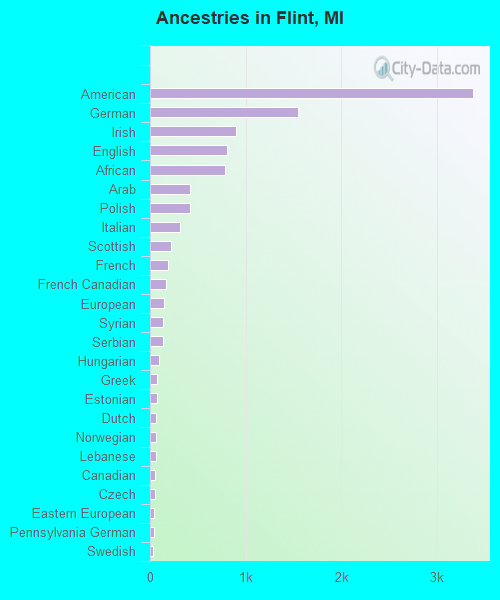
Ancestries in Flint
3,378 6.8% American1,550 3.1% German905 1.8% Irish810 1.6% English782 1.6% African419 0.8% Arab417 0.8% Polish319 0.6% Italian223 0.4% Scottish192 0.4% French167 0.3% French Canadian148 0.3% European139 0.3% Syrian132 0.3% Serbian94 0.2% Hungarian77 0.2% Greek76 0.2% Estonian67 0.1% Dutch65 0.1% Norwegian63 0.1% Lebanese55 0.1% Canadian50 0.1% Czech46 0.09% Eastern European38 0.08% Pennsylvania German36 0.07% Swedish33 0.07% Icelander32 0.06% Palestinian28 0.06% Jamaican27 0.05% Sudanese27 0.05% Scotch-Irish26 0.05% Finnish24 0.05% Ukrainian22 0.04% Czechoslovakian22 0.04% Scandinavian20 0.04% Romanian18 0.04% Iraqi14 0.03% Slovak13 0.03% Welsh11 0.02% Zimbabwean8 0.02% Russian7 0.01% Belgian6 0.01% Egyptian6 0.01% Northern European5 0.01% British
Geographical mobility in Flint Same house 1 year ago 24,485 86.7% White (Caucasian)40,692 90.7% Black or African American229 62.8% American Indian / Alaska Native330 74.8% Asian38 100.0% Native Hawaiian / Pacific Islander755 86.9% Other race3,363 93.3% Two or more races23,012 86.0% White alone, not Hispanic / Latino2,854 93.2% Hispanic or LatinoMoved within same county 2,585 9.2% White / Caucasian3,231 7.2% Black or African American117 32.1% American Indian / Alaska Native141 3.9% Two or more races2,585 9.7% White alone, not Hispanic / Latino86 2.8% Hispanic or LatinoMoved within same state 961 3.4% White / Caucasian499 1.1% Black or African American56 12.7% Asian42 4.8% Other race29 0.8% Two or more races961 3.6% White alone, not Hispanic / Latino29 0.9% Hispanic or LatinoMoved from different state 204 0.7% White / Caucasian461 1.0% Black or African American87 10.0% Other race60 1.7% Two or more races204 0.8% White alone, not Hispanic / Latino84 2.7% Hispanic or LatinoMoved from abroad 54 12.2% Asian10 0.3% Two or more races10 0.3% Hispanic or Latino
Children Nativity (place of birth) in Flint
Children under 6 years - Living with two parents Both parents native 1,293 100.0% NativeBoth parents foreign-born 82 100.0% NativeOne native, one foreign-born parent 33 100.0% NativeChildren under 6 years - Living with one parent Native parent 4,573 100.0% NativeForeign-born parent 46 100.0% NativeChildren 6 to 17 years - Living with two parents Both parents native 2,980 100.0% NativeBoth parents foreign-born 64 31.0% Native142 69.0% Foreign-bornOne native, one foreign-born parent 103 100.0% NativeChildren 6 to 17 years - Living with one parent Native parent 8,375 99.4% Native52 0.6% Foreign-bornForeign-born parent 103 84.4% Native19 15.6% Foreign-born
Grandparents responsible for own grandchildren in Flint
Grandparents (30 to 59 years) White / Caucasian 188 39.7% Responsible for grandchildren286 60.3% Not responsible for grandchildrenBlack or African American 215 40.8% Responsible for grandchildren312 59.2% Not responsible for grandchildrenAmerican Indian / Alaska Native 10 86.5% Responsible for grandchildren2 13.5% Not responsible for grandchildrenTwo or more races 70 100.0% Responsible for grandchildrenWhite alone, not Hispanic / Latino 191 40.0% Responsible for grandchildren286 60.0% Not responsible for grandchildrenHispanic or Latino 69 100.0% Responsible for grandchildrenGrandparents (60 years and over) White / Caucasian 16 10.5% Responsible for grandchildren134 89.5% Not responsible for grandchildrenBlack or African American 193 48.2% Responsible for grandchildren207 51.8% Not responsible for grandchildrenTwo or more races 19 100.0% Not responsible for grandchildrenWhite alone, not Hispanic / Latino 16 10.3% Responsible for grandchildren137 89.7% Not responsible for grandchildrenHispanic or Latino 21 100.0% Not responsible for grandchildren