Races in Florence, South Carolina (SC) Detailed Stats
Data:
Races - White alone (%)
Races - White alone (% change since 2000)
Races - Black alone (%)
Races - Black alone (% change since 2000)
Races - American Indian alone (%)
Races - American Indian alone (% change since 2000)
Races - Asian alone (%)
Races - Asian alone (% change since 2000)
Races - Hispanic (%)
Races - Hispanic (% change since 2000)
Races - Native Hawaiian and Other Pacific Islander alone (%)
Races - Native Hawaiian and Other Pacific Islander alone (% change since 2000)
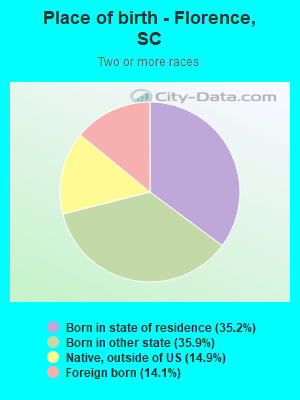
Races - Two or more races(%)
Races - Two or more races(% change since 2000)
Races - Other race alone (%)
Races - Other race alone (% change since 2000)
Racial diversity
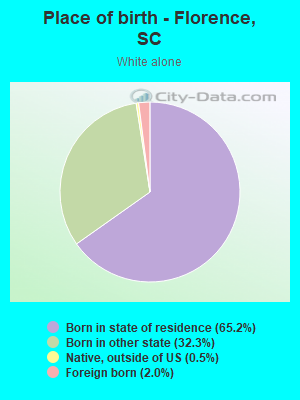
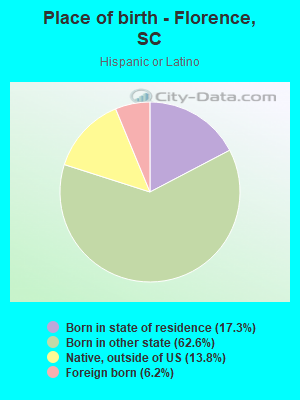
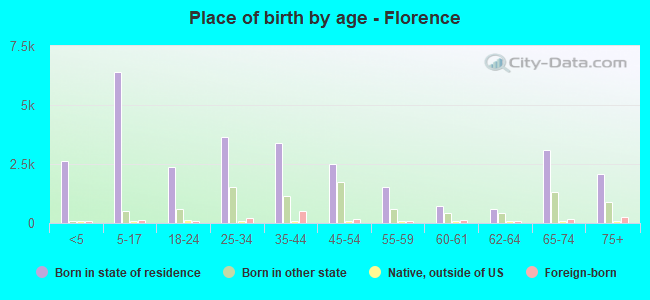
Place of birth - Born in state of residence (%)
Place of birth - Born in state of residence (%) - White
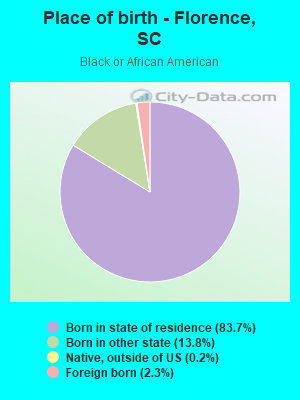
Place of birth - Born in state of residence (%) - Black or African American
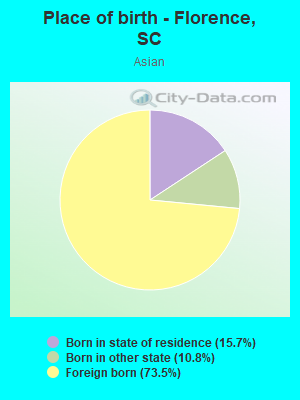
Place of birth - Born in state of residence (%) - Asian
Place of birth - Born in state of residence (%) - Hispanic or Latino
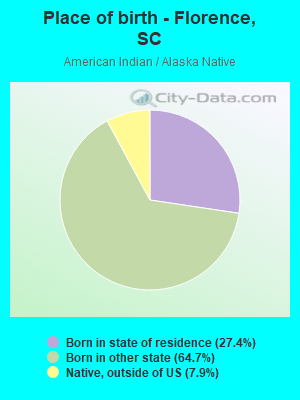
Place of birth - Born in state of residence (%) - American Indian and Alaska Native
Place of birth - Born in state of residence (%) - Multirace
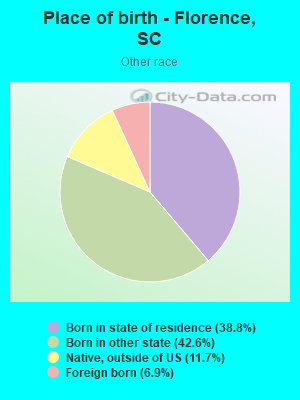
Place of birth - Born in state of residence (%) - Other Race
Place of birth - Born in other state (%)
Place of birth - Born in other state (%) - White
Place of birth - Born in other state (%) - Black or African American
Place of birth - Born in other state (%) - Asian
Place of birth - Born in other state (%) - Hispanic or Latino
Place of birth - Born in other state (%) - American Indian and Alaska Native
Place of birth - Born in other state (%) - Multirace
Place of birth - Born in other state (%) - Other Race
Place of birth - Native, outside of US (%)
Place of birth - Native, outside of US (%) - White
Place of birth - Native, outside of US (%) - Black or African American
Place of birth - Native, outside of US (%) - Asian
Place of birth - Native, outside of US (%) - Hispanic or Latino
Place of birth - Native, outside of US (%) - American Indian and Alaska Native
Place of birth - Native, outside of US (%) - Multirace
Place of birth - Native, outside of US (%) - Other Race
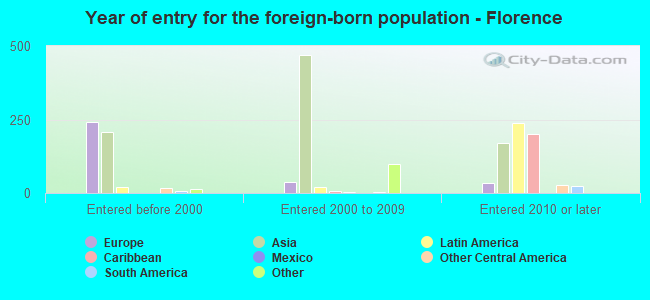
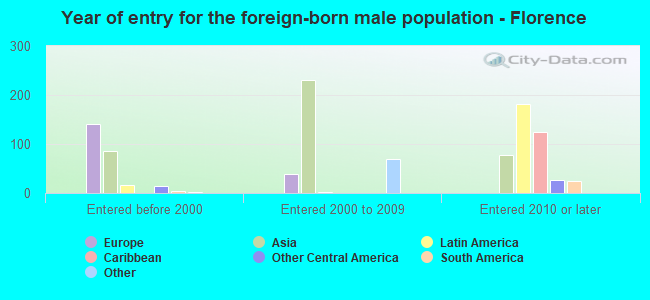
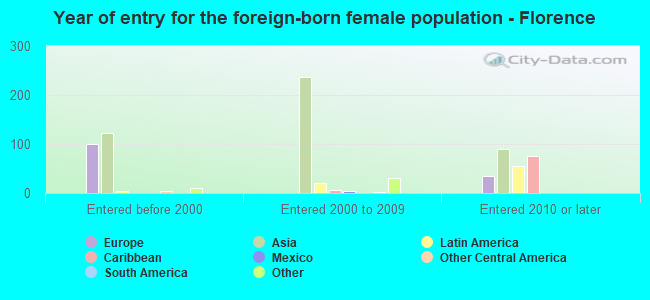
Place of birth - Foreign born (%)
Place of birth - Foreign born (%) - White
Place of birth - Foreign born (%) - Black or African American
Place of birth - Foreign born (%) - Asian
Place of birth - Foreign born (%) - Hispanic or Latino
Place of birth - Foreign born (%) - American Indian and Alaska Native
Place of birth - Foreign born (%) - Multirace
Place of birth - Foreign born (%) - Other Race
Residents speaking English at home (%)
Residents speaking English at home - Born in the United States (%)
Residents speaking English at home - Native, born elsewhere (%)
Residents speaking English at home - Foreign born (%)
Residents speaking Spanish at home (%)
Residents speaking Spanish at home - Born in the United States (%)
Residents speaking Spanish at home - Native, born elsewhere (%)
Residents speaking Spanish at home - Foreign born (%)
Residents speaking other language at home (%)
Residents speaking other language at home - Born in the United States (%)
Residents speaking other language at home - Native, born elsewhere (%)
Residents speaking other language at home - Foreign born (%)
Marital status - Never married (%)
Marital status - Now married (%)
Marital status - Separated (%)
Marital status - Widowed (%)
Marital status - Divorced (%)
Ancestries Reported - Arab (%)
Ancestries Reported - Czech (%)
Ancestries Reported - Danish (%)
Ancestries Reported - Dutch (%)
Ancestries Reported - English (%)
Ancestries Reported - French (%)
Ancestries Reported - French Canadian (%)
Ancestries Reported - German (%)
Ancestries Reported - Greek (%)
Ancestries Reported - Hungarian (%)
Ancestries Reported - Irish (%)
Ancestries Reported - Italian (%)
Ancestries Reported - Lithuanian (%)
Ancestries Reported - Norwegian (%)
Ancestries Reported - Polish (%)
Ancestries Reported - Portuguese (%)
Ancestries Reported - Russian (%)
Ancestries Reported - Scotch-Irish (%)
Ancestries Reported - Scottish (%)
Ancestries Reported - Slovak (%)
Ancestries Reported - Subsaharan African (%)
Ancestries Reported - Swedish (%)
Ancestries Reported - Swiss (%)
Ancestries Reported - Ukrainian (%)
Ancestries Reported - United States (%)
Ancestries Reported - Welsh (%)
Ancestries Reported - West Indian (%)
Ancestries Reported - Other (%)
Geographical mobility - Same house 1 year ago (%)
Geographical mobility - Same house 1 year ago (%) - White
Geographical mobility - Same house 1 year ago (%) - Black or African American
Geographical mobility - Same house 1 year ago (%) - Asian
Geographical mobility - Same house 1 year ago (%) - Hispanic or Latino
Geographical mobility - Same house 1 year ago (%) - American Indian and Alaska Native
Geographical mobility - Same house 1 year ago (%) - Multirace
Geographical mobility - Same house 1 year ago (%) - Other Race
Geographical mobility - Moved within same county (%)
Geographical mobility - Moved within same county (%) - White
Geographical mobility - Moved within same county (%) - Black or African American
Geographical mobility - Moved within same county (%) - Asian
Geographical mobility - Moved within same county (%) - Hispanic or Latino
Geographical mobility - Moved within same county (%) - American Indian and Alaska Native
Geographical mobility - Moved within same county (%) - Multirace
Geographical mobility - Moved within same county (%) - Other Race
Geographical mobility - Moved from different county within same state (%)
Geographical mobility - Moved from different county within same state (%) - White
Geographical mobility - Moved from different county within same state (%) - Black or African American
Geographical mobility - Moved from different county within same state (%) - Asian
Geographical mobility - Moved from different county within same state (%) - Hispanic or Latino
Geographical mobility - Moved from different county within same state (%) - American Indian and Alaska Native
Geographical mobility - Moved from different county within same state (%) - Multirace
Geographical mobility - Moved from different county within same state (%) - Other Race
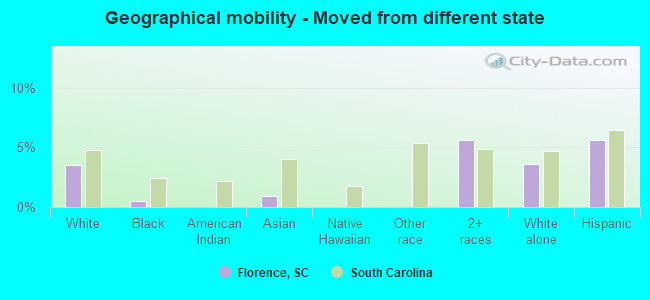
Geographical mobility - Moved from different state (%)
Geographical mobility - Moved from different state (%) - White
Geographical mobility - Moved from different state (%) - Black or African American
Geographical mobility - Moved from different state (%) - Asian
Geographical mobility - Moved from different state (%) - Hispanic or Latino
Geographical mobility - Moved from different state (%) - American Indian and Alaska Native
Geographical mobility - Moved from different state (%) - Multirace
Geographical mobility - Moved from different state (%) - Other Race
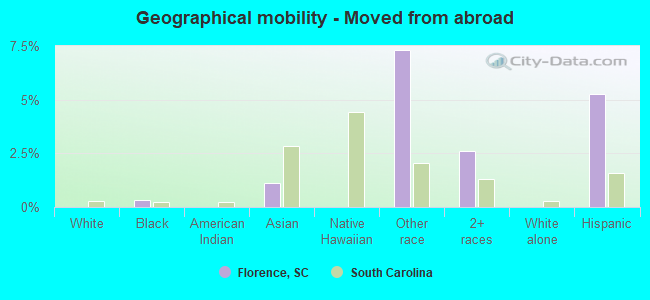
Geographical mobility - Moved from abroad (%)
Geographical mobility - Moved from abroad (%) - White
Geographical mobility - Moved from abroad (%) - Black or African American
Geographical mobility - Moved from abroad (%) - Asian
Geographical mobility - Moved from abroad (%) - Hispanic or Latino
Geographical mobility - Moved from abroad (%) - American Indian and Alaska Native
Geographical mobility - Moved from abroad (%) - Multirace
Geographical mobility - Moved from abroad (%) - Other Race
Place of birth for the foreign-born population - Ireland (%)
Place of birth for the foreign-born population - Denmark (%)
Place of birth for the foreign-born population - Norway (%)
Place of birth for the foreign-born population - Sweden (%)
Place of birth for the foreign-born population - United Kingdom (%)
Place of birth for the foreign-born population - England (%)
Place of birth for the foreign-born population - Scotland (%)
Place of birth for the foreign-born population - Other Northern Europe (%)
Place of birth for the foreign-born population - Austria (%)
Place of birth for the foreign-born population - Belgium (%)
Place of birth for the foreign-born population - France (%)
Place of birth for the foreign-born population - Germany (%)
Place of birth for the foreign-born population - Netherlands (%)
Place of birth for the foreign-born population - Switzerland (%)
Place of birth for the foreign-born population - Other Western Europe (%)
Place of birth for the foreign-born population - Greece (%)
Place of birth for the foreign-born population - Italy (%)
Place of birth for the foreign-born population - Portugal (%)
Place of birth for the foreign-born population - Spain (%)
Place of birth for the foreign-born population - Other Southern Europe (%)
Place of birth for the foreign-born population - Albania (%)
Place of birth for the foreign-born population - Belarus (%)
Place of birth for the foreign-born population - Bosnia and Herzegovina (%)
Place of birth for the foreign-born population - Bulgaria (%)
Place of birth for the foreign-born population - Croatia (%)
Place of birth for the foreign-born population - Czechoslovakia (%)
Place of birth for the foreign-born population - Hungary (%)
Place of birth for the foreign-born population - Latvia (%)
Place of birth for the foreign-born population - Lithuania (%)
Place of birth for the foreign-born population - North Macedonia (Macedonia) (%)
Place of birth for the foreign-born population - Moldova (%)
Place of birth for the foreign-born population - Poland (%)
Place of birth for the foreign-born population - Romania (%)
Place of birth for the foreign-born population - Russia (%)
Place of birth for the foreign-born population - Serbia (%)
Place of birth for the foreign-born population - Ukraine (%)
Place of birth for the foreign-born population - Other Eastern Europe (%)
Place of birth for the foreign-born population - China (%)
Place of birth for the foreign-born population - Hong Kong (%)
Place of birth for the foreign-born population - Taiwan (%)
Place of birth for the foreign-born population - Japan (%)
Place of birth for the foreign-born population - Korea (%)
Place of birth for the foreign-born population - Other Eastern Asia (%)
Place of birth for the foreign-born population - Afghanistan (%)
Place of birth for the foreign-born population - Bangladesh (%)
Place of birth for the foreign-born population - India (%)
Place of birth for the foreign-born population - Iran (%)
Place of birth for the foreign-born population - Kazakhstan (%)
Place of birth for the foreign-born population - Nepal (%)
Place of birth for the foreign-born population - Pakistan (%)
Place of birth for the foreign-born population - Sri Lanka (%)
Place of birth for the foreign-born population - Uzbekistan (%)
Place of birth for the foreign-born population - Other South Central Asia (%)
Place of birth for the foreign-born population - Burma (%)
Place of birth for the foreign-born population - Cambodia (%)
Place of birth for the foreign-born population - Indonesia (%)
Place of birth for the foreign-born population - Laos (%)
Place of birth for the foreign-born population - Malaysia (%)
Place of birth for the foreign-born population - Philippines (%)
Place of birth for the foreign-born population - Singapore (%)
Place of birth for the foreign-born population - Thailand (%)
Place of birth for the foreign-born population - Vietnam (%)
Place of birth for the foreign-born population - Other South Eastern Asia (%)
Place of birth for the foreign-born population - Armenia (%)
Place of birth for the foreign-born population - Iraq (%)
Place of birth for the foreign-born population - Israel (%)
Place of birth for the foreign-born population - Jordan (%)
Place of birth for the foreign-born population - Kuwait (%)
Place of birth for the foreign-born population - Lebanon (%)
Place of birth for the foreign-born population - Saudi Arabia (%)
Place of birth for the foreign-born population - Syria (%)
Place of birth for the foreign-born population - Turkey (%)
Place of birth for the foreign-born population - Yemen (%)
Place of birth for the foreign-born population - Other Western Asia (%)
Place of birth for the foreign-born population - Eritrea (%)
Place of birth for the foreign-born population - Ethiopia (%)
Place of birth for the foreign-born population - Kenya (%)
Place of birth for the foreign-born population - Somalia (%)
Place of birth for the foreign-born population - Uganda (%)
Place of birth for the foreign-born population - Zimbabwe (%)
Place of birth for the foreign-born population - Other Eastern Africa (%)
Place of birth for the foreign-born population - Cameroon (%)
Place of birth for the foreign-born population - Congo (%)
Place of birth for the foreign-born population - Democratic Republic of Congo (Zaire) (%)
Place of birth for the foreign-born population - Other Middle Africa (%)
Place of birth for the foreign-born population - Egypt (%)
Place of birth for the foreign-born population - Morocco (%)
Place of birth for the foreign-born population - Sudan (%)
Place of birth for the foreign-born population - Other Northern Africa (%)
Place of birth for the foreign-born population - South Africa (%)
Place of birth for the foreign-born population - Other Southern Africa (%)
Place of birth for the foreign-born population - Cabo Verde (%)
Place of birth for the foreign-born population - Ghana (%)
Place of birth for the foreign-born population - Liberia (%)
Place of birth for the foreign-born population - Nigeria (%)
Place of birth for the foreign-born population - Senegal (%)
Place of birth for the foreign-born population - Sierra Leone (%)
Place of birth for the foreign-born population - Other Western Africa (%)
Place of birth for the foreign-born population - Australia (%)
Place of birth for the foreign-born population - New Zealand (%)
Place of birth for the foreign-born population - Fiji (%)
Place of birth for the foreign-born population - Micronesia (%)
Place of birth for the foreign-born population - Bahamas (%)
Place of birth for the foreign-born population - Barbados (%)
Place of birth for the foreign-born population - Cuba (%)
Place of birth for the foreign-born population - Dominica (%)
Place of birth for the foreign-born population - Dominican Republic (%)
Place of birth for the foreign-born population - Grenada (%)
Place of birth for the foreign-born population - Haiti (%)
Place of birth for the foreign-born population - Jamaica (%)
Place of birth for the foreign-born population - St. Vincent and the Grenadines (%)
Place of birth for the foreign-born population - Trinidad and Tobago (%)
Place of birth for the foreign-born population - West Indies (%)
Place of birth for the foreign-born population - Other Caribbean (%)
Place of birth for the foreign-born population - Belize (%)
Place of birth for the foreign-born population - Costa Rica (%)
Place of birth for the foreign-born population - El Salvador (%)
Place of birth for the foreign-born population - Guatemala (%)
Place of birth for the foreign-born population - Honduras (%)
Place of birth for the foreign-born population - Mexico (%)
Place of birth for the foreign-born population - Nicaragua (%)
Place of birth for the foreign-born population - Panama (%)
Place of birth for the foreign-born population - Other Central America (%)
Place of birth for the foreign-born population - Argentina (%)
Place of birth for the foreign-born population - Bolivia (%)
Place of birth for the foreign-born population - Brazil (%)
Place of birth for the foreign-born population - Chile (%)
Place of birth for the foreign-born population - Colombia (%)
Place of birth for the foreign-born population - Ecuador (%)
Place of birth for the foreign-born population - Guyana (%)
Place of birth for the foreign-born population - Peru (%)
Place of birth for the foreign-born population - Uruguay (%)
Place of birth for the foreign-born population - Venezuela (%)
Place of birth for the foreign-born population - Other South America (%)
Place of birth for the foreign-born population - Canada (%)
Place of birth for the foreign-born population - Other Northern America (%)
Place of birth for the foreign-born population - Other (%)
Latest news about races in Florence, SC collected exclusively by city-data.com from local newspapers, TV, and radio stations
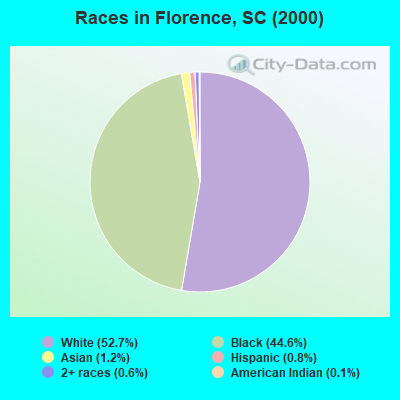
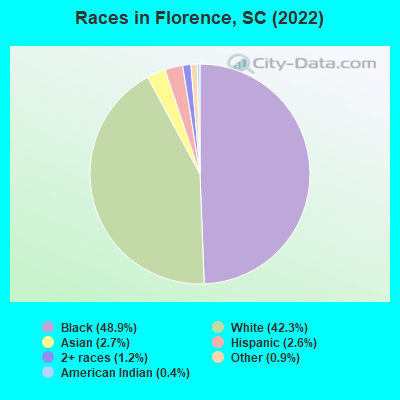
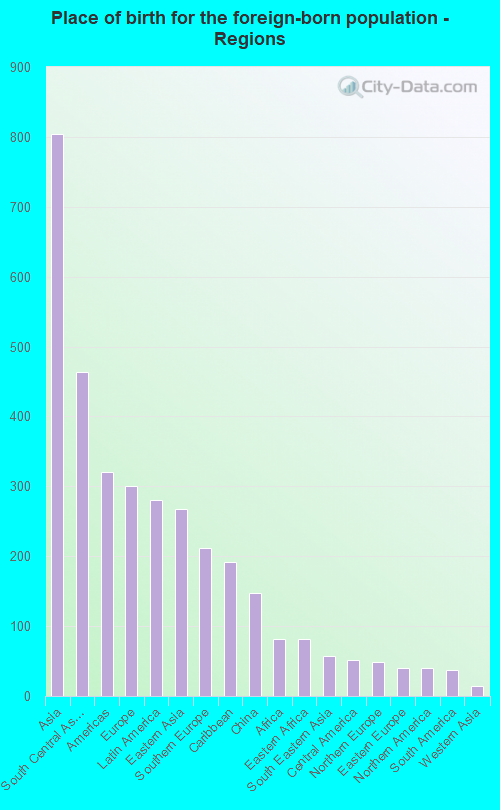
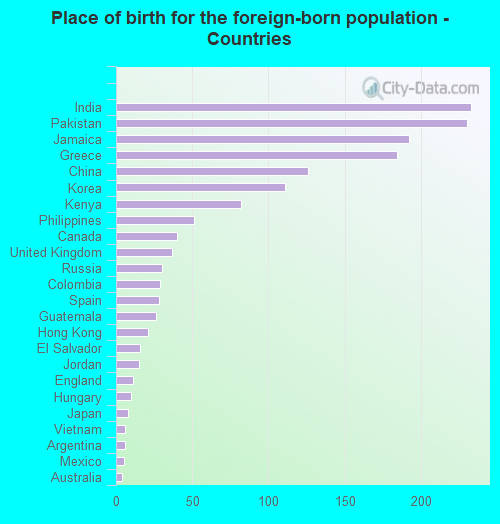
According to 2022 data, the most numerous races in Florence, SC are White alone (17,348 residents), Black alone (20,057 residents), and Hispanic (1,046 residents). 95.4% of Florence residents speak English at home. 3.8% of Florence, SC residents are foreign-born (2.0% born in Asia, 0.7% born in Europe, 0.7% born in Latin America), which is 31.6% less than the foreign-born rate of 5.0% across the entire state of South Carolina.
Race distribution in Florence
2000 2022
2,652,291 66.1% White alone 1,178,486 29.4% Black alone 95,076 2.4% Hispanic 35,568 0.9% Asian alone 33,290 0.8% Two or more races 12,765 0.3% American Indian alone 3,266 0.08% Other race alone 1,270 0.03% Native Hawaiian and Other
3,301,739 62.5% White alone 1,313,290 24.9% Black alone 343,783 6.5% Hispanic 190,508 3.6% Two or more races 89,888 1.7% Asian alone 29,390 0.6% Other race alone 12,112 0.2% American Indian alone 1,924 0.04% Native Hawaiian and Other
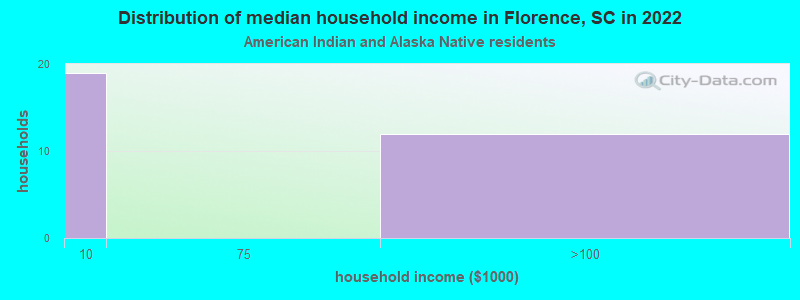
Income and house value in Florence Median household income in 2022 $72,552 White non-Hispanic householders$34,483 Black householders$141,490 Asian householders$55,383 Some other race householders$61,727 Hispanic or Latino race householdersMedian 2022 house value $235,380 White Non-Hispanic householders$110,881 Black or African American householders$230,841 American Indian or Alaska Native householders $409,160 Asian householders$297,197 Some other race householders$243,161 Two or more races householders$282,499 Hispanic or Latino householders
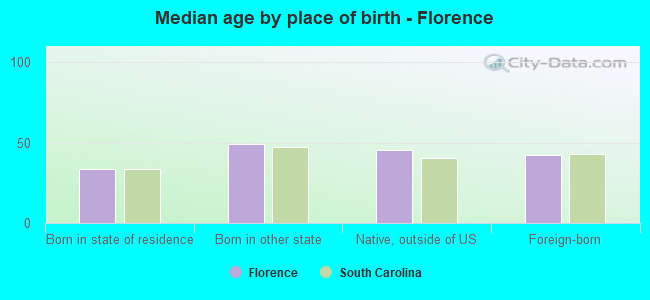
Median age by race in Florence
44.3 Median age for White residents42.2 47.2 34.9 Median age for Black or African American residents35.3 36.2 30.6 Median age for American Indian / Alaska Native residents35.8 45.0 40.8 Median age for Asian residents45.3 39.2 -666,666,666.0 Median age for Native Hawaiian / Pacific Islander residents-666,666,666.0 -666,666,666.0 27.6 Median age for Other race residents33.0 19.4 22.3 Median age for Two or more races residents25.4 26.0 44.3 Median age for White alone residents42.0 47.3 23.3 Median age for Hispanic or Latino residents22.3 22.5
Owner/renter occupied households by race in Florence
House owners and renters - White residents 5,854 76.4% Owner occupied1,811 23.6% Renter occupiedHouse owners and renters - Black or African American residents 3,056 36.7% Owner occupied5,268 63.3% Renter occupiedHouse owners and renters - American Indian / Alaska Native residents 35 100.0% Renter occupiedHouse owners and renters - Asian residents 264 74.4% Owner occupied91 25.6% Renter occupiedHouse owners and renters - Other race residents 59 38.4% Owner occupied95 61.6% Renter occupiedHouse owners and renters - Two or more races residents 243 89.8% Owner occupied27 10.2% Renter occupiedHouse owners and renters - White alone residents 5,810 75.8% Owner occupied1,851 24.2% Renter occupiedHouse owners and renters - Hispanic or Latino residents 194 69.0% Owner occupied87 31.0% Renter occupied
Language usage in Florence
English speakers - Total 95.4% of residents of Florence speak English at home.
2.0% of residents speak Spanish at home 554 75.6% Speak English very well179 24.4% Speak English less than very well2.6% of residents speak other language at home 390 40.5% Speak English very well574 59.5% Speak English less than very well
English speakers - Born in the United States 96.4% of residents of Florence speak English at home.
4.4% of residents speak Spanish at home 364 91.9% Speak English very well32 8.1% Speak English less than very well0.4% of residents speak other language at home 38 100.0% Speak English very well
English speakers - Native, born elsewhere 27.7% of residents of Florence speak English at home.
23.7% of residents speak Spanish at home 95 84.1% Speak English very well18 15.9% Speak English less than very well
English speakers - Foreign-born 42.5% of residents of Florence speak English at home.
6.1% of residents speak Spanish at home 50 60.2% Speak English very well33 39.8% Speak English less than very well66.6% of residents speak other language at home 301 33.1% Speak English very well609 66.9% Speak English less than very well
White (Caucasian) - Speak only English Native:
99.0% (16,050)Foreign-born:
61.7% (180)
White (Caucasian) - Speak another language Native:
1.2% (188)Foreign-born:
43.9% (128)
Black or African American - Speak only English Native:
99.6% (18,335)Foreign-born:
45.4% (109)
Black or African American - Speak another language Native:
0.2% (39)Foreign-born:
48.4% (116)
Asian - Speak only English Native:
82.0% (245)Foreign-born:
35.5% (276)
Asian - Speak another language Native:
14.7% (44)Foreign-born:
62.0% (481)
Other race - Speak another language Native:
66.8% (278)Foreign-born:
95.7% (29)
Two or more races - Speak only English Native:
74.9% (654)Foreign-born:
5.6% (5)
Two or more races - Speak another language Native:
25.5% (223)Foreign-born:
95.0% (86)
White alone - Speak only English Native:
98.7% (15,919)Foreign-born:
48.7% (164)
White alone - Speak another language Native:
1.3% (215)Foreign-born:
51.3% (173)
Hispanic or Latino - Speak only English Native:
39.5% (381)Foreign-born:
39.6% (23)
Hispanic or Latino - Speak another language Native:
57.6% (556)Foreign-born:
77.5% (46)
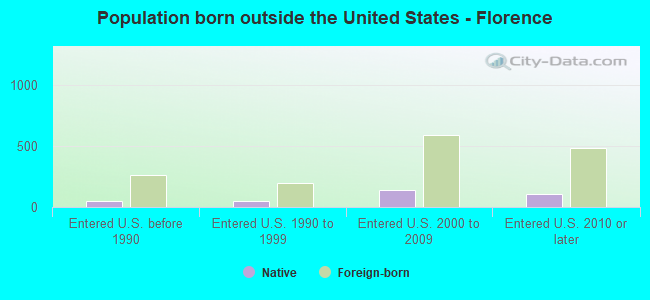
Foreign-born residents in Florence 1,514 residents are foreign born (2.0% Asia , 0.7% Europe , 0.7% Latin America ).
This city:
3.8%South Carolina:
5.3%
Marital status for residents in Florence Marital status - White (Caucasian) population 15 years and over
Males 27.0% Never married60.9% Now married2.8% Separated2.8% Widowed6.5% DivorcedFemales 18.4% Never married52.8% Now married1.2% Separated12.9% Widowed14.7% DivorcedWomen who gave birth in the past 12 months Now married:
82.8% (196)Unmarried:
17.2% (41)
Women who did not give birth in the past 12 months Now married:
54.2% (1,770)Unmarried:
45.8% (1,497)
Marital status - Black or African American population 15 years and over
Males 47.5% Never married36.8% Now married3.8% Separated2.8% Widowed9.0% DivorcedFemales 48.5% Never married25.9% Now married5.0% Separated8.3% Widowed12.3% DivorcedWomen who gave birth in the past 12 months Now married:
13.7% (50)Unmarried:
86.3% (312)
Women who did not give birth in the past 12 months Now married:
25.8% (1,347)Unmarried:
74.2% (3,870)
Marital status - American Indian / Alaska Native population 15 years and over
Males 58.2% Never married18.2% Now married0.0% Separated0.0% Widowed23.6% DivorcedFemales 33.3% Never married66.7% Now married0.0% Separated0.0% Widowed0.0% DivorcedWomen who did not give birth in the past 12 months Now married:
66.7% (88)Unmarried:
33.3% (44)
Marital status - Asian population 15 years and over
Males 21.4% Never married76.2% Now married0.0% Separated0.0% Widowed2.4% DivorcedFemales 2.3% Never married82.6% Now married4.1% Separated4.8% Widowed6.2% DivorcedWomen who did not give birth in the past 12 months Now married:
95.7% (247)Unmarried:
4.3% (11)
Marital status - Other race population 15 years and over
Males 18.0% Never married75.9% Now married0.0% Separated6.0% Widowed0.0% DivorcedFemales 59.8% Never married40.2% Now married0.0% Separated0.0% Widowed0.0% DivorcedWomen who did not give birth in the past 12 months Now married:
23.3% (50)Unmarried:
76.7% (165)
Marital status - Two or more races population 15 years and over
Males 40.1% Never married40.1% Now married0.0% Separated1.8% Widowed18.1% DivorcedFemales 41.3% Never married46.6% Now married0.0% Separated7.7% Widowed4.3% DivorcedWomen who did not give birth in the past 12 months Now married:
37.5% (74)Unmarried:
62.5% (123)
Marital status - White alone, not Hispanic / Latino population 15 years and over
Males 26.9% Never married60.9% Now married2.8% Separated2.8% Widowed6.6% DivorcedFemales 18.6% Never married52.6% Now married1.2% Separated12.8% Widowed14.7% DivorcedWomen who gave birth in the past 12 months Now married:
87.2% (197)Unmarried:
12.8% (29)
Women who did not give birth in the past 12 months Now married:
54.0% (1,762)Unmarried:
46.0% (1,500)
Marital status - Hispanic or Latino population 15 years and over
Males 40.4% Never married57.3% Now married0.0% Separated2.3% Widowed0.0% DivorcedFemales 35.4% Never married50.2% Now married0.0% Separated9.3% Widowed5.1% DivorcedWomen who gave birth in the past 12 months Now married:
0.0% (0)Unmarried:
100.0% (13)
Women who did not give birth in the past 12 months Now married:
26.7% (45)Unmarried:
73.3% (123)
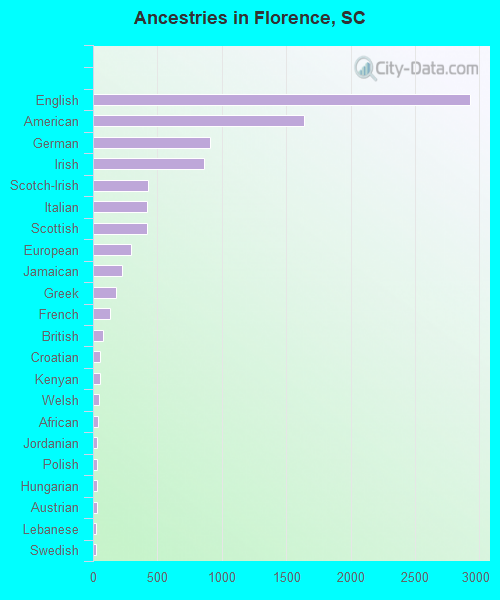
Ancestries in Florence
2,929 10.8% English1,642 6.0% American906 3.3% German863 3.2% Irish425 1.6% Scotch-Irish422 1.6% Italian419 1.5% Scottish294 1.1% European225 0.8% Jamaican175 0.6% Greek134 0.5% French74 0.3% British52 0.2% Croatian52 0.2% Kenyan47 0.2% Welsh42 0.2% African33 0.1% Jordanian33 0.1% Polish31 0.1% Hungarian28 0.1% Austrian27 0.10% Lebanese27 0.10% Swedish20 0.07% French Canadian19 0.07% Dutch12 0.04% Armenian10 0.04% Belgian6 0.02% Bahamian2 0.01% Australian
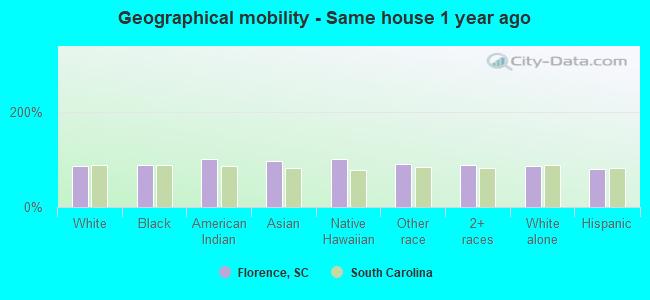
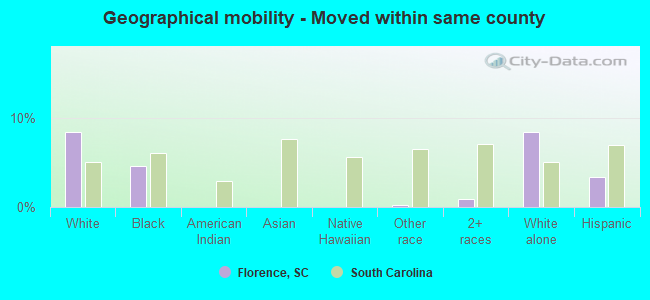
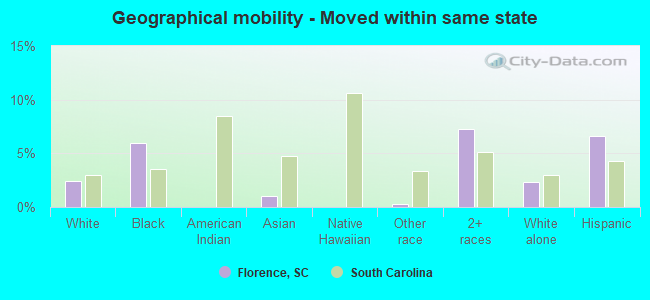
Geographical mobility in Florence Same house 1 year ago 14,175 85.8% White (Caucasian)17,917 89.0% Black or African American230 100.0% American Indian / Alaska Native1,084 96.4% Asian18 100.0% Native Hawaiian / Pacific Islander548 90.4% Other race859 88.0% Two or more races14,109 85.8% White alone, not Hispanic / Latino794 78.8% Hispanic or LatinoMoved within same county 1,386 8.4% White / Caucasian929 4.6% Black or African American1 0.2% Other race9 0.9% Two or more races1,376 8.4% White alone, not Hispanic / Latino34 3.4% Hispanic or LatinoMoved within same state 396 2.4% White / Caucasian1,204 6.0% Black or African American11 1.0% Asian2 0.3% Other race71 7.2% Two or more races383 2.3% White alone, not Hispanic / Latino67 6.6% Hispanic or LatinoMoved from different state 586 3.5% White / Caucasian109 0.5% Black or African American11 0.9% Asian55 5.6% Two or more races595 3.6% White alone, not Hispanic / Latino57 5.6% Hispanic or LatinoMoved from abroad 68 0.3% Black or African American13 1.1% Asian44 7.3% Other race25 2.6% Two or more races53 5.3% Hispanic or Latino
Children Nativity (place of birth) in Florence
Children under 6 years - Living with two parents Both parents native 1,334 100.0% NativeBoth parents foreign-born 111 80.3% Native27 19.7% Foreign-bornOne native, one foreign-born parent 36 100.0% NativeChildren under 6 years - Living with one parent Native parent 1,610 100.0% NativeChildren 6 to 17 years - Living with two parents Both parents native 3,602 100.0% NativeBoth parents foreign-born 195 79.3% Native51 20.7% Foreign-bornOne native, one foreign-born parent 53 100.0% NativeChildren 6 to 17 years - Living with one parent Native parent 2,295 100.0% NativeForeign-born parent 54 49.6% Native55 50.4% Foreign-born
Grandparents responsible for own grandchildren in Florence
Grandparents (30 to 59 years) White / Caucasian 29 100.0% Not responsible for grandchildrenBlack or African American 144 48.0% Responsible for grandchildren156 52.0% Not responsible for grandchildrenAsian 16 54.6% Responsible for grandchildren14 45.4% Not responsible for grandchildrenOther race 11 100.0% Responsible for grandchildrenWhite alone, not Hispanic / Latino 34 100.0% Not responsible for grandchildrenHispanic or Latino 7 100.0% Responsible for grandchildrenGrandparents (60 years and over) White / Caucasian 8 5.3% Responsible for grandchildren140 94.7% Not responsible for grandchildrenBlack or African American 166 32.9% Responsible for grandchildren337 67.1% Not responsible for grandchildrenAsian 187 100.0% Not responsible for grandchildrenWhite alone, not Hispanic / Latino 8 5.3% Responsible for grandchildren140 94.7% Not responsible for grandchildren