Races in Florida Ridge, Florida (FL) Detailed Stats
Data:
Races - White alone (%)
Races - White alone (% change since 2000)
Races - Black alone (%)
Races - Black alone (% change since 2000)
Races - American Indian alone (%)
Races - American Indian alone (% change since 2000)
Races - Asian alone (%)
Races - Asian alone (% change since 2000)
Races - Hispanic (%)
Races - Hispanic (% change since 2000)
Races - Native Hawaiian and Other Pacific Islander alone (%)
Races - Native Hawaiian and Other Pacific Islander alone (% change since 2000)
Races - Two or more races(%)
Races - Two or more races(% change since 2000)
Races - Other race alone (%)
Races - Other race alone (% change since 2000)
Racial diversity
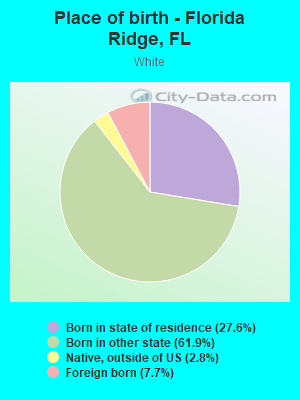
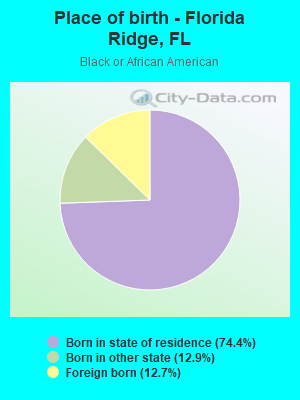
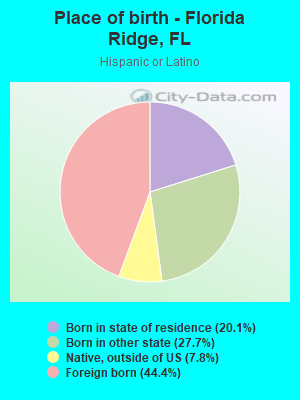
Place of birth - Born in state of residence (%)
Place of birth - Born in state of residence (%) - White
Place of birth - Born in state of residence (%) - Black or African American
Place of birth - Born in state of residence (%) - Asian
Place of birth - Born in state of residence (%) - Hispanic or Latino
Place of birth - Born in state of residence (%) - American Indian and Alaska Native
Place of birth - Born in state of residence (%) - Multirace
Place of birth - Born in state of residence (%) - Other Race
Place of birth - Born in other state (%)
Place of birth - Born in other state (%) - White
Place of birth - Born in other state (%) - Black or African American
Place of birth - Born in other state (%) - Asian
Place of birth - Born in other state (%) - Hispanic or Latino
Place of birth - Born in other state (%) - American Indian and Alaska Native
Place of birth - Born in other state (%) - Multirace
Place of birth - Born in other state (%) - Other Race
Place of birth - Native, outside of US (%)
Place of birth - Native, outside of US (%) - White
Place of birth - Native, outside of US (%) - Black or African American
Place of birth - Native, outside of US (%) - Asian
Place of birth - Native, outside of US (%) - Hispanic or Latino
Place of birth - Native, outside of US (%) - American Indian and Alaska Native
Place of birth - Native, outside of US (%) - Multirace
Place of birth - Native, outside of US (%) - Other Race
Place of birth - Foreign born (%)
Place of birth - Foreign born (%) - White
Place of birth - Foreign born (%) - Black or African American
Place of birth - Foreign born (%) - Asian
Place of birth - Foreign born (%) - Hispanic or Latino
Place of birth - Foreign born (%) - American Indian and Alaska Native
Place of birth - Foreign born (%) - Multirace
Place of birth - Foreign born (%) - Other Race
Residents speaking English at home (%)
Residents speaking English at home - Born in the United States (%)
Residents speaking English at home - Native, born elsewhere (%)
Residents speaking English at home - Foreign born (%)
Residents speaking Spanish at home (%)
Residents speaking Spanish at home - Born in the United States (%)
Residents speaking Spanish at home - Native, born elsewhere (%)
Residents speaking Spanish at home - Foreign born (%)
Residents speaking other language at home (%)
Residents speaking other language at home - Born in the United States (%)
Residents speaking other language at home - Native, born elsewhere (%)
Residents speaking other language at home - Foreign born (%)
Marital status - Never married (%)
Marital status - Now married (%)
Marital status - Separated (%)
Marital status - Widowed (%)
Marital status - Divorced (%)
Ancestries Reported - Arab (%)
Ancestries Reported - Czech (%)
Ancestries Reported - Danish (%)
Ancestries Reported - Dutch (%)
Ancestries Reported - English (%)
Ancestries Reported - French (%)
Ancestries Reported - French Canadian (%)
Ancestries Reported - German (%)
Ancestries Reported - Greek (%)
Ancestries Reported - Hungarian (%)
Ancestries Reported - Irish (%)
Ancestries Reported - Italian (%)
Ancestries Reported - Lithuanian (%)
Ancestries Reported - Norwegian (%)
Ancestries Reported - Polish (%)
Ancestries Reported - Portuguese (%)
Ancestries Reported - Russian (%)
Ancestries Reported - Scotch-Irish (%)
Ancestries Reported - Scottish (%)
Ancestries Reported - Slovak (%)
Ancestries Reported - Subsaharan African (%)
Ancestries Reported - Swedish (%)
Ancestries Reported - Swiss (%)
Ancestries Reported - Ukrainian (%)
Ancestries Reported - United States (%)
Ancestries Reported - Welsh (%)
Ancestries Reported - West Indian (%)
Ancestries Reported - Other (%)
Geographical mobility - Same house 1 year ago (%)
Geographical mobility - Same house 1 year ago (%) - White
Geographical mobility - Same house 1 year ago (%) - Black or African American
Geographical mobility - Same house 1 year ago (%) - Asian
Geographical mobility - Same house 1 year ago (%) - Hispanic or Latino
Geographical mobility - Same house 1 year ago (%) - American Indian and Alaska Native
Geographical mobility - Same house 1 year ago (%) - Multirace
Geographical mobility - Same house 1 year ago (%) - Other Race
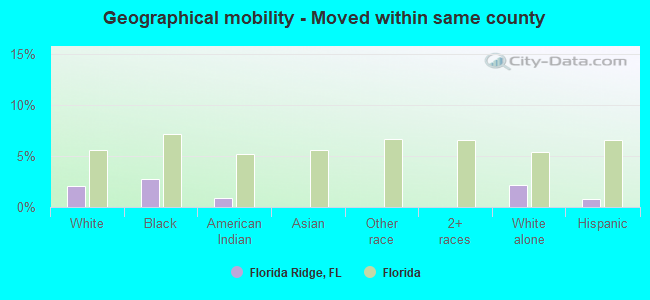
Geographical mobility - Moved within same county (%)
Geographical mobility - Moved within same county (%) - White
Geographical mobility - Moved within same county (%) - Black or African American
Geographical mobility - Moved within same county (%) - Asian
Geographical mobility - Moved within same county (%) - Hispanic or Latino
Geographical mobility - Moved within same county (%) - American Indian and Alaska Native
Geographical mobility - Moved within same county (%) - Multirace
Geographical mobility - Moved within same county (%) - Other Race
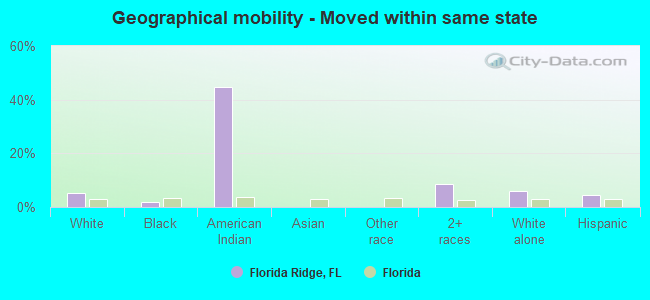
Geographical mobility - Moved from different county within same state (%)
Geographical mobility - Moved from different county within same state (%) - White
Geographical mobility - Moved from different county within same state (%) - Black or African American
Geographical mobility - Moved from different county within same state (%) - Asian
Geographical mobility - Moved from different county within same state (%) - Hispanic or Latino
Geographical mobility - Moved from different county within same state (%) - American Indian and Alaska Native
Geographical mobility - Moved from different county within same state (%) - Multirace
Geographical mobility - Moved from different county within same state (%) - Other Race
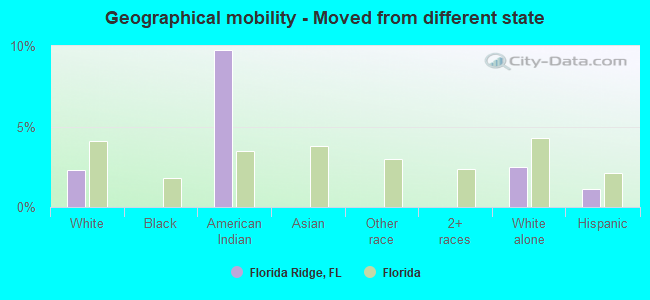
Geographical mobility - Moved from different state (%)
Geographical mobility - Moved from different state (%) - White
Geographical mobility - Moved from different state (%) - Black or African American
Geographical mobility - Moved from different state (%) - Asian
Geographical mobility - Moved from different state (%) - Hispanic or Latino
Geographical mobility - Moved from different state (%) - American Indian and Alaska Native
Geographical mobility - Moved from different state (%) - Multirace
Geographical mobility - Moved from different state (%) - Other Race
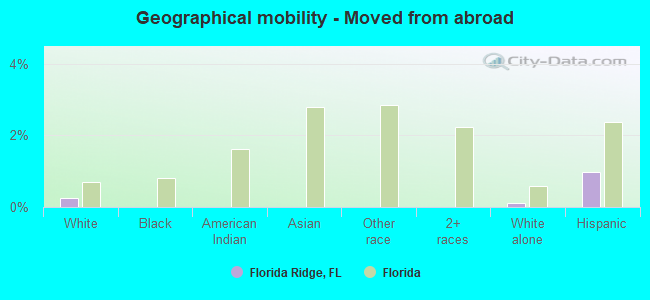
Geographical mobility - Moved from abroad (%)
Geographical mobility - Moved from abroad (%) - White
Geographical mobility - Moved from abroad (%) - Black or African American
Geographical mobility - Moved from abroad (%) - Asian
Geographical mobility - Moved from abroad (%) - Hispanic or Latino
Geographical mobility - Moved from abroad (%) - American Indian and Alaska Native
Geographical mobility - Moved from abroad (%) - Multirace
Geographical mobility - Moved from abroad (%) - Other Race
Place of birth for the foreign-born population - Ireland (%)
Place of birth for the foreign-born population - Denmark (%)
Place of birth for the foreign-born population - Norway (%)
Place of birth for the foreign-born population - Sweden (%)
Place of birth for the foreign-born population - United Kingdom (%)
Place of birth for the foreign-born population - England (%)
Place of birth for the foreign-born population - Scotland (%)
Place of birth for the foreign-born population - Other Northern Europe (%)
Place of birth for the foreign-born population - Austria (%)
Place of birth for the foreign-born population - Belgium (%)
Place of birth for the foreign-born population - France (%)
Place of birth for the foreign-born population - Germany (%)
Place of birth for the foreign-born population - Netherlands (%)
Place of birth for the foreign-born population - Switzerland (%)
Place of birth for the foreign-born population - Other Western Europe (%)
Place of birth for the foreign-born population - Greece (%)
Place of birth for the foreign-born population - Italy (%)
Place of birth for the foreign-born population - Portugal (%)
Place of birth for the foreign-born population - Spain (%)
Place of birth for the foreign-born population - Other Southern Europe (%)
Place of birth for the foreign-born population - Albania (%)
Place of birth for the foreign-born population - Belarus (%)
Place of birth for the foreign-born population - Bosnia and Herzegovina (%)
Place of birth for the foreign-born population - Bulgaria (%)
Place of birth for the foreign-born population - Croatia (%)
Place of birth for the foreign-born population - Czechoslovakia (%)
Place of birth for the foreign-born population - Hungary (%)
Place of birth for the foreign-born population - Latvia (%)
Place of birth for the foreign-born population - Lithuania (%)
Place of birth for the foreign-born population - North Macedonia (Macedonia) (%)
Place of birth for the foreign-born population - Moldova (%)
Place of birth for the foreign-born population - Poland (%)
Place of birth for the foreign-born population - Romania (%)
Place of birth for the foreign-born population - Russia (%)
Place of birth for the foreign-born population - Serbia (%)
Place of birth for the foreign-born population - Ukraine (%)
Place of birth for the foreign-born population - Other Eastern Europe (%)
Place of birth for the foreign-born population - China (%)
Place of birth for the foreign-born population - Hong Kong (%)
Place of birth for the foreign-born population - Taiwan (%)
Place of birth for the foreign-born population - Japan (%)
Place of birth for the foreign-born population - Korea (%)
Place of birth for the foreign-born population - Other Eastern Asia (%)
Place of birth for the foreign-born population - Afghanistan (%)
Place of birth for the foreign-born population - Bangladesh (%)
Place of birth for the foreign-born population - India (%)
Place of birth for the foreign-born population - Iran (%)
Place of birth for the foreign-born population - Kazakhstan (%)
Place of birth for the foreign-born population - Nepal (%)
Place of birth for the foreign-born population - Pakistan (%)
Place of birth for the foreign-born population - Sri Lanka (%)
Place of birth for the foreign-born population - Uzbekistan (%)
Place of birth for the foreign-born population - Other South Central Asia (%)
Place of birth for the foreign-born population - Burma (%)
Place of birth for the foreign-born population - Cambodia (%)
Place of birth for the foreign-born population - Indonesia (%)
Place of birth for the foreign-born population - Laos (%)
Place of birth for the foreign-born population - Malaysia (%)
Place of birth for the foreign-born population - Philippines (%)
Place of birth for the foreign-born population - Singapore (%)
Place of birth for the foreign-born population - Thailand (%)
Place of birth for the foreign-born population - Vietnam (%)
Place of birth for the foreign-born population - Other South Eastern Asia (%)
Place of birth for the foreign-born population - Armenia (%)
Place of birth for the foreign-born population - Iraq (%)
Place of birth for the foreign-born population - Israel (%)
Place of birth for the foreign-born population - Jordan (%)
Place of birth for the foreign-born population - Kuwait (%)
Place of birth for the foreign-born population - Lebanon (%)
Place of birth for the foreign-born population - Saudi Arabia (%)
Place of birth for the foreign-born population - Syria (%)
Place of birth for the foreign-born population - Turkey (%)
Place of birth for the foreign-born population - Yemen (%)
Place of birth for the foreign-born population - Other Western Asia (%)
Place of birth for the foreign-born population - Eritrea (%)
Place of birth for the foreign-born population - Ethiopia (%)
Place of birth for the foreign-born population - Kenya (%)
Place of birth for the foreign-born population - Somalia (%)
Place of birth for the foreign-born population - Uganda (%)
Place of birth for the foreign-born population - Zimbabwe (%)
Place of birth for the foreign-born population - Other Eastern Africa (%)
Place of birth for the foreign-born population - Cameroon (%)
Place of birth for the foreign-born population - Congo (%)
Place of birth for the foreign-born population - Democratic Republic of Congo (Zaire) (%)
Place of birth for the foreign-born population - Other Middle Africa (%)
Place of birth for the foreign-born population - Egypt (%)
Place of birth for the foreign-born population - Morocco (%)
Place of birth for the foreign-born population - Sudan (%)
Place of birth for the foreign-born population - Other Northern Africa (%)
Place of birth for the foreign-born population - South Africa (%)
Place of birth for the foreign-born population - Other Southern Africa (%)
Place of birth for the foreign-born population - Cabo Verde (%)
Place of birth for the foreign-born population - Ghana (%)
Place of birth for the foreign-born population - Liberia (%)
Place of birth for the foreign-born population - Nigeria (%)
Place of birth for the foreign-born population - Senegal (%)
Place of birth for the foreign-born population - Sierra Leone (%)
Place of birth for the foreign-born population - Other Western Africa (%)
Place of birth for the foreign-born population - Australia (%)
Place of birth for the foreign-born population - New Zealand (%)
Place of birth for the foreign-born population - Fiji (%)
Place of birth for the foreign-born population - Micronesia (%)
Place of birth for the foreign-born population - Bahamas (%)
Place of birth for the foreign-born population - Barbados (%)
Place of birth for the foreign-born population - Cuba (%)
Place of birth for the foreign-born population - Dominica (%)
Place of birth for the foreign-born population - Dominican Republic (%)
Place of birth for the foreign-born population - Grenada (%)
Place of birth for the foreign-born population - Haiti (%)
Place of birth for the foreign-born population - Jamaica (%)
Place of birth for the foreign-born population - St. Vincent and the Grenadines (%)
Place of birth for the foreign-born population - Trinidad and Tobago (%)
Place of birth for the foreign-born population - West Indies (%)
Place of birth for the foreign-born population - Other Caribbean (%)
Place of birth for the foreign-born population - Belize (%)
Place of birth for the foreign-born population - Costa Rica (%)
Place of birth for the foreign-born population - El Salvador (%)
Place of birth for the foreign-born population - Guatemala (%)
Place of birth for the foreign-born population - Honduras (%)
Place of birth for the foreign-born population - Mexico (%)
Place of birth for the foreign-born population - Nicaragua (%)
Place of birth for the foreign-born population - Panama (%)
Place of birth for the foreign-born population - Other Central America (%)
Place of birth for the foreign-born population - Argentina (%)
Place of birth for the foreign-born population - Bolivia (%)
Place of birth for the foreign-born population - Brazil (%)
Place of birth for the foreign-born population - Chile (%)
Place of birth for the foreign-born population - Colombia (%)
Place of birth for the foreign-born population - Ecuador (%)
Place of birth for the foreign-born population - Guyana (%)
Place of birth for the foreign-born population - Peru (%)
Place of birth for the foreign-born population - Uruguay (%)
Place of birth for the foreign-born population - Venezuela (%)
Place of birth for the foreign-born population - Other South America (%)
Place of birth for the foreign-born population - Canada (%)
Place of birth for the foreign-born population - Other Northern America (%)
Place of birth for the foreign-born population - Other (%)
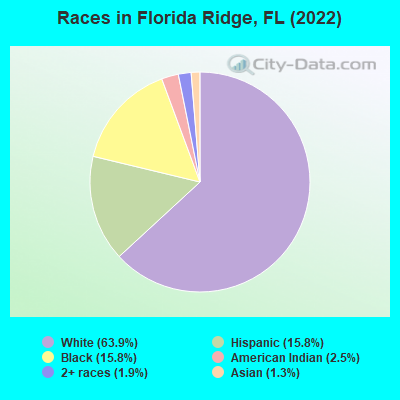
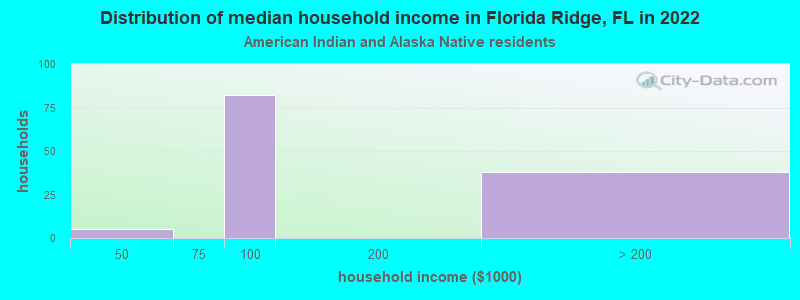
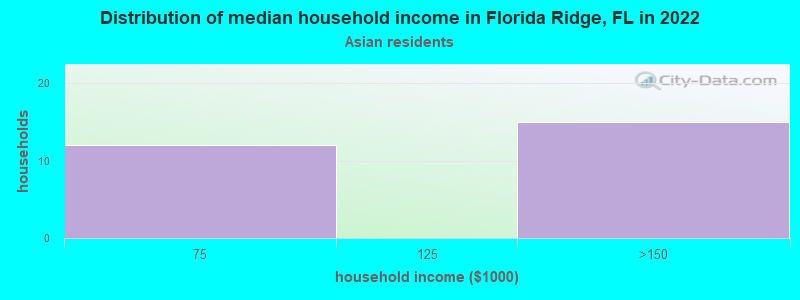
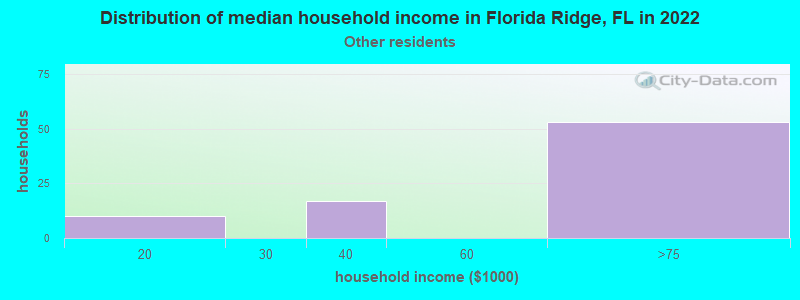
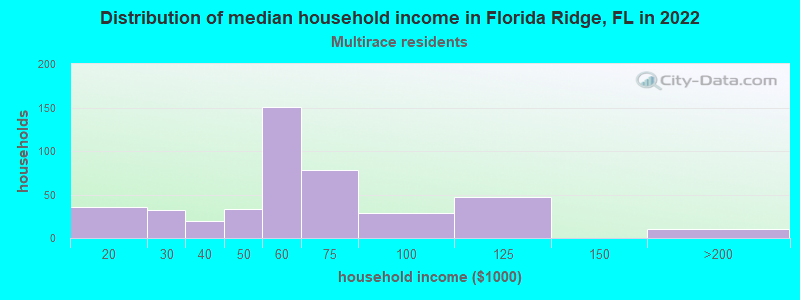
According to 2022 data, the most numerous races in Florida Ridge, FL are White alone (14,983 residents), Hispanic (3,702 residents), and Black alone (3,694 residents). 82.2% of Florida Ridge residents speak English at home. 10.7% of Florida Ridge, FL residents are foreign-born (7.1% born in Latin America, 1.5% born in Europe, 1.1% born in Asia), which is 96.0% less than the foreign-born rate of 21.0% across the entire state of Florida.
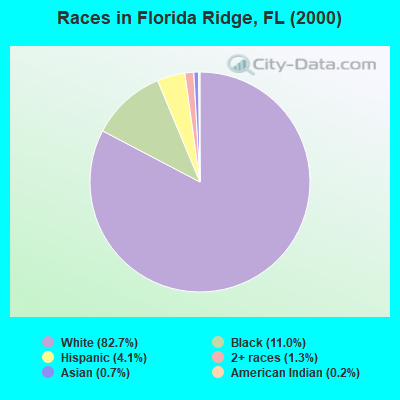
Race distribution in Florida Ridge
2000 2022
10,458,509 65.4% White alone 2,682,715 16.8% Hispanic 2,264,268 14.2% Black alone 261,693 1.6% Asian alone 236,954 1.5% Two or more races 42,358 0.3% American Indian alone 28,994 0.2% Other race alone 6,887 0.04% Native Hawaiian and Other
11,309,403 50.8% White alone 6,025,039 27.1% Hispanic 3,241,015 14.6% Black alone 861,630 3.9% Two or more races 623,692 2.8% Asian alone 152,054 0.7% Other race alone 22,504 0.1% American Indian alone 9,486 0.04% Native Hawaiian and Other
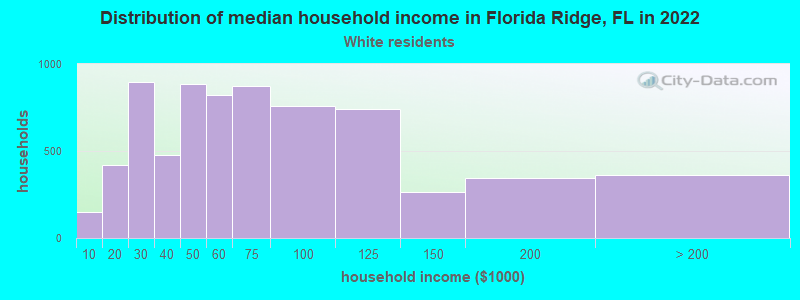
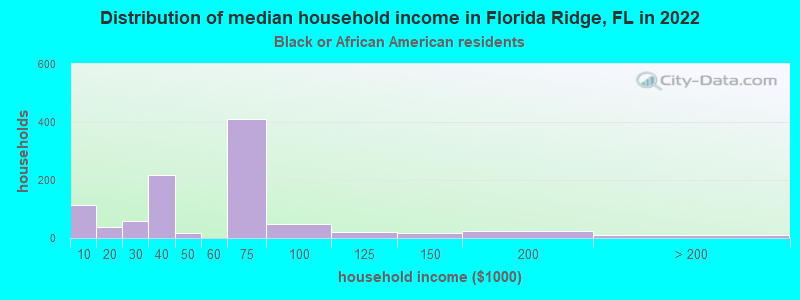
Income and house value in Florida Ridge Median household income in 2022 $55,372 White non-Hispanic householders$64,105 Black householders$93,178 Some other race householders$52,642 Two or more races householders$55,320 Hispanic or Latino race householdersMedian 2022 house value $303,020 White Non-Hispanic householders$207,975 Black or African American householders $276,716 Asian householders$173,605 Some other race householders$238,488 Two or more races householders$236,734 Hispanic or Latino householders
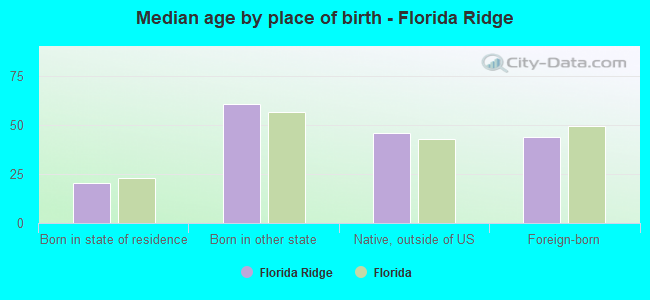
Median age by race in Florida Ridge
48.6 Median age for White residents45.4 51.8 41.3 Median age for Black or African American residents16.4 48.3 40.9 Median age for American Indian / Alaska Native residents44.8 40.2 45.7 Median age for Asian residents51.5 43.0 -666,666,666.0 Median age for Native Hawaiian / Pacific Islander residents-666,666,666.0 -666,666,666.0 50.1 Median age for Other race residents50.2 -724,168,912.1 26.6 Median age for Two or more races residents24.0 33.5 51.3 Median age for White alone residents46.2 56.2 32.9 Median age for Hispanic or Latino residents29.3 33.5
Owner/renter occupied households by race in Florida Ridge
House owners and renters - White residents 5,977 85.4% Owner occupied1,025 14.6% Renter occupiedHouse owners and renters - Black or African American residents 948 95.2% Owner occupied47 4.8% Renter occupiedHouse owners and renters - American Indian / Alaska Native residents 5 4.0% Owner occupied120 96.0% Renter occupiedHouse owners and renters - Asian residents 30 100.0% Owner occupiedHouse owners and renters - Other race residents 63 72.9% Owner occupied24 27.1% Renter occupiedHouse owners and renters - Two or more races residents 173 44.5% Owner occupied216 55.5% Renter occupiedHouse owners and renters - White alone residents 5,696 89.2% Owner occupied689 10.8% Renter occupiedHouse owners and renters - Hispanic or Latino residents 449 43.0% Owner occupied596 57.0% Renter occupied
Language usage in Florida Ridge
English speakers - Total 82.2% of residents of Florida Ridge speak English at home.
12.4% of residents speak Spanish at home 1,981 72.1% Speak English very well766 27.9% Speak English less than very well5.6% of residents speak other language at home 514 41.3% Speak English very well730 58.7% Speak English less than very well
English speakers - Born in the United States 93.5% of residents of Florida Ridge speak English at home.
4.3% of residents speak Spanish at home 482 94.3% Speak English very well29 5.7% Speak English less than very well1.4% of residents speak other language at home 149 92.0% Speak English very well13 8.0% Speak English less than very well
English speakers - Native, born elsewhere 84.8% of residents of Florida Ridge speak English at home.
26.4% of residents speak Spanish at home 140 80.5% Speak English very well34 19.5% Speak English less than very well5.8% of residents speak other language at home 38 100.0% Speak English very well
English speakers - Foreign-born 19.5% of residents of Florida Ridge speak English at home.
50.0% of residents speak Spanish at home 866 57.0% Speak English very well653 43.0% Speak English less than very well31.3% of residents speak other language at home 288 30.3% Speak English very well664 69.7% Speak English less than very well
White (Caucasian) - Speak only English Native:
91.0% (13,346)Foreign-born:
15.4% (204)
White (Caucasian) - Speak another language Native:
8.5% (1,248)Foreign-born:
70.6% (941)
Black or African American - Speak only English Native:
93.0% (3,118)Foreign-born:
90.8% (423)
Black or African American - Speak another language Native:
1.1% (36)Foreign-born:
19.4% (91)
Other race - Speak another language Native:
24.9% (8)Foreign-born:
95.4% (108)
Two or more races - Speak only English Native:
84.0% (683)Foreign-born:
34.8% (141)
Two or more races - Speak another language Native:
17.6% (143)Foreign-born:
65.2% (264)
White alone - Speak only English Native:
97.0% (12,903)Foreign-born:
37.7% (218)
White alone - Speak another language Native:
3.1% (411)Foreign-born:
54.1% (314)
Hispanic or Latino - Speak another language Native:
55.0% (1,028)Foreign-born:
100.0% (1,609)
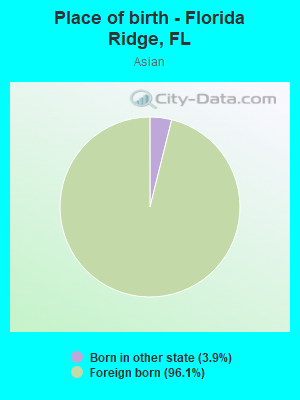
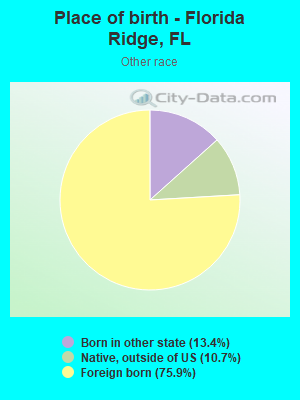
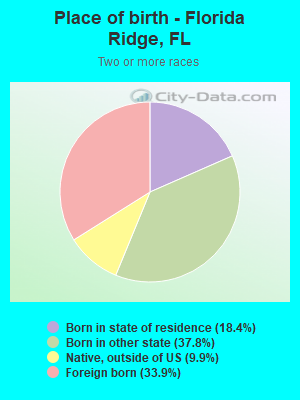
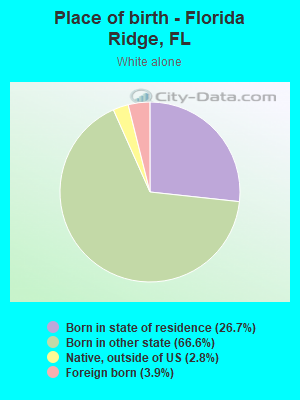
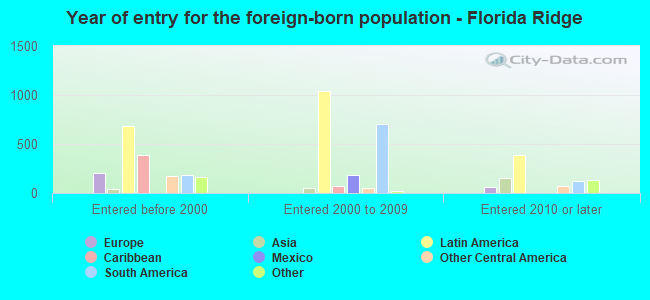
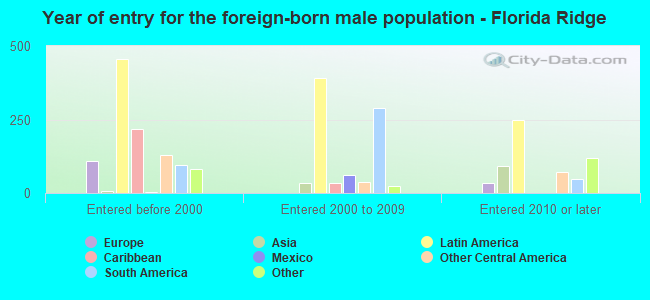
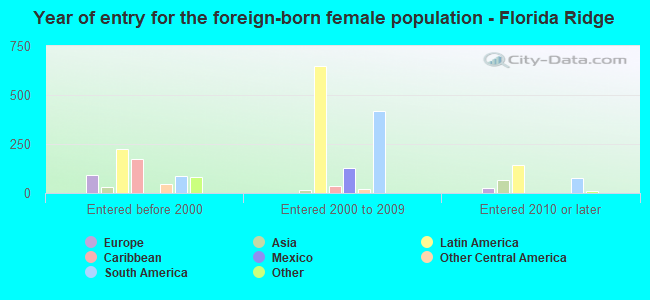
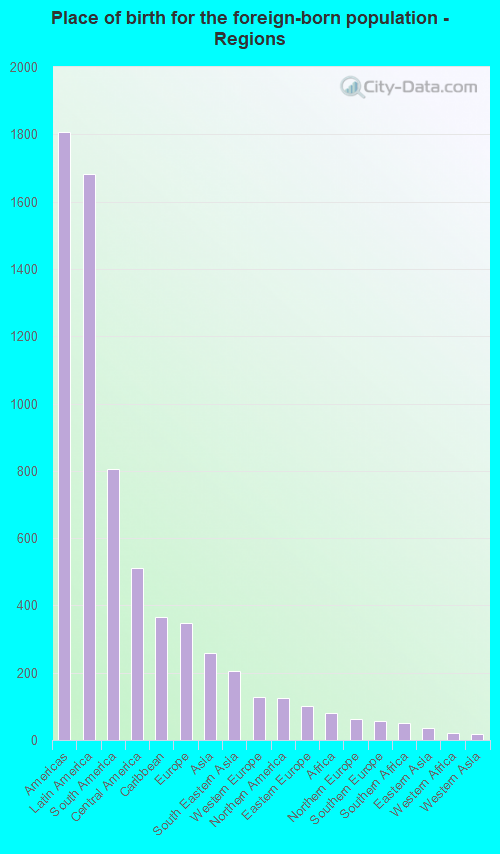
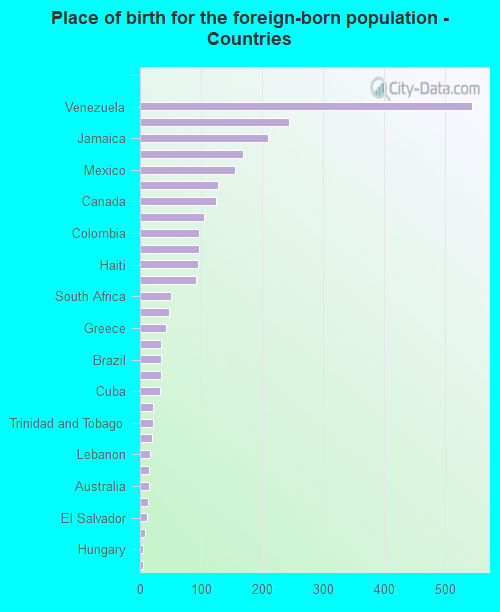
Foreign-born residents in Florida Ridge 2,511 residents are foreign born (7.1% Latin America , 1.5% Europe , 1.1% Asia ).
This city:
10.7%Florida:
21.1%
Marital status for residents in Florida Ridge Marital status - White (Caucasian) population 15 years and over
Males 32.6% Never married49.6% Now married1.0% Separated2.6% Widowed14.2% DivorcedFemales 25.0% Never married42.0% Now married0.4% Separated15.1% Widowed17.4% DivorcedWomen who gave birth in the past 12 months Now married:
38.6% (48)Unmarried:
61.4% (76)
Women who did not give birth in the past 12 months Now married:
36.0% (1,096)Unmarried:
64.0% (1,951)
Marital status - Black or African American population 15 years and over
Males 49.9% Never married40.1% Now married0.7% Separated2.9% Widowed6.4% DivorcedFemales 61.6% Never married31.6% Now married0.0% Separated0.4% Widowed6.4% DivorcedWomen who gave birth in the past 12 months Now married:
0.0% (0)Unmarried:
100.0% (174)
Women who did not give birth in the past 12 months Now married:
3.3% (27)Unmarried:
96.7% (778)
Marital status - American Indian / Alaska Native population 15 years and over
Males 40.6% Never married11.7% Now married0.0% Separated0.0% Widowed47.7% DivorcedFemales 48.5% Never married0.0% Now married0.0% Separated3.9% Widowed47.6% DivorcedWomen who did not give birth in the past 12 months Now married:
0.0% (0)Unmarried:
100.0% (162)
Marital status - Asian population 15 years and over
Males 0.0% Never married100.0% Now married0.0% Separated0.0% Widowed0.0% DivorcedFemales 0.0% Never married100.0% Now married0.0% Separated0.0% Widowed0.0% DivorcedWomen who did not give birth in the past 12 months Now married:
100.0% (32)Unmarried:
0.0% (0)
Marital status - Other race population 15 years and over
Males 37.8% Never married62.2% Now married0.0% Separated0.0% Widowed0.0% DivorcedFemales 0.0% Never married100.0% Now married0.0% Separated0.0% Widowed0.0% DivorcedWomen who did not give birth in the past 12 months Now married:
100.0% (52)Unmarried:
0.0% (0)
Marital status - Two or more races population 15 years and over
Males 67.1% Never married26.2% Now married0.0% Separated0.0% Widowed6.8% DivorcedFemales 30.7% Never married54.4% Now married0.0% Separated7.8% Widowed7.1% DivorcedWomen who did not give birth in the past 12 months Now married:
50.0% (131)Unmarried:
50.0% (131)
Marital status - White alone, not Hispanic / Latino population 15 years and over
Males 23.4% Never married57.4% Now married1.3% Separated3.3% Widowed14.7% DivorcedFemales 22.6% Never married45.7% Now married0.5% Separated15.7% Widowed15.5% DivorcedWomen who gave birth in the past 12 months Now married:
52.7% (48)Unmarried:
47.3% (43)
Women who did not give birth in the past 12 months Now married:
43.7% (1,040)Unmarried:
56.3% (1,342)
Marital status - Hispanic or Latino population 15 years and over
Males 68.4% Never married21.2% Now married0.0% Separated0.0% Widowed10.5% DivorcedFemales 40.8% Never married25.3% Now married0.0% Separated9.5% Widowed24.5% DivorcedWomen who gave birth in the past 12 months Now married:
0.0% (0)Unmarried:
100.0% (36)
Women who did not give birth in the past 12 months Now married:
20.6% (199)Unmarried:
79.4% (766)
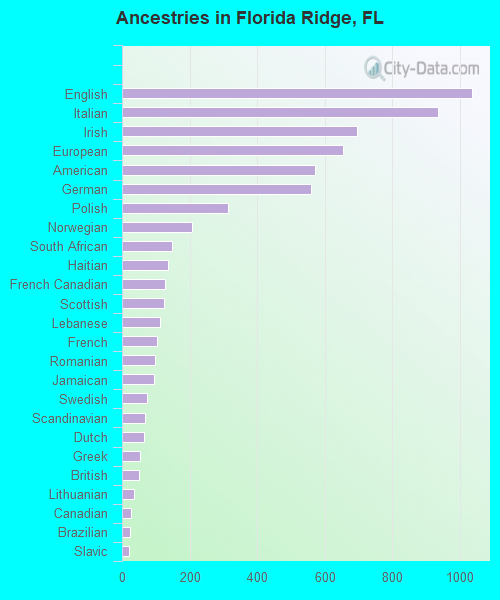
Ancestries in Florida Ridge
1,035 8.9% English937 8.1% Italian697 6.0% Irish653 5.6% European572 4.9% American560 4.8% German313 2.7% Polish208 1.8% Norwegian148 1.3% South African136 1.2% Haitian126 1.1% French Canadian123 1.1% Scottish113 1.0% Lebanese103 0.9% French99 0.9% Romanian96 0.8% Jamaican75 0.6% Swedish67 0.6% Scandinavian64 0.6% Dutch52 0.4% Greek49 0.4% British35 0.3% Lithuanian27 0.2% Canadian24 0.2% Brazilian22 0.2% Slavic21 0.2% Scotch-Irish16 0.1% Australian16 0.1% Portuguese15 0.1% Eastern European11 0.09% Russian10 0.09% Czech9 0.08% Nigerian5 0.04% Hungarian2 0.02% Welsh
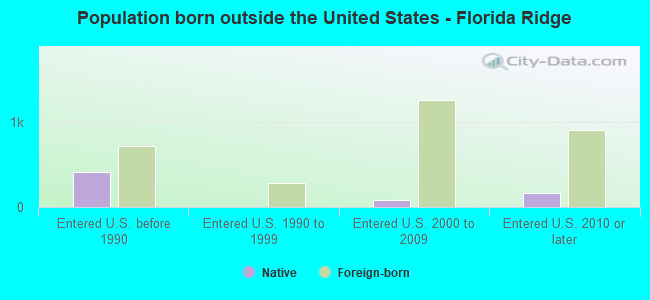
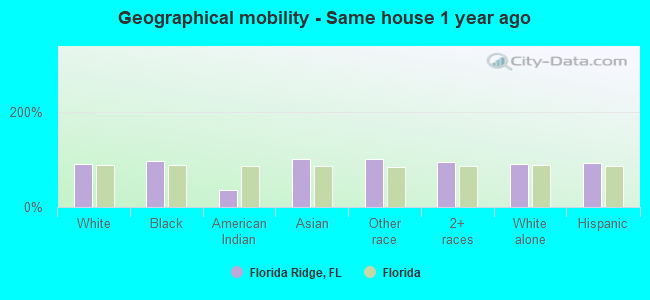
Geographical mobility in Florida Ridge Same house 1 year ago 15,518 91.1% White (Caucasian)3,373 96.8% Black or African American201 35.5% American Indian / Alaska Native254 100.0% Asian183 100.0% Other race1,193 93.8% Two or more races13,355 90.8% White alone, not Hispanic / Latino3,362 91.9% Hispanic or LatinoMoved within same county 359 2.1% White / Caucasian96 2.8% Black or African American5 0.8% American Indian / Alaska Native314 2.1% White alone, not Hispanic / Latino29 0.8% Hispanic or LatinoMoved within same state 901 5.3% White / Caucasian59 1.7% Black or African American253 44.8% American Indian / Alaska Native110 8.7% Two or more races856 5.8% White alone, not Hispanic / Latino164 4.5% Hispanic or LatinoMoved from different state 392 2.3% White / Caucasian55 9.8% American Indian / Alaska Native362 2.5% White alone, not Hispanic / Latino42 1.1% Hispanic or LatinoMoved from abroad 44 0.3% White18 0.1% White alone, not Hispanic / Latino36 1.0% Hispanic or Latino
Children Nativity (place of birth) in Florida Ridge
Children under 6 years - Living with two parents Both parents native 581 100.0% NativeBoth parents foreign-born 113 100.0% NativeOne native, one foreign-born parent 27 100.0% NativeChildren under 6 years - Living with one parent Native parent 604 100.0% NativeForeign-born parent 60 100.0% NativeChildren 6 to 17 years - Living with two parents Both parents native 863 100.0% NativeBoth parents foreign-born 167 46.8% Native190 53.2% Foreign-bornOne native, one foreign-born parent 84 100.0% NativeChildren 6 to 17 years - Living with one parent Native parent 1,000 100.0% NativeForeign-born parent 466 44.4% Native584 55.6% Foreign-born
Grandparents responsible for own grandchildren in Florida Ridge
Grandparents (30 to 59 years) White / Caucasian 61 100.0% Responsible for grandchildrenBlack or African American 56 100.0% Responsible for grandchildrenWhite alone, not Hispanic / Latino 101 100.0% Responsible for grandchildrenGrandparents (60 years and over) White / Caucasian 59 41.8% Responsible for grandchildren82 58.2% Not responsible for grandchildrenBlack or African American 493 100.0% Responsible for grandchildrenWhite alone, not Hispanic / Latino 65 43.3% Responsible for grandchildren85 56.7% Not responsible for grandchildren