Races in Florissant, Missouri (MO) Detailed Stats
Data:
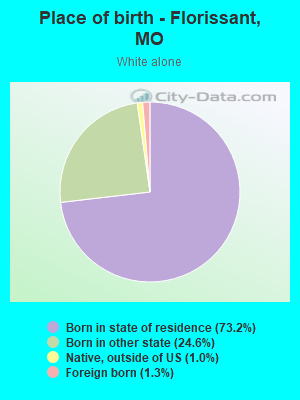
Races - White alone (%)
Races - White alone (% change since 2000)
Races - Black alone (%)
Races - Black alone (% change since 2000)
Races - American Indian alone (%)
Races - American Indian alone (% change since 2000)
Races - Asian alone (%)
Races - Asian alone (% change since 2000)
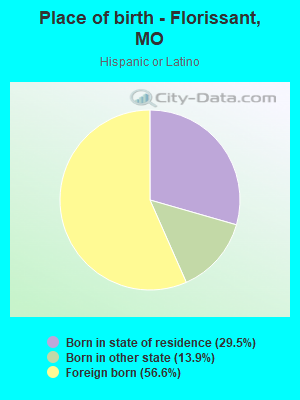
Races - Hispanic (%)
Races - Hispanic (% change since 2000)
Races - Native Hawaiian and Other Pacific Islander alone (%)
Races - Native Hawaiian and Other Pacific Islander alone (% change since 2000)
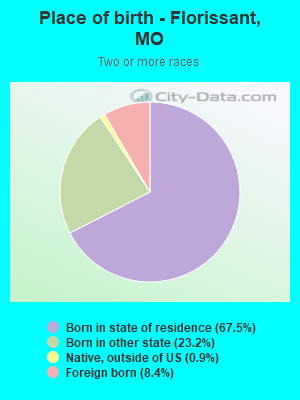
Races - Two or more races(%)
Races - Two or more races(% change since 2000)
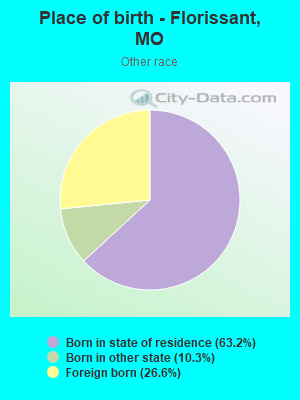
Races - Other race alone (%)
Races - Other race alone (% change since 2000)
Racial diversity
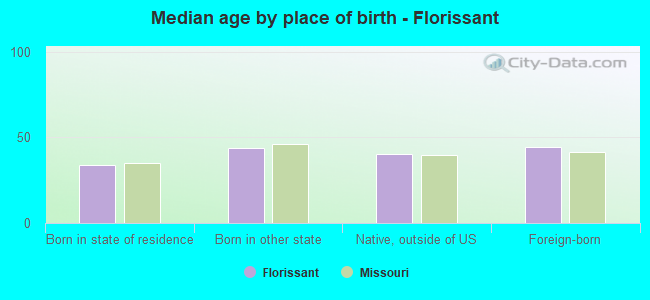
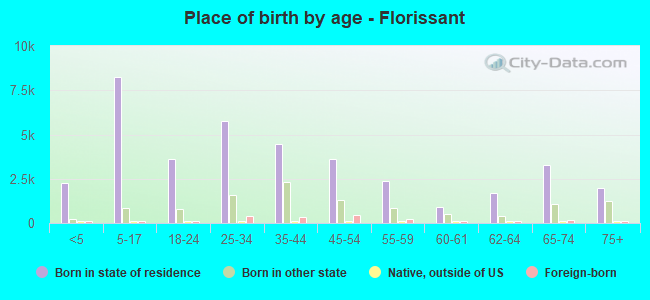
Place of birth - Born in state of residence (%)
Place of birth - Born in state of residence (%) - White
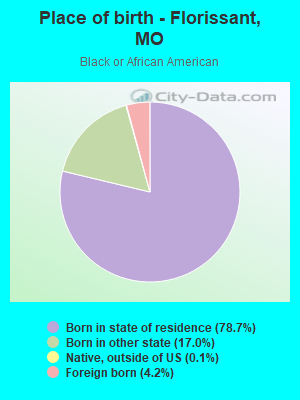
Place of birth - Born in state of residence (%) - Black or African American
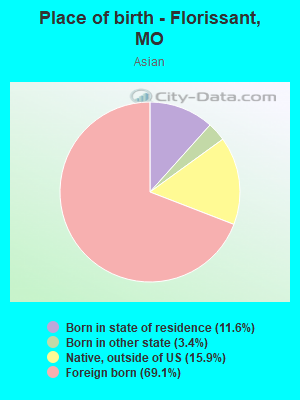
Place of birth - Born in state of residence (%) - Asian
Place of birth - Born in state of residence (%) - Hispanic or Latino
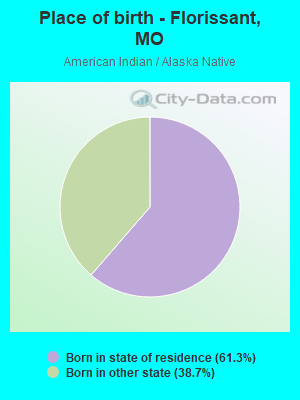
Place of birth - Born in state of residence (%) - American Indian and Alaska Native
Place of birth - Born in state of residence (%) - Multirace
Place of birth - Born in state of residence (%) - Other Race
Place of birth - Born in other state (%)
Place of birth - Born in other state (%) - White
Place of birth - Born in other state (%) - Black or African American
Place of birth - Born in other state (%) - Asian
Place of birth - Born in other state (%) - Hispanic or Latino
Place of birth - Born in other state (%) - American Indian and Alaska Native
Place of birth - Born in other state (%) - Multirace
Place of birth - Born in other state (%) - Other Race
Place of birth - Native, outside of US (%)
Place of birth - Native, outside of US (%) - White
Place of birth - Native, outside of US (%) - Black or African American
Place of birth - Native, outside of US (%) - Asian
Place of birth - Native, outside of US (%) - Hispanic or Latino
Place of birth - Native, outside of US (%) - American Indian and Alaska Native
Place of birth - Native, outside of US (%) - Multirace
Place of birth - Native, outside of US (%) - Other Race
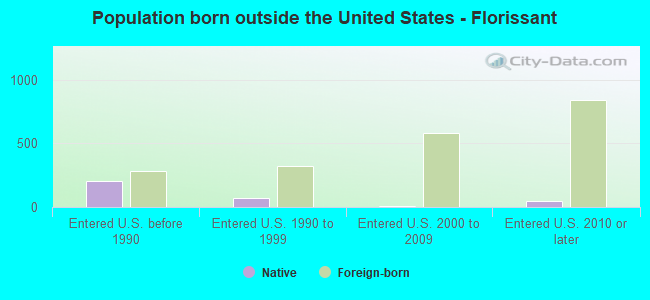
Place of birth - Foreign born (%)
Place of birth - Foreign born (%) - White
Place of birth - Foreign born (%) - Black or African American
Place of birth - Foreign born (%) - Asian
Place of birth - Foreign born (%) - Hispanic or Latino
Place of birth - Foreign born (%) - American Indian and Alaska Native
Place of birth - Foreign born (%) - Multirace
Place of birth - Foreign born (%) - Other Race
Residents speaking English at home (%)
Residents speaking English at home - Born in the United States (%)
Residents speaking English at home - Native, born elsewhere (%)
Residents speaking English at home - Foreign born (%)
Residents speaking Spanish at home (%)
Residents speaking Spanish at home - Born in the United States (%)
Residents speaking Spanish at home - Native, born elsewhere (%)
Residents speaking Spanish at home - Foreign born (%)
Residents speaking other language at home (%)
Residents speaking other language at home - Born in the United States (%)
Residents speaking other language at home - Native, born elsewhere (%)
Residents speaking other language at home - Foreign born (%)
Marital status - Never married (%)
Marital status - Now married (%)
Marital status - Separated (%)
Marital status - Widowed (%)
Marital status - Divorced (%)
Ancestries Reported - Arab (%)
Ancestries Reported - Czech (%)
Ancestries Reported - Danish (%)
Ancestries Reported - Dutch (%)
Ancestries Reported - English (%)
Ancestries Reported - French (%)
Ancestries Reported - French Canadian (%)
Ancestries Reported - German (%)
Ancestries Reported - Greek (%)
Ancestries Reported - Hungarian (%)
Ancestries Reported - Irish (%)
Ancestries Reported - Italian (%)
Ancestries Reported - Lithuanian (%)
Ancestries Reported - Norwegian (%)
Ancestries Reported - Polish (%)
Ancestries Reported - Portuguese (%)
Ancestries Reported - Russian (%)
Ancestries Reported - Scotch-Irish (%)
Ancestries Reported - Scottish (%)
Ancestries Reported - Slovak (%)
Ancestries Reported - Subsaharan African (%)
Ancestries Reported - Swedish (%)
Ancestries Reported - Swiss (%)
Ancestries Reported - Ukrainian (%)
Ancestries Reported - United States (%)
Ancestries Reported - Welsh (%)
Ancestries Reported - West Indian (%)
Ancestries Reported - Other (%)
Geographical mobility - Same house 1 year ago (%)
Geographical mobility - Same house 1 year ago (%) - White
Geographical mobility - Same house 1 year ago (%) - Black or African American
Geographical mobility - Same house 1 year ago (%) - Asian
Geographical mobility - Same house 1 year ago (%) - Hispanic or Latino
Geographical mobility - Same house 1 year ago (%) - American Indian and Alaska Native
Geographical mobility - Same house 1 year ago (%) - Multirace
Geographical mobility - Same house 1 year ago (%) - Other Race
Geographical mobility - Moved within same county (%)
Geographical mobility - Moved within same county (%) - White
Geographical mobility - Moved within same county (%) - Black or African American
Geographical mobility - Moved within same county (%) - Asian
Geographical mobility - Moved within same county (%) - Hispanic or Latino
Geographical mobility - Moved within same county (%) - American Indian and Alaska Native
Geographical mobility - Moved within same county (%) - Multirace
Geographical mobility - Moved within same county (%) - Other Race
Geographical mobility - Moved from different county within same state (%)
Geographical mobility - Moved from different county within same state (%) - White
Geographical mobility - Moved from different county within same state (%) - Black or African American
Geographical mobility - Moved from different county within same state (%) - Asian
Geographical mobility - Moved from different county within same state (%) - Hispanic or Latino
Geographical mobility - Moved from different county within same state (%) - American Indian and Alaska Native
Geographical mobility - Moved from different county within same state (%) - Multirace
Geographical mobility - Moved from different county within same state (%) - Other Race
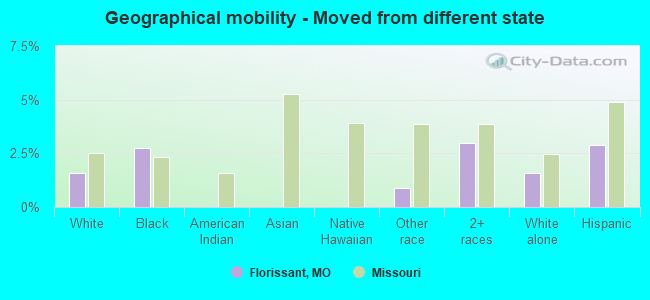
Geographical mobility - Moved from different state (%)
Geographical mobility - Moved from different state (%) - White
Geographical mobility - Moved from different state (%) - Black or African American
Geographical mobility - Moved from different state (%) - Asian
Geographical mobility - Moved from different state (%) - Hispanic or Latino
Geographical mobility - Moved from different state (%) - American Indian and Alaska Native
Geographical mobility - Moved from different state (%) - Multirace
Geographical mobility - Moved from different state (%) - Other Race
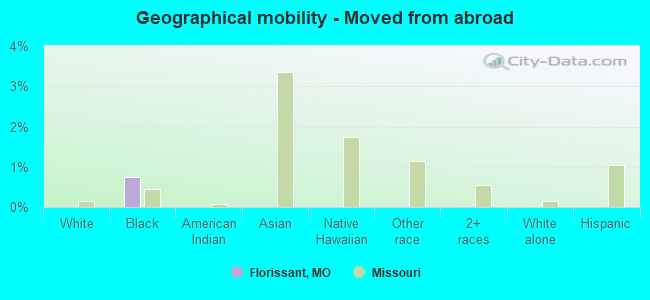
Geographical mobility - Moved from abroad (%)
Geographical mobility - Moved from abroad (%) - White
Geographical mobility - Moved from abroad (%) - Black or African American
Geographical mobility - Moved from abroad (%) - Asian
Geographical mobility - Moved from abroad (%) - Hispanic or Latino
Geographical mobility - Moved from abroad (%) - American Indian and Alaska Native
Geographical mobility - Moved from abroad (%) - Multirace
Geographical mobility - Moved from abroad (%) - Other Race
Place of birth for the foreign-born population - Ireland (%)
Place of birth for the foreign-born population - Denmark (%)
Place of birth for the foreign-born population - Norway (%)
Place of birth for the foreign-born population - Sweden (%)
Place of birth for the foreign-born population - United Kingdom (%)
Place of birth for the foreign-born population - England (%)
Place of birth for the foreign-born population - Scotland (%)
Place of birth for the foreign-born population - Other Northern Europe (%)
Place of birth for the foreign-born population - Austria (%)
Place of birth for the foreign-born population - Belgium (%)
Place of birth for the foreign-born population - France (%)
Place of birth for the foreign-born population - Germany (%)
Place of birth for the foreign-born population - Netherlands (%)
Place of birth for the foreign-born population - Switzerland (%)
Place of birth for the foreign-born population - Other Western Europe (%)
Place of birth for the foreign-born population - Greece (%)
Place of birth for the foreign-born population - Italy (%)
Place of birth for the foreign-born population - Portugal (%)
Place of birth for the foreign-born population - Spain (%)
Place of birth for the foreign-born population - Other Southern Europe (%)
Place of birth for the foreign-born population - Albania (%)
Place of birth for the foreign-born population - Belarus (%)
Place of birth for the foreign-born population - Bosnia and Herzegovina (%)
Place of birth for the foreign-born population - Bulgaria (%)
Place of birth for the foreign-born population - Croatia (%)
Place of birth for the foreign-born population - Czechoslovakia (%)
Place of birth for the foreign-born population - Hungary (%)
Place of birth for the foreign-born population - Latvia (%)
Place of birth for the foreign-born population - Lithuania (%)
Place of birth for the foreign-born population - North Macedonia (Macedonia) (%)
Place of birth for the foreign-born population - Moldova (%)
Place of birth for the foreign-born population - Poland (%)
Place of birth for the foreign-born population - Romania (%)
Place of birth for the foreign-born population - Russia (%)
Place of birth for the foreign-born population - Serbia (%)
Place of birth for the foreign-born population - Ukraine (%)
Place of birth for the foreign-born population - Other Eastern Europe (%)
Place of birth for the foreign-born population - China (%)
Place of birth for the foreign-born population - Hong Kong (%)
Place of birth for the foreign-born population - Taiwan (%)
Place of birth for the foreign-born population - Japan (%)
Place of birth for the foreign-born population - Korea (%)
Place of birth for the foreign-born population - Other Eastern Asia (%)
Place of birth for the foreign-born population - Afghanistan (%)
Place of birth for the foreign-born population - Bangladesh (%)
Place of birth for the foreign-born population - India (%)
Place of birth for the foreign-born population - Iran (%)
Place of birth for the foreign-born population - Kazakhstan (%)
Place of birth for the foreign-born population - Nepal (%)
Place of birth for the foreign-born population - Pakistan (%)
Place of birth for the foreign-born population - Sri Lanka (%)
Place of birth for the foreign-born population - Uzbekistan (%)
Place of birth for the foreign-born population - Other South Central Asia (%)
Place of birth for the foreign-born population - Burma (%)
Place of birth for the foreign-born population - Cambodia (%)
Place of birth for the foreign-born population - Indonesia (%)
Place of birth for the foreign-born population - Laos (%)
Place of birth for the foreign-born population - Malaysia (%)
Place of birth for the foreign-born population - Philippines (%)
Place of birth for the foreign-born population - Singapore (%)
Place of birth for the foreign-born population - Thailand (%)
Place of birth for the foreign-born population - Vietnam (%)
Place of birth for the foreign-born population - Other South Eastern Asia (%)
Place of birth for the foreign-born population - Armenia (%)
Place of birth for the foreign-born population - Iraq (%)
Place of birth for the foreign-born population - Israel (%)
Place of birth for the foreign-born population - Jordan (%)
Place of birth for the foreign-born population - Kuwait (%)
Place of birth for the foreign-born population - Lebanon (%)
Place of birth for the foreign-born population - Saudi Arabia (%)
Place of birth for the foreign-born population - Syria (%)
Place of birth for the foreign-born population - Turkey (%)
Place of birth for the foreign-born population - Yemen (%)
Place of birth for the foreign-born population - Other Western Asia (%)
Place of birth for the foreign-born population - Eritrea (%)
Place of birth for the foreign-born population - Ethiopia (%)
Place of birth for the foreign-born population - Kenya (%)
Place of birth for the foreign-born population - Somalia (%)
Place of birth for the foreign-born population - Uganda (%)
Place of birth for the foreign-born population - Zimbabwe (%)
Place of birth for the foreign-born population - Other Eastern Africa (%)
Place of birth for the foreign-born population - Cameroon (%)
Place of birth for the foreign-born population - Congo (%)
Place of birth for the foreign-born population - Democratic Republic of Congo (Zaire) (%)
Place of birth for the foreign-born population - Other Middle Africa (%)
Place of birth for the foreign-born population - Egypt (%)
Place of birth for the foreign-born population - Morocco (%)
Place of birth for the foreign-born population - Sudan (%)
Place of birth for the foreign-born population - Other Northern Africa (%)
Place of birth for the foreign-born population - South Africa (%)
Place of birth for the foreign-born population - Other Southern Africa (%)
Place of birth for the foreign-born population - Cabo Verde (%)
Place of birth for the foreign-born population - Ghana (%)
Place of birth for the foreign-born population - Liberia (%)
Place of birth for the foreign-born population - Nigeria (%)
Place of birth for the foreign-born population - Senegal (%)
Place of birth for the foreign-born population - Sierra Leone (%)
Place of birth for the foreign-born population - Other Western Africa (%)
Place of birth for the foreign-born population - Australia (%)
Place of birth for the foreign-born population - New Zealand (%)
Place of birth for the foreign-born population - Fiji (%)
Place of birth for the foreign-born population - Micronesia (%)
Place of birth for the foreign-born population - Bahamas (%)
Place of birth for the foreign-born population - Barbados (%)
Place of birth for the foreign-born population - Cuba (%)
Place of birth for the foreign-born population - Dominica (%)
Place of birth for the foreign-born population - Dominican Republic (%)
Place of birth for the foreign-born population - Grenada (%)
Place of birth for the foreign-born population - Haiti (%)
Place of birth for the foreign-born population - Jamaica (%)
Place of birth for the foreign-born population - St. Vincent and the Grenadines (%)
Place of birth for the foreign-born population - Trinidad and Tobago (%)
Place of birth for the foreign-born population - West Indies (%)
Place of birth for the foreign-born population - Other Caribbean (%)
Place of birth for the foreign-born population - Belize (%)
Place of birth for the foreign-born population - Costa Rica (%)
Place of birth for the foreign-born population - El Salvador (%)
Place of birth for the foreign-born population - Guatemala (%)
Place of birth for the foreign-born population - Honduras (%)
Place of birth for the foreign-born population - Mexico (%)
Place of birth for the foreign-born population - Nicaragua (%)
Place of birth for the foreign-born population - Panama (%)
Place of birth for the foreign-born population - Other Central America (%)
Place of birth for the foreign-born population - Argentina (%)
Place of birth for the foreign-born population - Bolivia (%)
Place of birth for the foreign-born population - Brazil (%)
Place of birth for the foreign-born population - Chile (%)
Place of birth for the foreign-born population - Colombia (%)
Place of birth for the foreign-born population - Ecuador (%)
Place of birth for the foreign-born population - Guyana (%)
Place of birth for the foreign-born population - Peru (%)
Place of birth for the foreign-born population - Uruguay (%)
Place of birth for the foreign-born population - Venezuela (%)
Place of birth for the foreign-born population - Other South America (%)
Place of birth for the foreign-born population - Canada (%)
Place of birth for the foreign-born population - Other Northern America (%)
Place of birth for the foreign-born population - Other (%)
Latest news about races in Florissant, MO collected exclusively by city-data.com from local newspapers, TV, and radio stations
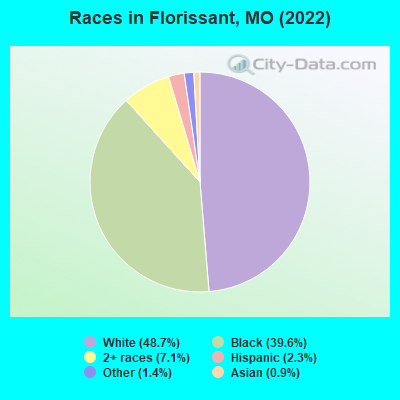
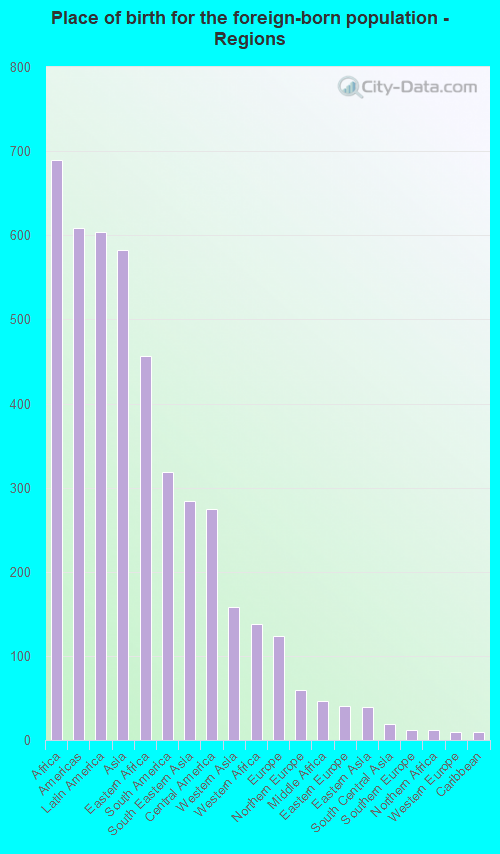
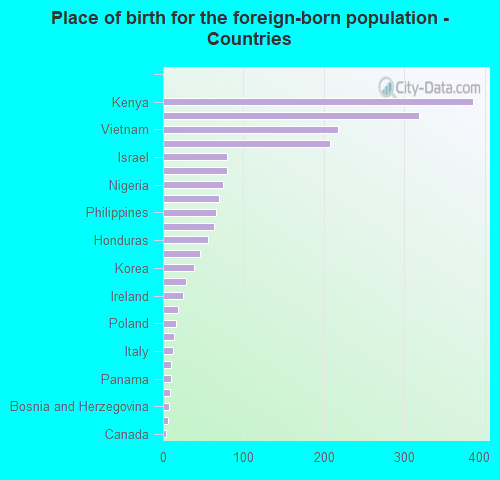
According to 2022 data, the most numerous races in Florissant, MO are White alone (25,144 residents), Black alone (20,454 residents), and Two or more races (3,692 residents). 94.6% of Florissant residents speak English at home. 3.9% of Florissant, MO residents are foreign-born (1.4% born in Africa, 1.2% born in Latin America, 1.1% born in Asia), which is 3.0% less than the foreign-born rate of 4.0% across the entire state of Missouri.
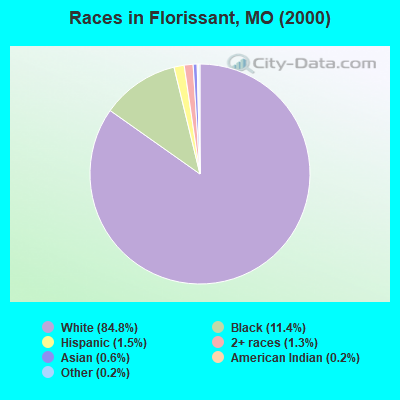
Race distribution in Florissant
2000 2022
4,686,474 83.8% White alone 625,667 11.2% Black alone 118,592 2.1% Hispanic 71,905 1.3% Two or more races 61,041 1.1% Asian alone 23,302 0.4% American Indian alone 5,291 0.09% Other race alone 2,939 0.05% Native Hawaiian and Other
4,733,411 76.6% White alone 656,739 10.6% Black alone 316,300 5.1% Two or more races 291,763 4.7% Hispanic 132,436 2.1% Asian alone 27,467 0.4% Other race alone 12,313 0.2% American Indian alone 7,528 0.1% Native Hawaiian and Other
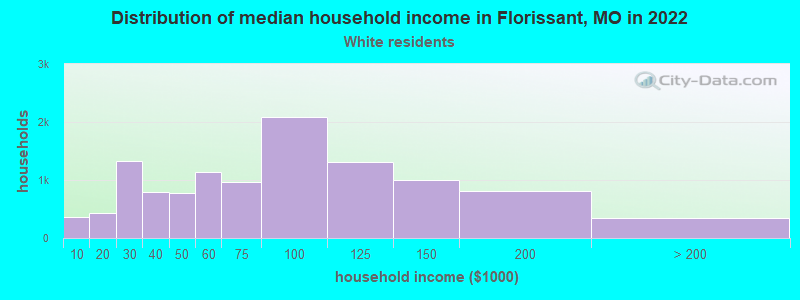
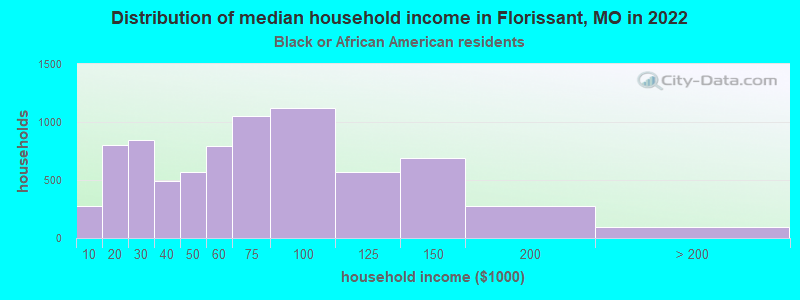
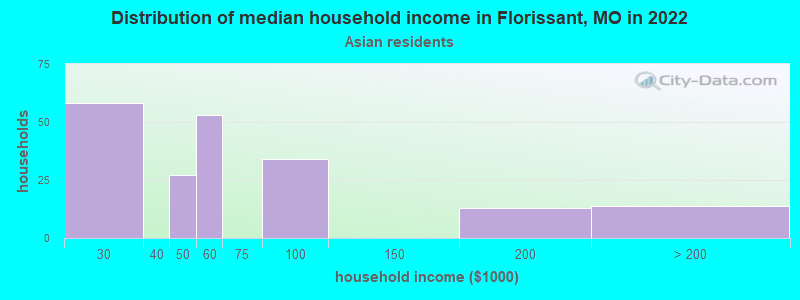
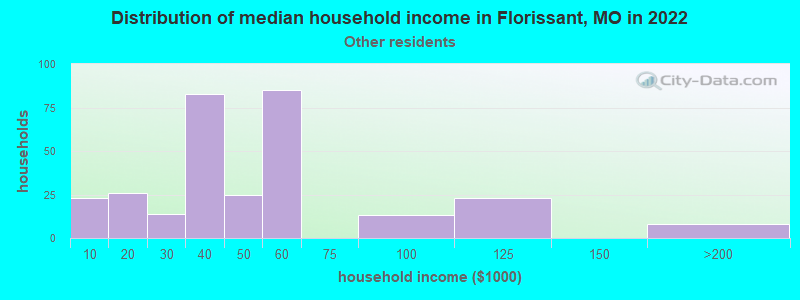
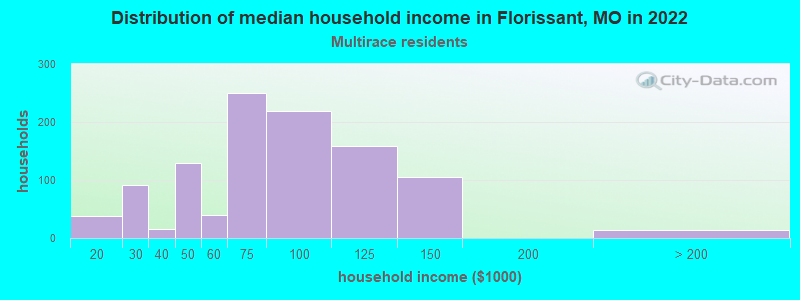
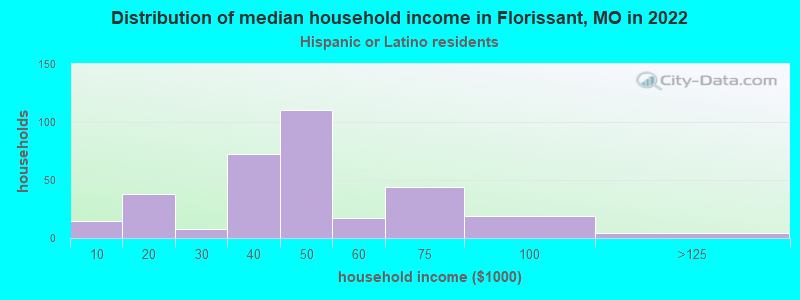
Income and house value in Florissant Median household income in 2022 $70,923 White non-Hispanic householders$61,851 Black householders$56,201 Asian householders$65,722 Some other race householders$64,642 Two or more races householders$45,181 Hispanic or Latino race householdersMedian 2022 house value $132,326 White Non-Hispanic householders$150,016 Black or African American householders$147,716 American Indian or Alaska Native householders $139,402 Asian householders$179,206 Some other race householders$131,972 Two or more races householders$123,657 Hispanic or Latino householders
Median age by race in Florissant
45.8 Median age for White residents45.8 45.8 32.8 Median age for Black or African American residents30.0 36.4 44.6 Median age for American Indian / Alaska Native residents-644,003,776.5 43.3 48.7 Median age for Asian residents46.5 57.3 -710,303,029.6 Median age for Native Hawaiian / Pacific Islander residents-1,449,781,657.9 -752,136,751.4 36.9 Median age for Other race residents37.3 13.5 20.2 Median age for Two or more races residents23.7 17.9 45.7 Median age for White alone residents45.8 45.7 41.1 Median age for Hispanic or Latino residents45.1 22.1
Owner/renter occupied households by race in Florissant
House owners and renters - White residents 9,024 79.8% Owner occupied2,290 20.2% Renter occupiedHouse owners and renters - Black or African American residents 3,491 45.6% Owner occupied4,159 54.4% Renter occupiedHouse owners and renters - American Indian / Alaska Native residents 6 100.0% Owner occupiedHouse owners and renters - Asian residents 107 54.6% Owner occupied89 45.4% Renter occupiedHouse owners and renters - Other race residents 220 95.9% Owner occupied9 4.1% Renter occupiedHouse owners and renters - Two or more races residents 712 62.2% Owner occupied432 37.8% Renter occupiedHouse owners and renters - White alone residents 9,028 79.5% Owner occupied2,322 20.5% Renter occupiedHouse owners and renters - Hispanic or Latino residents 295 96.5% Owner occupied11 3.5% Renter occupied
Language usage in Florissant
English speakers - Total 94.6% of residents of Florissant speak English at home.
2.5% of residents speak Spanish at home 346 28.5% Speak English very well867 71.5% Speak English less than very well2.9% of residents speak other language at home 955 65.9% Speak English very well494 34.1% Speak English less than very well
English speakers - Born in the United States 97.7% of residents of Florissant speak English at home.
1.6% of residents speak Spanish at home 26 14.7% Speak English very well151 85.3% Speak English less than very well0.9% of residents speak other language at home 92 100.0% Speak English very well
English speakers - Native, born elsewhere 78.6% of residents of Florissant speak English at home.
6.0% of residents speak Spanish at home 15 71.4% Speak English very well6 28.6% Speak English less than very well22.5% of residents speak other language at home 69 87.3% Speak English very well10 12.7% Speak English less than very well
English speakers - Foreign-born 15.6% of residents of Florissant speak English at home.
36.9% of residents speak Spanish at home 66 9.0% Speak English very well664 91.0% Speak English less than very well52.7% of residents speak other language at home 596 57.1% Speak English very well447 42.9% Speak English less than very well
White (Caucasian) - Speak only English Native:
98.7% (23,537)Foreign-born:
17.1% (70)
White (Caucasian) - Speak another language Native:
1.3% (318)Foreign-born:
84.0% (345)
Black or African American - Speak only English Native:
97.6% (18,214)Foreign-born:
18.3% (140)
Black or African American - Speak another language Native:
2.5% (461)Foreign-born:
77.9% (598)
Asian - Speak only English Native:
15.7% (22)Foreign-born:
36.6% (127)
Asian - Speak another language Native:
73.9% (105)Foreign-born:
69.0% (239)
Other race - Speak only English Native:
100.0% (493)Foreign-born:
3.2% (9)
Other race - Speak another language Native:
4.3% (21)Foreign-born:
89.2% (238)
Two or more races - Speak another language Native:
5.9% (233)Foreign-born:
100.0% (385)
White alone - Speak only English Native:
98.7% (23,590)Foreign-born:
21.9% (72)
White alone - Speak another language Native:
1.3% (309)Foreign-born:
78.4% (257)
Hispanic or Latino - Speak only English Native:
62.6% (289)Foreign-born:
0.6% (4)
Hispanic or Latino - Speak another language Native:
36.1% (166)Foreign-born:
100.0% (681)
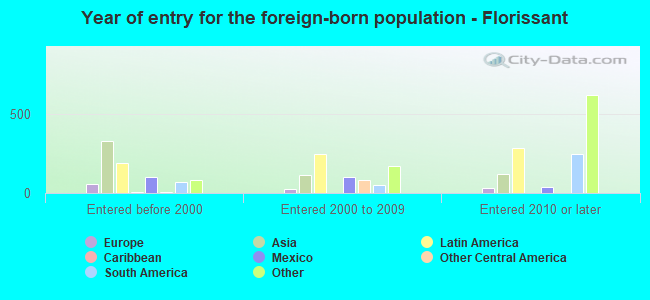
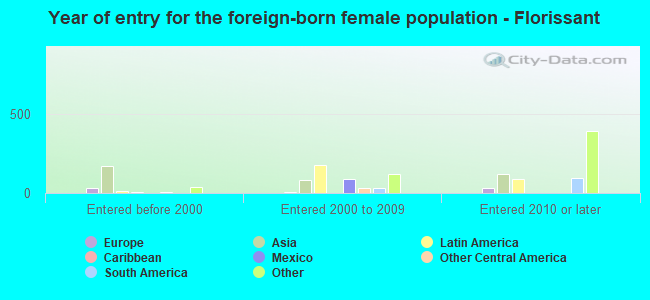
Foreign-born residents in Florissant 2,007 residents are foreign born (1.4% Africa , 1.2% Latin America , 1.1% Asia ).
This city:
3.9%Missouri:
4.2%
Marital status for residents in Florissant Marital status - White (Caucasian) population 15 years and over
Males 33.9% Never married49.5% Now married1.1% Separated3.1% Widowed12.4% DivorcedFemales 28.2% Never married46.7% Now married0.5% Separated11.3% Widowed13.3% DivorcedWomen who gave birth in the past 12 months Now married:
90.8% (266)Unmarried:
9.2% (27)
Women who did not give birth in the past 12 months Now married:
40.7% (2,004)Unmarried:
59.3% (2,919)
Marital status - Black or African American population 15 years and over
Males 52.1% Never married35.6% Now married2.1% Separated4.3% Widowed5.9% DivorcedFemales 45.8% Never married28.9% Now married5.7% Separated5.0% Widowed14.6% DivorcedWomen who gave birth in the past 12 months Now married:
54.0% (214)Unmarried:
46.0% (183)
Women who did not give birth in the past 12 months Now married:
26.6% (1,363)Unmarried:
73.4% (3,760)
Marital status - Asian population 15 years and over
Males 22.8% Never married77.2% Now married0.0% Separated0.0% Widowed0.0% DivorcedFemales 29.1% Never married29.5% Now married11.4% Separated16.9% Widowed13.0% DivorcedWomen who did not give birth in the past 12 months Now married:
21.6% (25)Unmarried:
78.4% (92)
Marital status - Other race population 15 years and over
Males 43.2% Never married28.8% Now married0.0% Separated3.7% Widowed24.4% DivorcedFemales 19.3% Never married45.5% Now married15.0% Separated1.1% Widowed19.3% DivorcedWomen who did not give birth in the past 12 months Now married:
69.1% (81)Unmarried:
30.9% (36)
Marital status - Two or more races population 15 years and over
Males 66.0% Never married30.4% Now married0.0% Separated0.0% Widowed3.6% DivorcedFemales 56.9% Never married29.7% Now married0.0% Separated0.8% Widowed12.6% DivorcedWomen who gave birth in the past 12 months Now married:
0.0% (0)Unmarried:
100.0% (103)
Women who did not give birth in the past 12 months Now married:
31.0% (383)Unmarried:
69.0% (853)
Marital status - White alone, not Hispanic / Latino population 15 years and over
Males 34.1% Never married49.3% Now married1.0% Separated3.1% Widowed12.5% DivorcedFemales 28.1% Never married46.6% Now married0.5% Separated11.4% Widowed13.4% DivorcedWomen who gave birth in the past 12 months Now married:
90.8% (268)Unmarried:
9.2% (27)
Women who did not give birth in the past 12 months Now married:
40.9% (2,019)Unmarried:
59.1% (2,921)
Marital status - Hispanic or Latino population 15 years and over
Males 29.0% Never married40.6% Now married2.1% Separated3.0% Widowed25.3% DivorcedFemales 48.0% Never married39.7% Now married0.0% Separated1.2% Widowed11.2% DivorcedWomen who did not give birth in the past 12 months Now married:
39.8% (134)Unmarried:
60.2% (203)
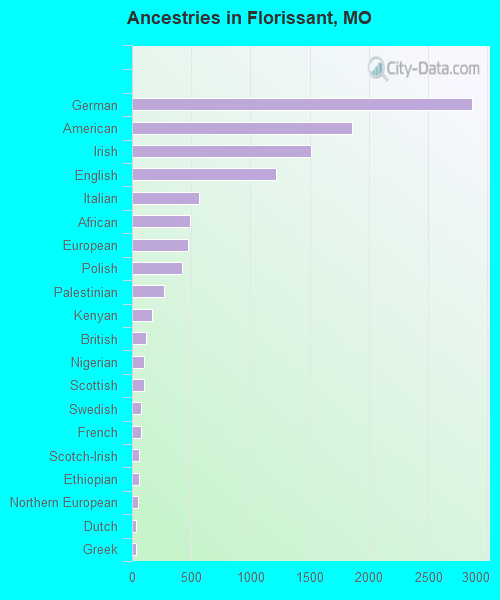
Ancestries in Florissant
2,871 11.1% German1,857 7.2% American1,509 5.8% Irish1,219 4.7% English568 2.2% Italian493 1.9% African469 1.8% European421 1.6% Polish266 1.0% Palestinian171 0.7% Kenyan114 0.4% British105 0.4% Nigerian103 0.4% Scottish80 0.3% Swedish76 0.3% French57 0.2% Scotch-Irish56 0.2% Ethiopian51 0.2% Northern European35 0.1% Dutch32 0.1% Greek26 0.1% Eastern European24 0.09% Czech21 0.08% Scandinavian20 0.08% French Canadian18 0.07% Liberian16 0.06% Russian12 0.05% Lebanese10 0.04% Welsh9 0.03% Portuguese9 0.03% Egyptian8 0.03% Belgian8 0.03% Austrian8 0.03% Yugoslavian6 0.02% Danish5 0.02% Croatian5 0.02% Slovak3 0.01% Arab
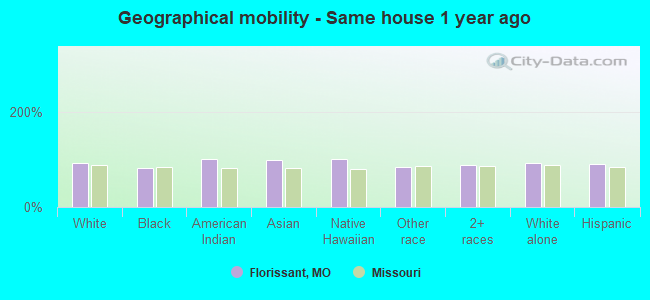
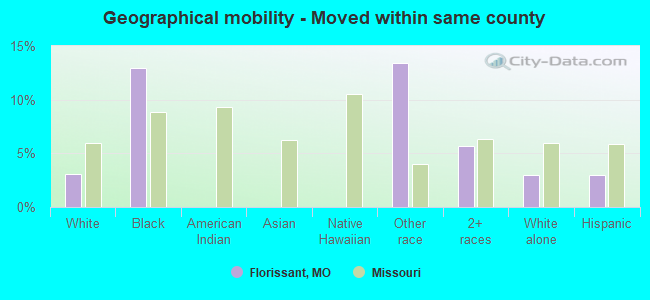
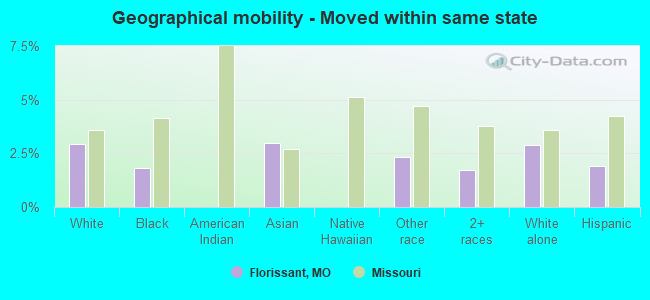
Geographical mobility in Florissant Same house 1 year ago 23,124 92.8% White (Caucasian)16,491 82.4% Black or African American18 100.0% American Indian / Alaska Native478 98.6% Asian12 100.0% Native Hawaiian / Pacific Islander724 83.3% Other race4,121 88.5% Two or more races23,173 93.0% White alone, not Hispanic / Latino1,038 89.7% Hispanic or LatinoMoved within same county 758 3.0% White / Caucasian2,594 13.0% Black or African American117 13.4% Other race265 5.7% Two or more races742 3.0% White alone, not Hispanic / Latino35 3.0% Hispanic or LatinoMoved within same state 727 2.9% White / Caucasian362 1.8% Black or African American14 3.0% Asian20 2.3% Other race80 1.7% Two or more races719 2.9% White alone, not Hispanic / Latino22 1.9% Hispanic or LatinoMoved from different state 398 1.6% White / Caucasian551 2.8% Black or African American8 0.9% Other race139 3.0% Two or more races399 1.6% White alone, not Hispanic / Latino34 2.9% Hispanic or LatinoMoved from abroad 152 0.8% Black or African American
Children Nativity (place of birth) in Florissant
Children under 6 years - Living with two parents Both parents native 1,776 99.1% Native17 0.9% Foreign-bornBoth parents foreign-born 146 80.3% Native36 19.7% Foreign-bornChildren under 6 years - Living with one parent Native parent 1,106 100.0% NativeForeign-born parent 45 100.0% NativeChildren 6 to 17 years - Living with two parents Both parents native 3,367 100.0% NativeBoth parents foreign-born 225 61.4% Native142 38.6% Foreign-bornOne native, one foreign-born parent 28 100.0% NativeChildren 6 to 17 years - Living with one parent Native parent 3,911 100.0% NativeForeign-born parent 173 48.6% Native183 51.4% Foreign-born
Grandparents responsible for own grandchildren in Florissant
Grandparents (30 to 59 years) White / Caucasian 108 95.8% Responsible for grandchildren5 4.2% Not responsible for grandchildrenBlack or African American 58 32.9% Responsible for grandchildren118 67.1% Not responsible for grandchildrenOther race 22 100.0% Not responsible for grandchildrenTwo or more races 5 100.0% Not responsible for grandchildrenWhite alone, not Hispanic / Latino 84 94.7% Responsible for grandchildren5 5.3% Not responsible for grandchildrenHispanic or Latino 59 100.0% Responsible for grandchildrenGrandparents (60 years and over) White / Caucasian 64 32.5% Responsible for grandchildren133 67.5% Not responsible for grandchildrenBlack or African American 57 28.1% Responsible for grandchildren146 71.9% Not responsible for grandchildrenOther race 26 100.0% Not responsible for grandchildrenWhite alone, not Hispanic / Latino 64 32.1% Responsible for grandchildren136 67.9% Not responsible for grandchildrenHispanic or Latino 6 100.0% Not responsible for grandchildren