Races in Fort Benning, Georgia (GA) Detailed Stats
Ancestries, Foreign-born residents, place of birth
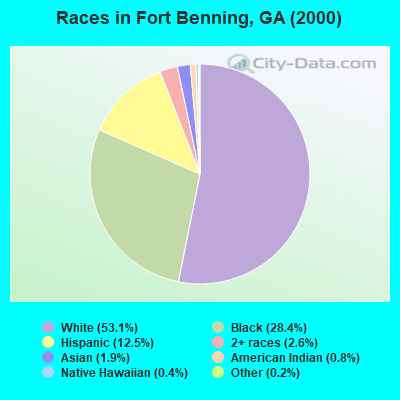
Race distribution in Fort Benning

- 6,40353.1%White alone
- 3,42228.4%Black alone
- 1,50812.5%Hispanic
- 3192.6%Two or more races
- 2281.9%Asian alone
- 910.8%American Indian alone
- 490.4%Native Hawaiian and Other
Pacific Islander alone - 300.2%Other race alone
2000
2022
-
- 5,128,66162.6%White alone
- 2,331,46528.5%Black alone
- 435,2275.3%Hispanic
- 171,5132.1%Asian alone
- 87,3641.1%Two or more races
- 17,6700.2%American Indian alone
- 11,2750.1%Other race alone
- 3,2780.04%Native Hawaiian and Other
Pacific Islander alone

-
- 5,415,65749.6%White alone
- 3,349,24030.7%Black alone
- 1,132,60410.4%Hispanic
- 479,1564.4%Asian alone
- 462,9234.2%Two or more races
- 54,4160.5%Other race alone
- 11,9230.1%American Indian alone
- 6,9570.06%Native Hawaiian and Other
Pacific Islander alone

Income and house value in Fort Benning
- Median household income in 2022
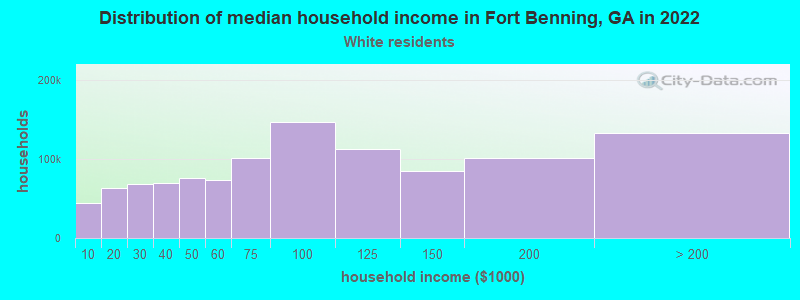
- $78,532White non-Hispanic householders
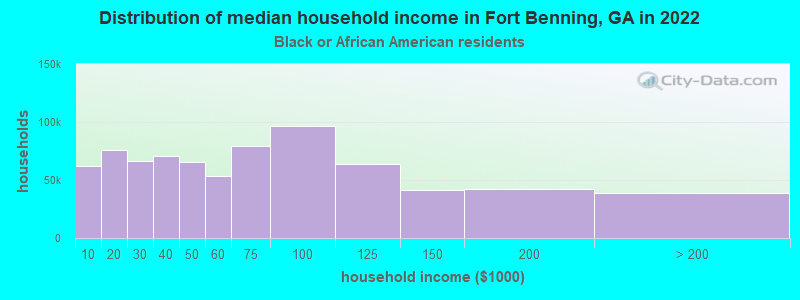
- $68,511Black householders
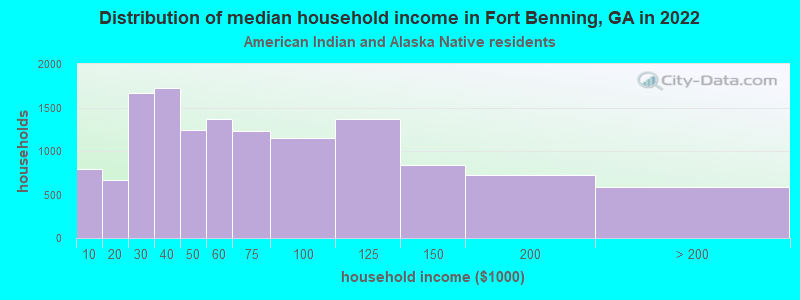
- $50,975American Indian and Alaska Native householders
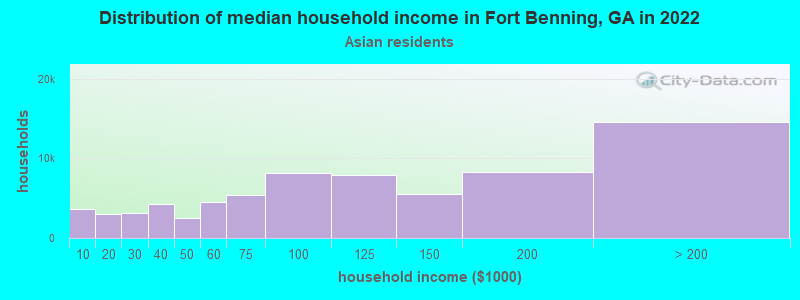
- $88,568Asian householders
- $47,823Some other race householders
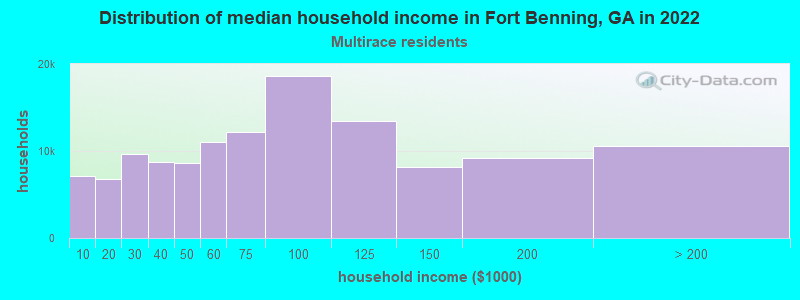
- $67,852Two or more races householders
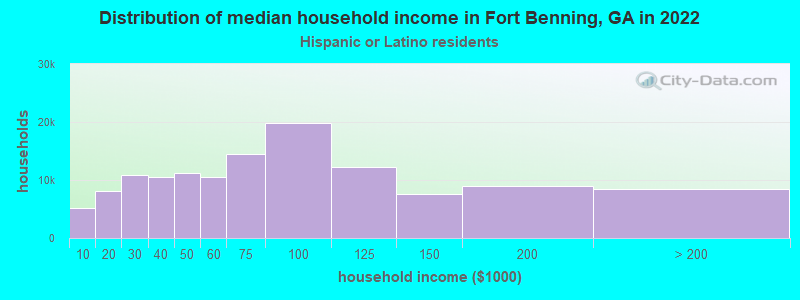
- $55,453Hispanic or Latino race householders
- Median 2022 house value
- $160,568White Non-Hispanic householders
- over $1,000,000Black or African American householders
Household income for White non-Hispanic householders
Household income for Black householders
Household income for American Indian and Alaska Native householders
Household income for Asian householders
Household income for Two or more races householders
Household income for Hispanic or Latino race householders
Zip code: 31805