Races in Fort Dodge, Iowa (IA) Detailed Stats
Data:
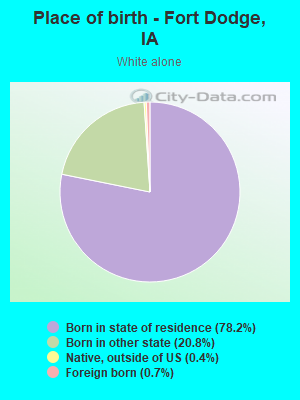
Races - White alone (%)
Races - White alone (% change since 2000)
Races - Black alone (%)
Races - Black alone (% change since 2000)
Races - American Indian alone (%)
Races - American Indian alone (% change since 2000)
Races - Asian alone (%)
Races - Asian alone (% change since 2000)
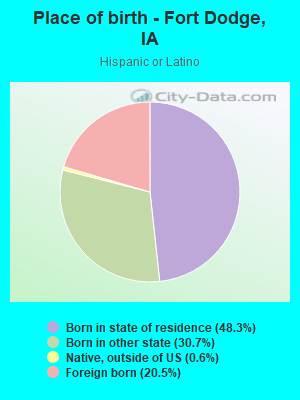
Races - Hispanic (%)
Races - Hispanic (% change since 2000)
Races - Native Hawaiian and Other Pacific Islander alone (%)
Races - Native Hawaiian and Other Pacific Islander alone (% change since 2000)
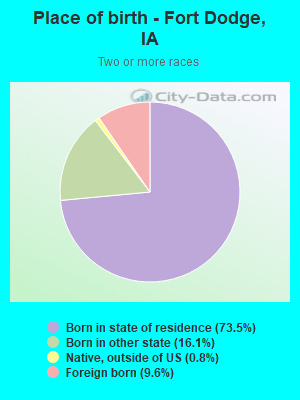
Races - Two or more races(%)
Races - Two or more races(% change since 2000)
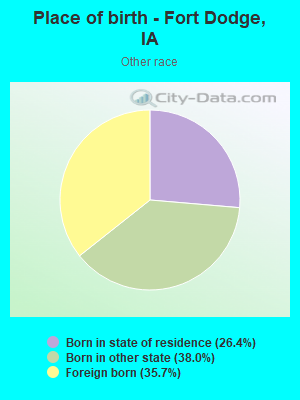
Races - Other race alone (%)
Races - Other race alone (% change since 2000)
Racial diversity
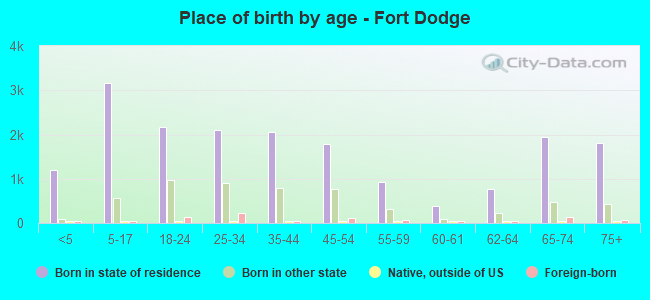
Place of birth - Born in state of residence (%)
Place of birth - Born in state of residence (%) - White
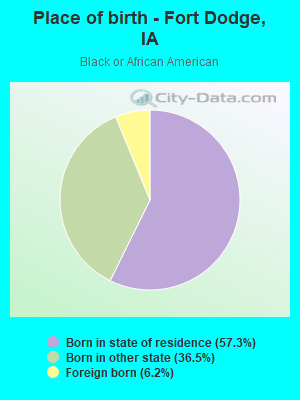
Place of birth - Born in state of residence (%) - Black or African American
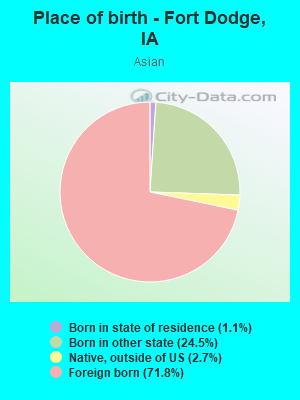
Place of birth - Born in state of residence (%) - Asian
Place of birth - Born in state of residence (%) - Hispanic or Latino
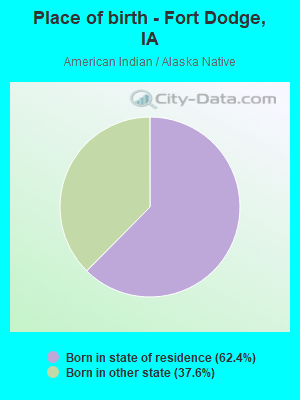
Place of birth - Born in state of residence (%) - American Indian and Alaska Native
Place of birth - Born in state of residence (%) - Multirace
Place of birth - Born in state of residence (%) - Other Race
Place of birth - Born in other state (%)
Place of birth - Born in other state (%) - White
Place of birth - Born in other state (%) - Black or African American
Place of birth - Born in other state (%) - Asian
Place of birth - Born in other state (%) - Hispanic or Latino
Place of birth - Born in other state (%) - American Indian and Alaska Native
Place of birth - Born in other state (%) - Multirace
Place of birth - Born in other state (%) - Other Race
Place of birth - Native, outside of US (%)
Place of birth - Native, outside of US (%) - White
Place of birth - Native, outside of US (%) - Black or African American
Place of birth - Native, outside of US (%) - Asian
Place of birth - Native, outside of US (%) - Hispanic or Latino
Place of birth - Native, outside of US (%) - American Indian and Alaska Native
Place of birth - Native, outside of US (%) - Multirace
Place of birth - Native, outside of US (%) - Other Race
Place of birth - Foreign born (%)
Place of birth - Foreign born (%) - White
Place of birth - Foreign born (%) - Black or African American
Place of birth - Foreign born (%) - Asian
Place of birth - Foreign born (%) - Hispanic or Latino
Place of birth - Foreign born (%) - American Indian and Alaska Native
Place of birth - Foreign born (%) - Multirace
Place of birth - Foreign born (%) - Other Race
Residents speaking English at home (%)
Residents speaking English at home - Born in the United States (%)
Residents speaking English at home - Native, born elsewhere (%)
Residents speaking English at home - Foreign born (%)
Residents speaking Spanish at home (%)
Residents speaking Spanish at home - Born in the United States (%)
Residents speaking Spanish at home - Native, born elsewhere (%)
Residents speaking Spanish at home - Foreign born (%)
Residents speaking other language at home (%)
Residents speaking other language at home - Born in the United States (%)
Residents speaking other language at home - Native, born elsewhere (%)
Residents speaking other language at home - Foreign born (%)
Marital status - Never married (%)
Marital status - Now married (%)
Marital status - Separated (%)
Marital status - Widowed (%)
Marital status - Divorced (%)
Ancestries Reported - Arab (%)
Ancestries Reported - Czech (%)
Ancestries Reported - Danish (%)
Ancestries Reported - Dutch (%)
Ancestries Reported - English (%)
Ancestries Reported - French (%)
Ancestries Reported - French Canadian (%)
Ancestries Reported - German (%)
Ancestries Reported - Greek (%)
Ancestries Reported - Hungarian (%)
Ancestries Reported - Irish (%)
Ancestries Reported - Italian (%)
Ancestries Reported - Lithuanian (%)
Ancestries Reported - Norwegian (%)
Ancestries Reported - Polish (%)
Ancestries Reported - Portuguese (%)
Ancestries Reported - Russian (%)
Ancestries Reported - Scotch-Irish (%)
Ancestries Reported - Scottish (%)
Ancestries Reported - Slovak (%)
Ancestries Reported - Subsaharan African (%)
Ancestries Reported - Swedish (%)
Ancestries Reported - Swiss (%)
Ancestries Reported - Ukrainian (%)
Ancestries Reported - United States (%)
Ancestries Reported - Welsh (%)
Ancestries Reported - West Indian (%)
Ancestries Reported - Other (%)
Geographical mobility - Same house 1 year ago (%)
Geographical mobility - Same house 1 year ago (%) - White
Geographical mobility - Same house 1 year ago (%) - Black or African American
Geographical mobility - Same house 1 year ago (%) - Asian
Geographical mobility - Same house 1 year ago (%) - Hispanic or Latino
Geographical mobility - Same house 1 year ago (%) - American Indian and Alaska Native
Geographical mobility - Same house 1 year ago (%) - Multirace
Geographical mobility - Same house 1 year ago (%) - Other Race
Geographical mobility - Moved within same county (%)
Geographical mobility - Moved within same county (%) - White
Geographical mobility - Moved within same county (%) - Black or African American
Geographical mobility - Moved within same county (%) - Asian
Geographical mobility - Moved within same county (%) - Hispanic or Latino
Geographical mobility - Moved within same county (%) - American Indian and Alaska Native
Geographical mobility - Moved within same county (%) - Multirace
Geographical mobility - Moved within same county (%) - Other Race
Geographical mobility - Moved from different county within same state (%)
Geographical mobility - Moved from different county within same state (%) - White
Geographical mobility - Moved from different county within same state (%) - Black or African American
Geographical mobility - Moved from different county within same state (%) - Asian
Geographical mobility - Moved from different county within same state (%) - Hispanic or Latino
Geographical mobility - Moved from different county within same state (%) - American Indian and Alaska Native
Geographical mobility - Moved from different county within same state (%) - Multirace
Geographical mobility - Moved from different county within same state (%) - Other Race
Geographical mobility - Moved from different state (%)
Geographical mobility - Moved from different state (%) - White
Geographical mobility - Moved from different state (%) - Black or African American
Geographical mobility - Moved from different state (%) - Asian
Geographical mobility - Moved from different state (%) - Hispanic or Latino
Geographical mobility - Moved from different state (%) - American Indian and Alaska Native
Geographical mobility - Moved from different state (%) - Multirace
Geographical mobility - Moved from different state (%) - Other Race
Geographical mobility - Moved from abroad (%)
Geographical mobility - Moved from abroad (%) - White
Geographical mobility - Moved from abroad (%) - Black or African American
Geographical mobility - Moved from abroad (%) - Asian
Geographical mobility - Moved from abroad (%) - Hispanic or Latino
Geographical mobility - Moved from abroad (%) - American Indian and Alaska Native
Geographical mobility - Moved from abroad (%) - Multirace
Geographical mobility - Moved from abroad (%) - Other Race
Place of birth for the foreign-born population - Ireland (%)
Place of birth for the foreign-born population - Denmark (%)
Place of birth for the foreign-born population - Norway (%)
Place of birth for the foreign-born population - Sweden (%)
Place of birth for the foreign-born population - United Kingdom (%)
Place of birth for the foreign-born population - England (%)
Place of birth for the foreign-born population - Scotland (%)
Place of birth for the foreign-born population - Other Northern Europe (%)
Place of birth for the foreign-born population - Austria (%)
Place of birth for the foreign-born population - Belgium (%)
Place of birth for the foreign-born population - France (%)
Place of birth for the foreign-born population - Germany (%)
Place of birth for the foreign-born population - Netherlands (%)
Place of birth for the foreign-born population - Switzerland (%)
Place of birth for the foreign-born population - Other Western Europe (%)
Place of birth for the foreign-born population - Greece (%)
Place of birth for the foreign-born population - Italy (%)
Place of birth for the foreign-born population - Portugal (%)
Place of birth for the foreign-born population - Spain (%)
Place of birth for the foreign-born population - Other Southern Europe (%)
Place of birth for the foreign-born population - Albania (%)
Place of birth for the foreign-born population - Belarus (%)
Place of birth for the foreign-born population - Bosnia and Herzegovina (%)
Place of birth for the foreign-born population - Bulgaria (%)
Place of birth for the foreign-born population - Croatia (%)
Place of birth for the foreign-born population - Czechoslovakia (%)
Place of birth for the foreign-born population - Hungary (%)
Place of birth for the foreign-born population - Latvia (%)
Place of birth for the foreign-born population - Lithuania (%)
Place of birth for the foreign-born population - North Macedonia (Macedonia) (%)
Place of birth for the foreign-born population - Moldova (%)
Place of birth for the foreign-born population - Poland (%)
Place of birth for the foreign-born population - Romania (%)
Place of birth for the foreign-born population - Russia (%)
Place of birth for the foreign-born population - Serbia (%)
Place of birth for the foreign-born population - Ukraine (%)
Place of birth for the foreign-born population - Other Eastern Europe (%)
Place of birth for the foreign-born population - China (%)
Place of birth for the foreign-born population - Hong Kong (%)
Place of birth for the foreign-born population - Taiwan (%)
Place of birth for the foreign-born population - Japan (%)
Place of birth for the foreign-born population - Korea (%)
Place of birth for the foreign-born population - Other Eastern Asia (%)
Place of birth for the foreign-born population - Afghanistan (%)
Place of birth for the foreign-born population - Bangladesh (%)
Place of birth for the foreign-born population - India (%)
Place of birth for the foreign-born population - Iran (%)
Place of birth for the foreign-born population - Kazakhstan (%)
Place of birth for the foreign-born population - Nepal (%)
Place of birth for the foreign-born population - Pakistan (%)
Place of birth for the foreign-born population - Sri Lanka (%)
Place of birth for the foreign-born population - Uzbekistan (%)
Place of birth for the foreign-born population - Other South Central Asia (%)
Place of birth for the foreign-born population - Burma (%)
Place of birth for the foreign-born population - Cambodia (%)
Place of birth for the foreign-born population - Indonesia (%)
Place of birth for the foreign-born population - Laos (%)
Place of birth for the foreign-born population - Malaysia (%)
Place of birth for the foreign-born population - Philippines (%)
Place of birth for the foreign-born population - Singapore (%)
Place of birth for the foreign-born population - Thailand (%)
Place of birth for the foreign-born population - Vietnam (%)
Place of birth for the foreign-born population - Other South Eastern Asia (%)
Place of birth for the foreign-born population - Armenia (%)
Place of birth for the foreign-born population - Iraq (%)
Place of birth for the foreign-born population - Israel (%)
Place of birth for the foreign-born population - Jordan (%)
Place of birth for the foreign-born population - Kuwait (%)
Place of birth for the foreign-born population - Lebanon (%)
Place of birth for the foreign-born population - Saudi Arabia (%)
Place of birth for the foreign-born population - Syria (%)
Place of birth for the foreign-born population - Turkey (%)
Place of birth for the foreign-born population - Yemen (%)
Place of birth for the foreign-born population - Other Western Asia (%)
Place of birth for the foreign-born population - Eritrea (%)
Place of birth for the foreign-born population - Ethiopia (%)
Place of birth for the foreign-born population - Kenya (%)
Place of birth for the foreign-born population - Somalia (%)
Place of birth for the foreign-born population - Uganda (%)
Place of birth for the foreign-born population - Zimbabwe (%)
Place of birth for the foreign-born population - Other Eastern Africa (%)
Place of birth for the foreign-born population - Cameroon (%)
Place of birth for the foreign-born population - Congo (%)
Place of birth for the foreign-born population - Democratic Republic of Congo (Zaire) (%)
Place of birth for the foreign-born population - Other Middle Africa (%)
Place of birth for the foreign-born population - Egypt (%)
Place of birth for the foreign-born population - Morocco (%)
Place of birth for the foreign-born population - Sudan (%)
Place of birth for the foreign-born population - Other Northern Africa (%)
Place of birth for the foreign-born population - South Africa (%)
Place of birth for the foreign-born population - Other Southern Africa (%)
Place of birth for the foreign-born population - Cabo Verde (%)
Place of birth for the foreign-born population - Ghana (%)
Place of birth for the foreign-born population - Liberia (%)
Place of birth for the foreign-born population - Nigeria (%)
Place of birth for the foreign-born population - Senegal (%)
Place of birth for the foreign-born population - Sierra Leone (%)
Place of birth for the foreign-born population - Other Western Africa (%)
Place of birth for the foreign-born population - Australia (%)
Place of birth for the foreign-born population - New Zealand (%)
Place of birth for the foreign-born population - Fiji (%)
Place of birth for the foreign-born population - Micronesia (%)
Place of birth for the foreign-born population - Bahamas (%)
Place of birth for the foreign-born population - Barbados (%)
Place of birth for the foreign-born population - Cuba (%)
Place of birth for the foreign-born population - Dominica (%)
Place of birth for the foreign-born population - Dominican Republic (%)
Place of birth for the foreign-born population - Grenada (%)
Place of birth for the foreign-born population - Haiti (%)
Place of birth for the foreign-born population - Jamaica (%)
Place of birth for the foreign-born population - St. Vincent and the Grenadines (%)
Place of birth for the foreign-born population - Trinidad and Tobago (%)
Place of birth for the foreign-born population - West Indies (%)
Place of birth for the foreign-born population - Other Caribbean (%)
Place of birth for the foreign-born population - Belize (%)
Place of birth for the foreign-born population - Costa Rica (%)
Place of birth for the foreign-born population - El Salvador (%)
Place of birth for the foreign-born population - Guatemala (%)
Place of birth for the foreign-born population - Honduras (%)
Place of birth for the foreign-born population - Mexico (%)
Place of birth for the foreign-born population - Nicaragua (%)
Place of birth for the foreign-born population - Panama (%)
Place of birth for the foreign-born population - Other Central America (%)
Place of birth for the foreign-born population - Argentina (%)
Place of birth for the foreign-born population - Bolivia (%)
Place of birth for the foreign-born population - Brazil (%)
Place of birth for the foreign-born population - Chile (%)
Place of birth for the foreign-born population - Colombia (%)
Place of birth for the foreign-born population - Ecuador (%)
Place of birth for the foreign-born population - Guyana (%)
Place of birth for the foreign-born population - Peru (%)
Place of birth for the foreign-born population - Uruguay (%)
Place of birth for the foreign-born population - Venezuela (%)
Place of birth for the foreign-born population - Other South America (%)
Place of birth for the foreign-born population - Canada (%)
Place of birth for the foreign-born population - Other Northern America (%)
Place of birth for the foreign-born population - Other (%)
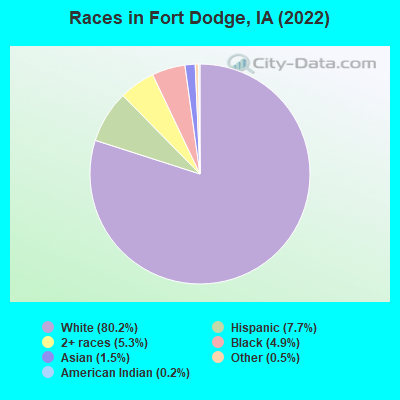
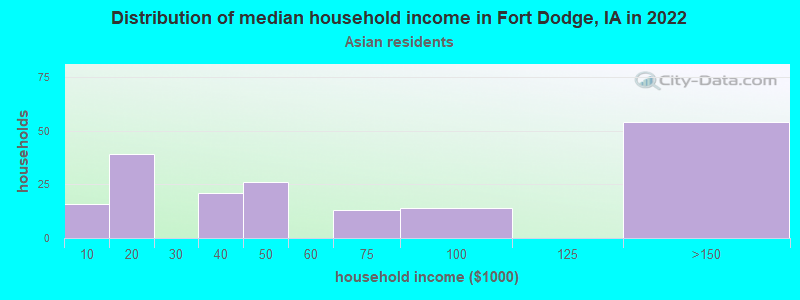
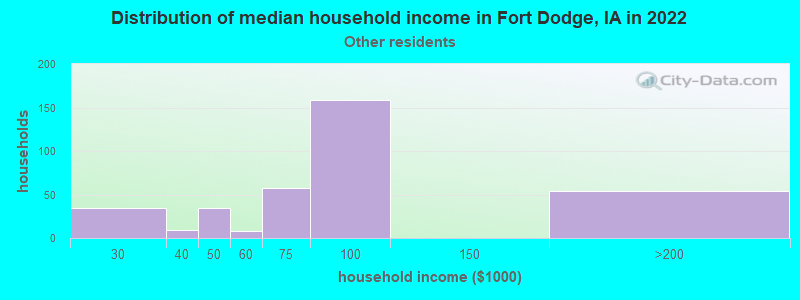
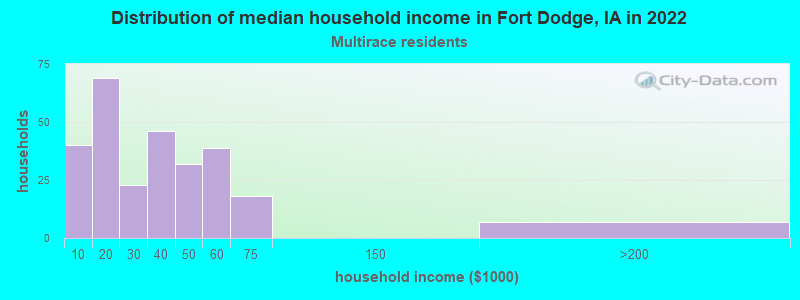
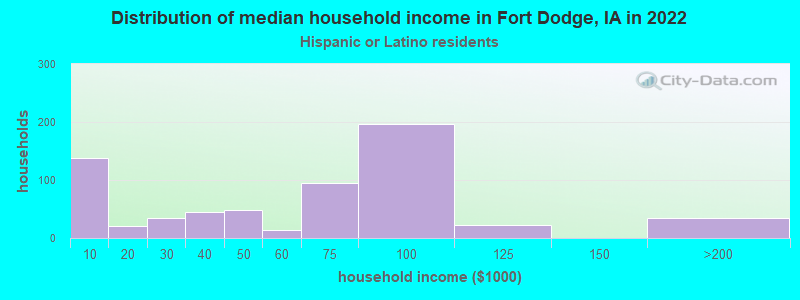
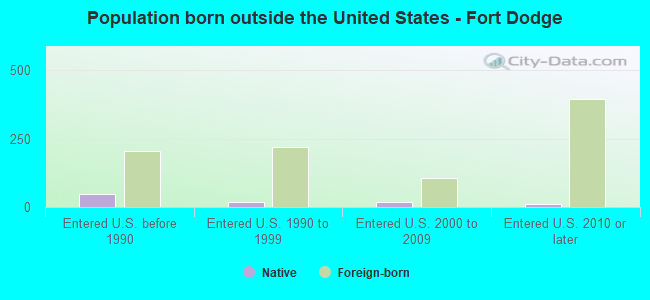
According to 2022 data, the most numerous races in Fort Dodge, IA are White alone (19,991 residents), Hispanic (1,915 residents), and Black alone (1,224 residents). 93.8% of Fort Dodge residents speak English at home. 3.5% of Fort Dodge, IA residents are foreign-born (1.5% born in Latin America, 1.1% born in Asia, 0.5% born in North America), which is 41.1% less than the foreign-born rate of 5.0% across the entire state of Iowa.
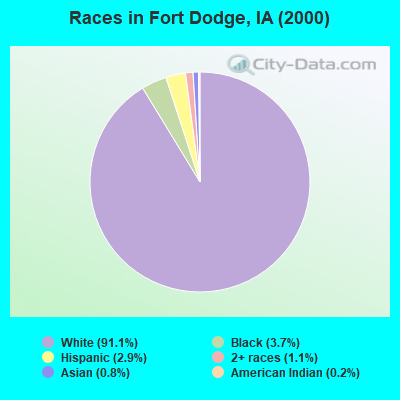
Race distribution in Fort Dodge
2000 2022
2,710,344 92.6% White alone 82,473 2.8% Hispanic 60,744 2.1% Black alone 36,345 1.2% Asian alone 25,472 0.9% Two or more races 7,955 0.3% American Indian alone 2,103 0.07% Other race alone 888 0.03% Native Hawaiian and Other
2,650,110 82.8% White alone 218,024 6.8% Hispanic 119,004 3.7% Black alone 115,286 3.6% Two or more races 74,892 2.3% Asian alone 9,260 0.3% Other race alone 8,595 0.3% Native Hawaiian and Other 5,346 0.2% American Indian alone
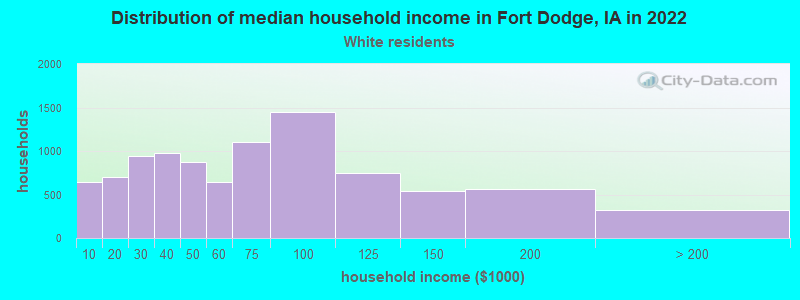
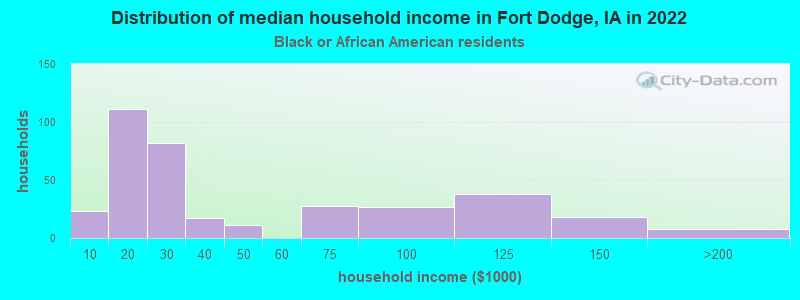
Income and house value in Fort Dodge Median household income in 2022 $59,953 White non-Hispanic householders$77,787 Some other race householders$31,560 Two or more races householders$73,948 Hispanic or Latino race householdersMedian 2022 house value $137,000 White Non-Hispanic householders$92,506 Black or African American householders$263,861 American Indian or Alaska Native householders $182,736 Asian householders$93,127 Native Hawaiian and other Pacific Islander householders$87,953 Some other race householders$62,085 Two or more races householders$104,923 Hispanic or Latino householders
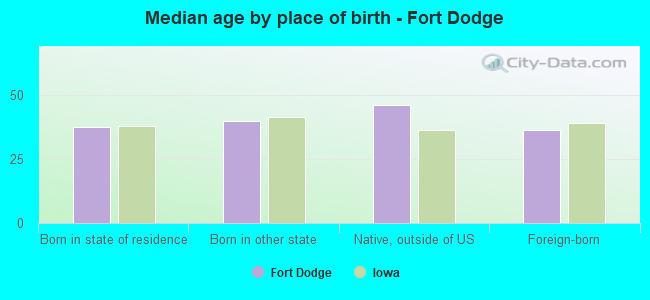
Median age by race in Fort Dodge
40.8 Median age for White residents36.9 44.4 28.4 Median age for Black or African American residents28.4 28.6 32.4 Median age for American Indian / Alaska Native residents32.0 -670,912,950.5 47.2 Median age for Asian residents47.4 70.8 -580,729,166.1 Median age for Native Hawaiian / Pacific Islander residents-776,978,416.5 -504,347,825.6 24.0 Median age for Other race residents21.9 24.2 20.4 Median age for Two or more races residents22.5 20.1 40.8 Median age for White alone residents37.8 43.6 25.5 Median age for Hispanic or Latino residents25.6 25.9
Owner/renter occupied households by race in Fort Dodge
House owners and renters - White residents 6,329 66.9% Owner occupied3,128 33.1% Renter occupiedHouse owners and renters - Black or African American residents 121 32.4% Owner occupied252 67.6% Renter occupiedHouse owners and renters - American Indian / Alaska Native residents 4 100.0% Owner occupiedHouse owners and renters - Asian residents 68 34.6% Owner occupied129 65.4% Renter occupiedHouse owners and renters - Other race residents 187 53.9% Owner occupied160 46.1% Renter occupiedHouse owners and renters - Two or more races residents 92 34.7% Owner occupied173 65.3% Renter occupiedHouse owners and renters - White alone residents 6,216 67.0% Owner occupied3,064 33.0% Renter occupiedHouse owners and renters - Hispanic or Latino residents 336 54.4% Owner occupied281 45.6% Renter occupied
Language usage in Fort Dodge
English speakers - Total 93.8% of residents of Fort Dodge speak English at home.
3.4% of residents speak Spanish at home 674 85.0% Speak English very well119 15.0% Speak English less than very well2.7% of residents speak other language at home 208 32.9% Speak English very well424 67.1% Speak English less than very well
English speakers - Born in the United States 91.2% of residents of Fort Dodge speak English at home.
6.1% of residents speak Spanish at home 339 100.0% Speak English very well2.3% of residents speak other language at home 43 33.9% Speak English very well84 66.1% Speak English less than very well
English speakers - Native, born elsewhere 97.0% of residents of Fort Dodge speak English at home.
4.0% of residents speak Spanish at home 4 100.0% Speak English very well7.1% of residents speak other language at home 7 100.0% Speak English less than very well
English speakers - Foreign-born 18.2% of residents of Fort Dodge speak English at home.
32.1% of residents speak Spanish at home 166 58.5% Speak English very well118 41.5% Speak English less than very well48.9% of residents speak other language at home 158 36.5% Speak English very well275 63.5% Speak English less than very well
White (Caucasian) - Speak only English Native:
98.8% (19,058)Foreign-born:
13.5% (14)
White (Caucasian) - Speak another language Native:
1.4% (265)Foreign-born:
83.0% (88)
Black or African American - Speak only English Native:
94.8% (1,012)Foreign-born:
15.2% (11)
Black or African American - Speak another language Native:
5.2% (56)Foreign-born:
84.7% (63)
Asian - Speak only English Native:
100.0% (110)Foreign-born:
23.3% (66)
Other race - Speak only English Native:
50.9% (283)Foreign-born:
8.2% (28)
Other race - Speak another language Native:
48.6% (270)Foreign-born:
90.5% (307)
Two or more races - Speak only English Native:
92.0% (1,704)Foreign-born:
42.9% (66)
Two or more races - Speak another language Native:
5.3% (99)Foreign-born:
61.7% (95)
White alone - Speak only English Native:
99.2% (18,759)Foreign-born:
11.3% (15)
White alone - Speak another language Native:
0.8% (145)Foreign-born:
89.0% (118)
Hispanic or Latino - Speak only English Native:
68.1% (955)Foreign-born:
18.2% (64)
Hispanic or Latino - Speak another language Native:
33.6% (472)Foreign-born:
79.9% (281)
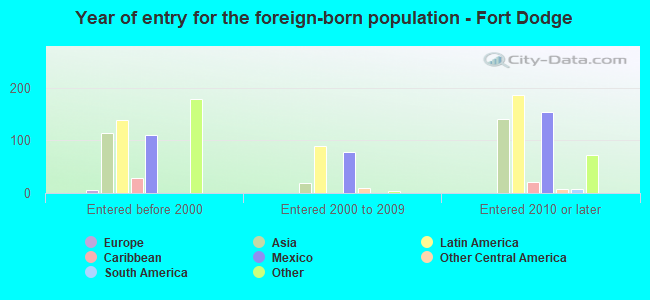
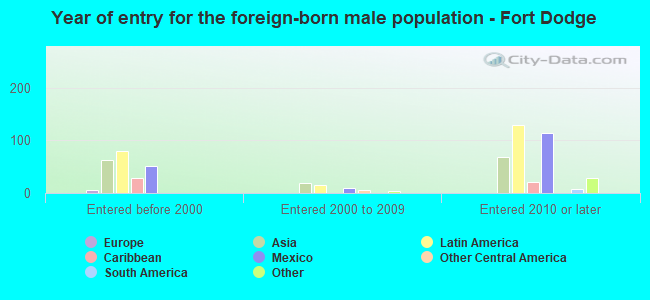
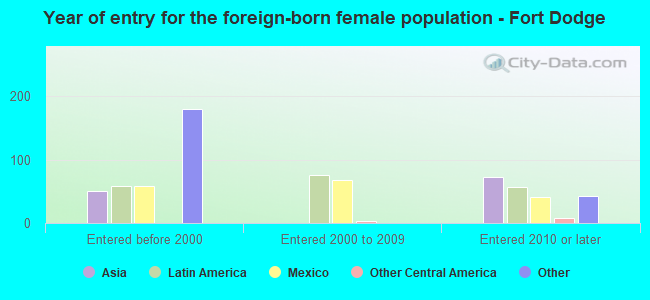
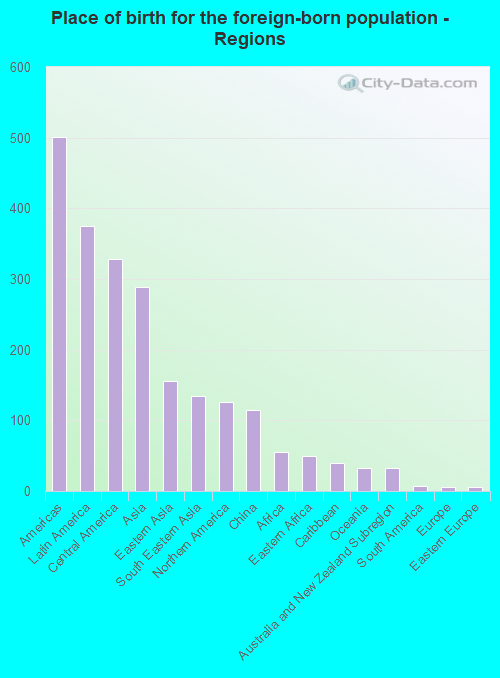
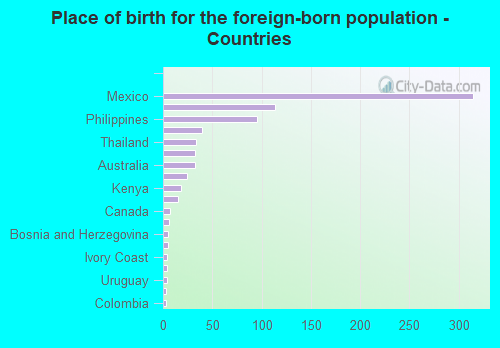
Foreign-born residents in Fort Dodge 884 residents are foreign born (1.5% Latin America , 1.1% Asia , 0.5% North America ).
Marital status for residents in Fort Dodge Marital status - White (Caucasian) population 15 years and over
Males 40.1% Never married41.1% Now married1.3% Separated3.4% Widowed14.2% DivorcedFemales 29.7% Never married37.5% Now married1.2% Separated14.3% Widowed17.3% DivorcedWomen who gave birth in the past 12 months Now married:
67.0% (227)Unmarried:
33.0% (112)
Women who did not give birth in the past 12 months Now married:
34.4% (1,318)Unmarried:
65.6% (2,513)
Marital status - Black or African American population 15 years and over
Males 86.3% Never married8.9% Now married0.0% Separated0.6% Widowed4.2% DivorcedFemales 61.1% Never married20.5% Now married4.3% Separated1.4% Widowed12.6% DivorcedWomen who gave birth in the past 12 months Now married:
0.0% (0)Unmarried:
100.0% (62)
Women who did not give birth in the past 12 months Now married:
14.1% (28)Unmarried:
85.9% (172)
Marital status - American Indian / Alaska Native population 15 years and over
Males 57.6% Never married0.0% Now married42.4% Separated0.0% Widowed0.0% DivorcedFemales 0.0% Never married60.0% Now married40.0% Separated0.0% Widowed0.0% DivorcedWomen who did not give birth in the past 12 months Now married:
100.0% (2)Unmarried:
0.0% (0)
Marital status - Asian population 15 years and over
Males 35.9% Never married22.0% Now married0.0% Separated0.0% Widowed42.2% DivorcedFemales 0.0% Never married66.7% Now married0.0% Separated24.8% Widowed8.6% DivorcedWomen who did not give birth in the past 12 months Now married:
100.0% (12)Unmarried:
0.0% (0)
Marital status - Other race population 15 years and over
Males 58.0% Never married33.4% Now married0.0% Separated1.3% Widowed7.3% DivorcedFemales 26.7% Never married50.0% Now married0.0% Separated13.8% Widowed9.5% DivorcedWomen who did not give birth in the past 12 months Now married:
64.6% (132)Unmarried:
35.4% (73)
Marital status - Two or more races population 15 years and over
Males 51.8% Never married25.3% Now married3.1% Separated0.0% Widowed19.7% DivorcedFemales 80.3% Never married12.4% Now married0.0% Separated2.3% Widowed4.9% DivorcedWomen who did not give birth in the past 12 months Now married:
6.3% (34)Unmarried:
93.7% (507)
Marital status - White alone, not Hispanic / Latino population 15 years and over
Males 39.9% Never married40.9% Now married1.4% Separated3.5% Widowed14.3% DivorcedFemales 29.9% Never married37.7% Now married1.2% Separated14.5% Widowed16.6% DivorcedWomen who gave birth in the past 12 months Now married:
67.0% (231)Unmarried:
33.0% (114)
Women who did not give birth in the past 12 months Now married:
34.0% (1,293)Unmarried:
66.0% (2,505)
Marital status - Hispanic or Latino population 15 years and over
Males 42.9% Never married45.5% Now married0.0% Separated0.7% Widowed10.9% DivorcedFemales 32.0% Never married36.6% Now married0.0% Separated9.0% Widowed22.4% DivorcedWomen who did not give birth in the past 12 months Now married:
48.5% (177)Unmarried:
51.5% (188)
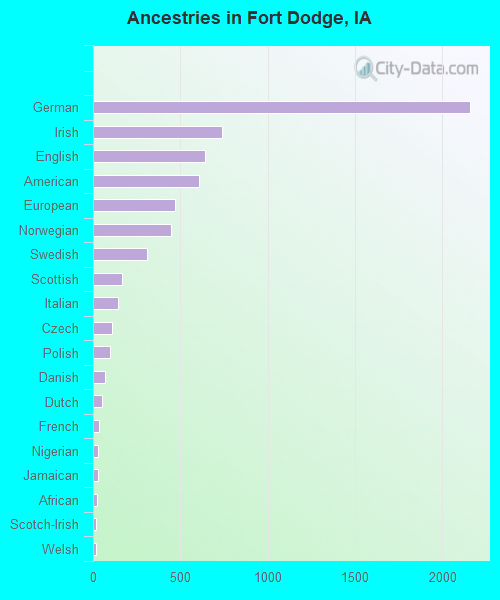
Ancestries in Fort Dodge
2,161 23.0% German739 7.9% Irish644 6.8% English606 6.4% American467 5.0% European449 4.8% Norwegian309 3.3% Swedish169 1.8% Scottish141 1.5% Italian111 1.2% Czech99 1.1% Polish71 0.8% Danish49 0.5% Dutch35 0.4% French31 0.3% Nigerian30 0.3% Jamaican25 0.3% African20 0.2% Scotch-Irish20 0.2% Welsh17 0.2% Lithuanian16 0.2% Lebanese16 0.2% Kenyan15 0.2% British12 0.1% Northern European8 0.08% Canadian7 0.07% Swiss5 0.05% Russian5 0.05% Scandinavian4 0.04% West Indian3 0.03% Somali2 0.02% Australian2 0.02% Hungarian
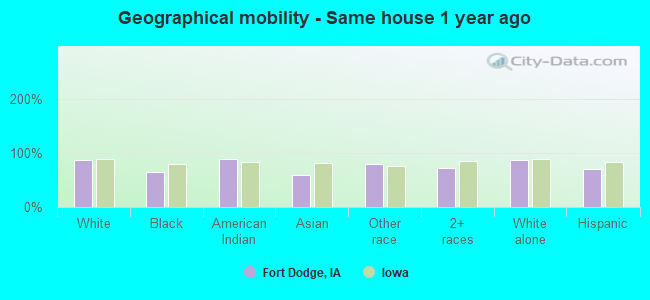
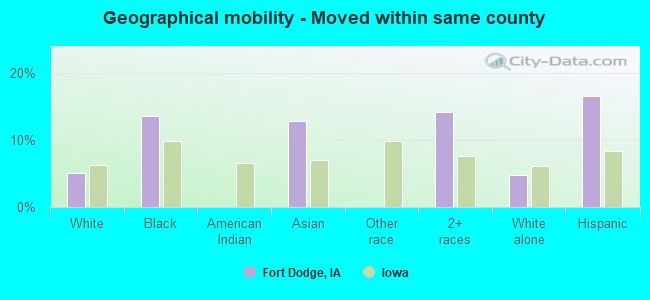
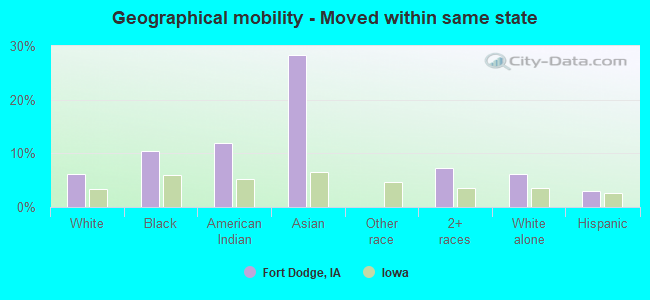
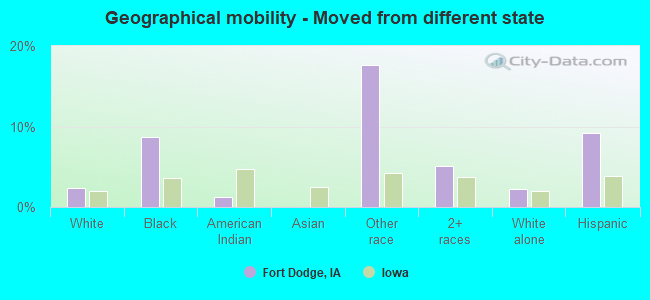
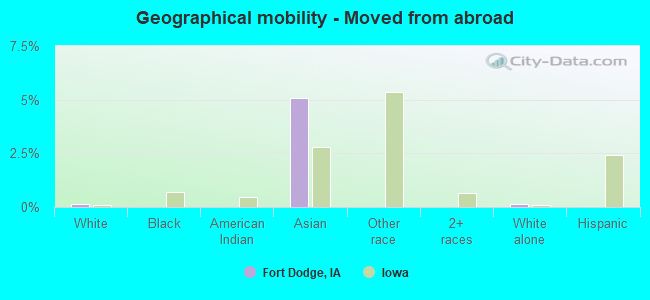
Geographical mobility in Fort Dodge Same house 1 year ago 17,331 86.3% White (Caucasian)788 64.2% Black or African American71 87.7% American Indian / Alaska Native230 59.3% Asian735 79.3% Other race1,549 71.1% Two or more races17,108 86.7% White alone, not Hispanic / Latino1,340 69.9% Hispanic or LatinoMoved within same county 1,027 5.1% White / Caucasian167 13.6% Black or African American49 12.8% Asian307 14.1% Two or more races945 4.8% White alone, not Hispanic / Latino317 16.6% Hispanic or LatinoMoved within same state 1,224 6.1% White / Caucasian128 10.4% Black or African American10 11.9% American Indian / Alaska Native110 28.3% Asian158 7.2% Two or more races1,204 6.1% White alone, not Hispanic / Latino56 2.9% Hispanic or LatinoMoved from different state 471 2.3% White / Caucasian107 8.7% Black or African American1 1.2% American Indian / Alaska Native164 17.7% Other race110 5.0% Two or more races436 2.2% White alone, not Hispanic / Latino175 9.2% Hispanic or LatinoMoved from abroad 29 0.1% White20 5.1% Asian32 0.2% White alone, not Hispanic / Latino
Children Nativity (place of birth) in Fort Dodge
Children under 6 years - Living with two parents Both parents native 836 100.0% Native0 0.0% Foreign-bornBoth parents foreign-born 5 46.6% Native6 53.4% Foreign-bornOne native, one foreign-born parent 46 100.0% NativeChildren under 6 years - Living with one parent Native parent 516 100.0% NativeForeign-born parent 79 100.0% Foreign-born
Children 6 to 17 years - Living with two parents Both parents native 1,732 100.0% NativeBoth parents foreign-born 37 100.0% NativeOne native, one foreign-born parent 43 100.0% NativeChildren 6 to 17 years - Living with one parent Native parent 1,399 100.0% Native
Grandparents responsible for own grandchildren in Fort Dodge
Grandparents (30 to 59 years) White / Caucasian 16 61.7% Responsible for grandchildren10 38.3% Not responsible for grandchildrenWhite alone, not Hispanic / Latino 16 58.6% Responsible for grandchildren11 41.4% Not responsible for grandchildrenGrandparents (60 years and over) White / Caucasian 42 55.1% Responsible for grandchildren34 44.9% Not responsible for grandchildrenWhite alone, not Hispanic / Latino 42 54.1% Responsible for grandchildren35 45.9% Not responsible for grandchildren