Races in Fort Gordon, Georgia (GA) Detailed Stats
Ancestries, Foreign-born residents, place of birth
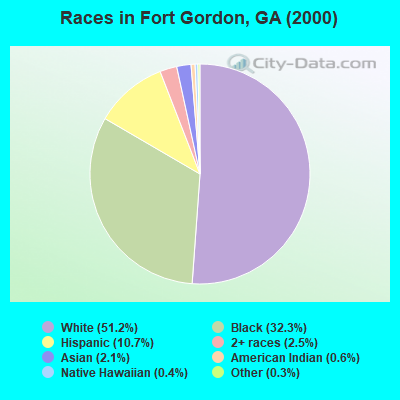
Race distribution in Fort Gordon

- 3,96951.2%White alone
- 2,50232.3%Black alone
- 82710.7%Hispanic
- 1942.5%Two or more races
- 1612.1%Asian alone
- 490.6%American Indian alone
- 320.4%Native Hawaiian and Other
Pacific Islander alone - 200.3%Other race alone
2000
2022
-
- 5,128,66162.6%White alone
- 2,331,46528.5%Black alone
- 435,2275.3%Hispanic
- 171,5132.1%Asian alone
- 87,3641.1%Two or more races
- 17,6700.2%American Indian alone
- 11,2750.1%Other race alone
- 3,2780.04%Native Hawaiian and Other
Pacific Islander alone

-
- 5,415,65749.6%White alone
- 3,349,24030.7%Black alone
- 1,132,60410.4%Hispanic
- 479,1564.4%Asian alone
- 462,9234.2%Two or more races
- 54,4160.5%Other race alone
- 11,9230.1%American Indian alone
- 6,9570.06%Native Hawaiian and Other
Pacific Islander alone

Income and house value in Fort Gordon
- Median household income in 2022
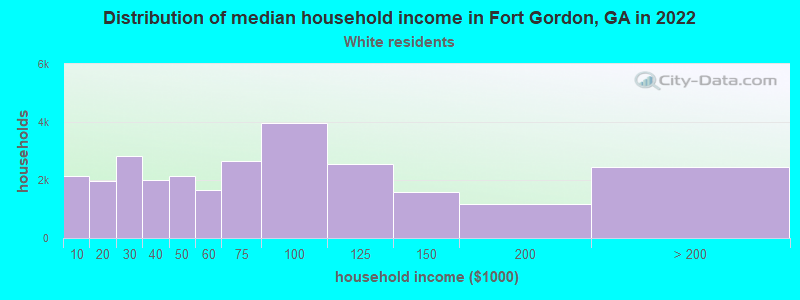
- $64,446White non-Hispanic householders
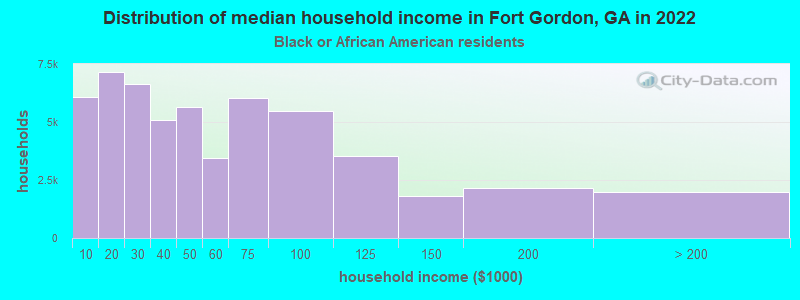
- $57,795Black householders
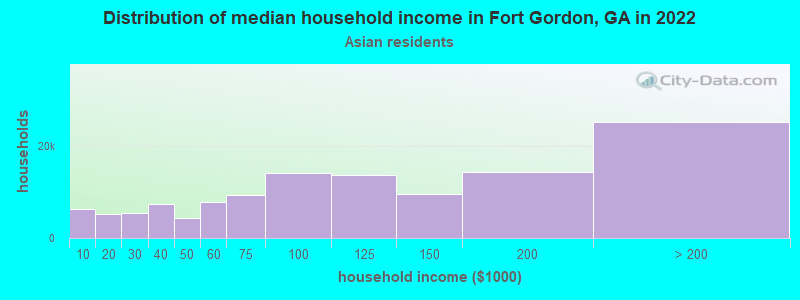
- $150,318Asian householders
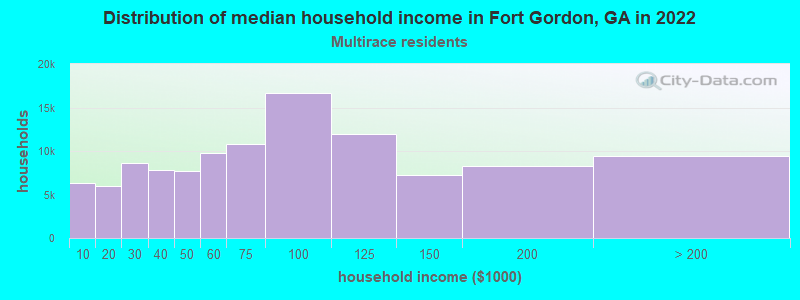
- $47,708Two or more races householders
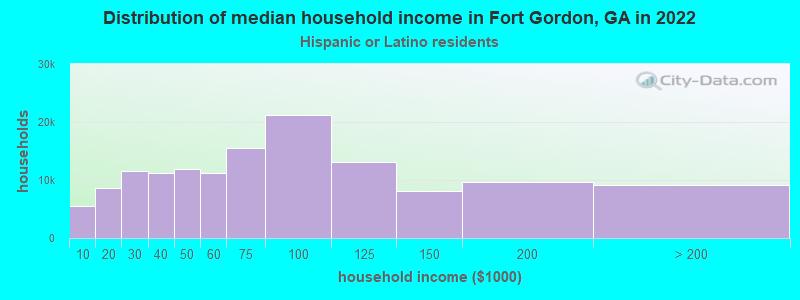
- $62,383Hispanic or Latino race householders
- Median 2022 house value
- $223,165White Non-Hispanic householders
- $148,777Black or African American householders
Household income for White non-Hispanic householders
Household income for Black householders
Household income for Asian householders
Household income for Two or more races householders
Household income for Hispanic or Latino race householders
Zip code: 30905