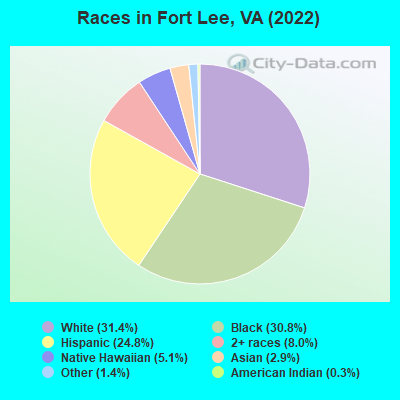
Races in Fort Lee, Virginia (VA) Detailed Stats
Data:
Races - White alone (%)
Races - White alone (% change since 2000)
Races - Black alone (%)
Races - Black alone (% change since 2000)
Races - American Indian alone (%)
Races - American Indian alone (% change since 2000)
Races - Asian alone (%)
Races - Asian alone (% change since 2000)
Races - Hispanic (%)
Races - Hispanic (% change since 2000)
Races - Native Hawaiian and Other Pacific Islander alone (%)
Races - Native Hawaiian and Other Pacific Islander alone (% change since 2000)
Races - Two or more races(%)
Races - Two or more races(% change since 2000)
Races - Other race alone (%)
Races - Other race alone (% change since 2000)
Racial diversity
Place of birth - Born in state of residence (%)
Place of birth - Born in state of residence (%) - White
Place of birth - Born in state of residence (%) - Black or African American
Place of birth - Born in state of residence (%) - Asian
Place of birth - Born in state of residence (%) - Hispanic or Latino
Place of birth - Born in state of residence (%) - American Indian and Alaska Native
Place of birth - Born in state of residence (%) - Multirace
Place of birth - Born in state of residence (%) - Other Race
Place of birth - Born in other state (%)
Place of birth - Born in other state (%) - White
Place of birth - Born in other state (%) - Black or African American
Place of birth - Born in other state (%) - Asian
Place of birth - Born in other state (%) - Hispanic or Latino
Place of birth - Born in other state (%) - American Indian and Alaska Native
Place of birth - Born in other state (%) - Multirace
Place of birth - Born in other state (%) - Other Race
Place of birth - Native, outside of US (%)
Place of birth - Native, outside of US (%) - White
Place of birth - Native, outside of US (%) - Black or African American
Place of birth - Native, outside of US (%) - Asian
Place of birth - Native, outside of US (%) - Hispanic or Latino
Place of birth - Native, outside of US (%) - American Indian and Alaska Native
Place of birth - Native, outside of US (%) - Multirace
Place of birth - Native, outside of US (%) - Other Race
Place of birth - Foreign born (%)
Place of birth - Foreign born (%) - White
Place of birth - Foreign born (%) - Black or African American
Place of birth - Foreign born (%) - Asian
Place of birth - Foreign born (%) - Hispanic or Latino
Place of birth - Foreign born (%) - American Indian and Alaska Native
Place of birth - Foreign born (%) - Multirace
Place of birth - Foreign born (%) - Other Race
Residents speaking English at home (%)
Residents speaking English at home - Born in the United States (%)
Residents speaking English at home - Native, born elsewhere (%)
Residents speaking English at home - Foreign born (%)
Residents speaking Spanish at home (%)
Residents speaking Spanish at home - Born in the United States (%)
Residents speaking Spanish at home - Native, born elsewhere (%)
Residents speaking Spanish at home - Foreign born (%)
Residents speaking other language at home (%)
Residents speaking other language at home - Born in the United States (%)
Residents speaking other language at home - Native, born elsewhere (%)
Residents speaking other language at home - Foreign born (%)
Marital status - Never married (%)
Marital status - Now married (%)
Marital status - Separated (%)
Marital status - Widowed (%)
Marital status - Divorced (%)
Ancestries Reported - Arab (%)
Ancestries Reported - Czech (%)
Ancestries Reported - Danish (%)
Ancestries Reported - Dutch (%)
Ancestries Reported - English (%)
Ancestries Reported - French (%)
Ancestries Reported - French Canadian (%)
Ancestries Reported - German (%)
Ancestries Reported - Greek (%)
Ancestries Reported - Hungarian (%)
Ancestries Reported - Irish (%)
Ancestries Reported - Italian (%)
Ancestries Reported - Lithuanian (%)
Ancestries Reported - Norwegian (%)
Ancestries Reported - Polish (%)
Ancestries Reported - Portuguese (%)
Ancestries Reported - Russian (%)
Ancestries Reported - Scotch-Irish (%)
Ancestries Reported - Scottish (%)
Ancestries Reported - Slovak (%)
Ancestries Reported - Subsaharan African (%)
Ancestries Reported - Swedish (%)
Ancestries Reported - Swiss (%)
Ancestries Reported - Ukrainian (%)
Ancestries Reported - United States (%)
Ancestries Reported - Welsh (%)
Ancestries Reported - West Indian (%)
Ancestries Reported - Other (%)
Geographical mobility - Same house 1 year ago (%)
Geographical mobility - Same house 1 year ago (%) - White
Geographical mobility - Same house 1 year ago (%) - Black or African American
Geographical mobility - Same house 1 year ago (%) - Asian
Geographical mobility - Same house 1 year ago (%) - Hispanic or Latino
Geographical mobility - Same house 1 year ago (%) - American Indian and Alaska Native
Geographical mobility - Same house 1 year ago (%) - Multirace
Geographical mobility - Same house 1 year ago (%) - Other Race
Geographical mobility - Moved within same county (%)
Geographical mobility - Moved within same county (%) - White
Geographical mobility - Moved within same county (%) - Black or African American
Geographical mobility - Moved within same county (%) - Asian
Geographical mobility - Moved within same county (%) - Hispanic or Latino
Geographical mobility - Moved within same county (%) - American Indian and Alaska Native
Geographical mobility - Moved within same county (%) - Multirace
Geographical mobility - Moved within same county (%) - Other Race
Geographical mobility - Moved from different county within same state (%)
Geographical mobility - Moved from different county within same state (%) - White
Geographical mobility - Moved from different county within same state (%) - Black or African American
Geographical mobility - Moved from different county within same state (%) - Asian
Geographical mobility - Moved from different county within same state (%) - Hispanic or Latino
Geographical mobility - Moved from different county within same state (%) - American Indian and Alaska Native
Geographical mobility - Moved from different county within same state (%) - Multirace
Geographical mobility - Moved from different county within same state (%) - Other Race
Geographical mobility - Moved from different state (%)
Geographical mobility - Moved from different state (%) - White
Geographical mobility - Moved from different state (%) - Black or African American
Geographical mobility - Moved from different state (%) - Asian
Geographical mobility - Moved from different state (%) - Hispanic or Latino
Geographical mobility - Moved from different state (%) - American Indian and Alaska Native
Geographical mobility - Moved from different state (%) - Multirace
Geographical mobility - Moved from different state (%) - Other Race
Geographical mobility - Moved from abroad (%)
Geographical mobility - Moved from abroad (%) - White
Geographical mobility - Moved from abroad (%) - Black or African American
Geographical mobility - Moved from abroad (%) - Asian
Geographical mobility - Moved from abroad (%) - Hispanic or Latino
Geographical mobility - Moved from abroad (%) - American Indian and Alaska Native
Geographical mobility - Moved from abroad (%) - Multirace
Geographical mobility - Moved from abroad (%) - Other Race
Place of birth for the foreign-born population - Ireland (%)
Place of birth for the foreign-born population - Denmark (%)
Place of birth for the foreign-born population - Norway (%)
Place of birth for the foreign-born population - Sweden (%)
Place of birth for the foreign-born population - United Kingdom (%)
Place of birth for the foreign-born population - England (%)
Place of birth for the foreign-born population - Scotland (%)
Place of birth for the foreign-born population - Other Northern Europe (%)
Place of birth for the foreign-born population - Austria (%)
Place of birth for the foreign-born population - Belgium (%)
Place of birth for the foreign-born population - France (%)
Place of birth for the foreign-born population - Germany (%)
Place of birth for the foreign-born population - Netherlands (%)
Place of birth for the foreign-born population - Switzerland (%)
Place of birth for the foreign-born population - Other Western Europe (%)
Place of birth for the foreign-born population - Greece (%)
Place of birth for the foreign-born population - Italy (%)
Place of birth for the foreign-born population - Portugal (%)
Place of birth for the foreign-born population - Spain (%)
Place of birth for the foreign-born population - Other Southern Europe (%)
Place of birth for the foreign-born population - Albania (%)
Place of birth for the foreign-born population - Belarus (%)
Place of birth for the foreign-born population - Bosnia and Herzegovina (%)
Place of birth for the foreign-born population - Bulgaria (%)
Place of birth for the foreign-born population - Croatia (%)
Place of birth for the foreign-born population - Czechoslovakia (%)
Place of birth for the foreign-born population - Hungary (%)
Place of birth for the foreign-born population - Latvia (%)
Place of birth for the foreign-born population - Lithuania (%)
Place of birth for the foreign-born population - North Macedonia (Macedonia) (%)
Place of birth for the foreign-born population - Moldova (%)
Place of birth for the foreign-born population - Poland (%)
Place of birth for the foreign-born population - Romania (%)
Place of birth for the foreign-born population - Russia (%)
Place of birth for the foreign-born population - Serbia (%)
Place of birth for the foreign-born population - Ukraine (%)
Place of birth for the foreign-born population - Other Eastern Europe (%)
Place of birth for the foreign-born population - China (%)
Place of birth for the foreign-born population - Hong Kong (%)
Place of birth for the foreign-born population - Taiwan (%)
Place of birth for the foreign-born population - Japan (%)
Place of birth for the foreign-born population - Korea (%)
Place of birth for the foreign-born population - Other Eastern Asia (%)
Place of birth for the foreign-born population - Afghanistan (%)
Place of birth for the foreign-born population - Bangladesh (%)
Place of birth for the foreign-born population - India (%)
Place of birth for the foreign-born population - Iran (%)
Place of birth for the foreign-born population - Kazakhstan (%)
Place of birth for the foreign-born population - Nepal (%)
Place of birth for the foreign-born population - Pakistan (%)
Place of birth for the foreign-born population - Sri Lanka (%)
Place of birth for the foreign-born population - Uzbekistan (%)
Place of birth for the foreign-born population - Other South Central Asia (%)
Place of birth for the foreign-born population - Burma (%)
Place of birth for the foreign-born population - Cambodia (%)
Place of birth for the foreign-born population - Indonesia (%)
Place of birth for the foreign-born population - Laos (%)
Place of birth for the foreign-born population - Malaysia (%)
Place of birth for the foreign-born population - Philippines (%)
Place of birth for the foreign-born population - Singapore (%)
Place of birth for the foreign-born population - Thailand (%)
Place of birth for the foreign-born population - Vietnam (%)
Place of birth for the foreign-born population - Other South Eastern Asia (%)
Place of birth for the foreign-born population - Armenia (%)
Place of birth for the foreign-born population - Iraq (%)
Place of birth for the foreign-born population - Israel (%)
Place of birth for the foreign-born population - Jordan (%)
Place of birth for the foreign-born population - Kuwait (%)
Place of birth for the foreign-born population - Lebanon (%)
Place of birth for the foreign-born population - Saudi Arabia (%)
Place of birth for the foreign-born population - Syria (%)
Place of birth for the foreign-born population - Turkey (%)
Place of birth for the foreign-born population - Yemen (%)
Place of birth for the foreign-born population - Other Western Asia (%)
Place of birth for the foreign-born population - Eritrea (%)
Place of birth for the foreign-born population - Ethiopia (%)
Place of birth for the foreign-born population - Kenya (%)
Place of birth for the foreign-born population - Somalia (%)
Place of birth for the foreign-born population - Uganda (%)
Place of birth for the foreign-born population - Zimbabwe (%)
Place of birth for the foreign-born population - Other Eastern Africa (%)
Place of birth for the foreign-born population - Cameroon (%)
Place of birth for the foreign-born population - Congo (%)
Place of birth for the foreign-born population - Democratic Republic of Congo (Zaire) (%)
Place of birth for the foreign-born population - Other Middle Africa (%)
Place of birth for the foreign-born population - Egypt (%)
Place of birth for the foreign-born population - Morocco (%)
Place of birth for the foreign-born population - Sudan (%)
Place of birth for the foreign-born population - Other Northern Africa (%)
Place of birth for the foreign-born population - South Africa (%)
Place of birth for the foreign-born population - Other Southern Africa (%)
Place of birth for the foreign-born population - Cabo Verde (%)
Place of birth for the foreign-born population - Ghana (%)
Place of birth for the foreign-born population - Liberia (%)
Place of birth for the foreign-born population - Nigeria (%)
Place of birth for the foreign-born population - Senegal (%)
Place of birth for the foreign-born population - Sierra Leone (%)
Place of birth for the foreign-born population - Other Western Africa (%)
Place of birth for the foreign-born population - Australia (%)
Place of birth for the foreign-born population - New Zealand (%)
Place of birth for the foreign-born population - Fiji (%)
Place of birth for the foreign-born population - Micronesia (%)
Place of birth for the foreign-born population - Bahamas (%)
Place of birth for the foreign-born population - Barbados (%)
Place of birth for the foreign-born population - Cuba (%)
Place of birth for the foreign-born population - Dominica (%)
Place of birth for the foreign-born population - Dominican Republic (%)
Place of birth for the foreign-born population - Grenada (%)
Place of birth for the foreign-born population - Haiti (%)
Place of birth for the foreign-born population - Jamaica (%)
Place of birth for the foreign-born population - St. Vincent and the Grenadines (%)
Place of birth for the foreign-born population - Trinidad and Tobago (%)
Place of birth for the foreign-born population - West Indies (%)
Place of birth for the foreign-born population - Other Caribbean (%)
Place of birth for the foreign-born population - Belize (%)
Place of birth for the foreign-born population - Costa Rica (%)
Place of birth for the foreign-born population - El Salvador (%)
Place of birth for the foreign-born population - Guatemala (%)
Place of birth for the foreign-born population - Honduras (%)
Place of birth for the foreign-born population - Mexico (%)
Place of birth for the foreign-born population - Nicaragua (%)
Place of birth for the foreign-born population - Panama (%)
Place of birth for the foreign-born population - Other Central America (%)
Place of birth for the foreign-born population - Argentina (%)
Place of birth for the foreign-born population - Bolivia (%)
Place of birth for the foreign-born population - Brazil (%)
Place of birth for the foreign-born population - Chile (%)
Place of birth for the foreign-born population - Colombia (%)
Place of birth for the foreign-born population - Ecuador (%)
Place of birth for the foreign-born population - Guyana (%)
Place of birth for the foreign-born population - Peru (%)
Place of birth for the foreign-born population - Uruguay (%)
Place of birth for the foreign-born population - Venezuela (%)
Place of birth for the foreign-born population - Other South America (%)
Place of birth for the foreign-born population - Canada (%)
Place of birth for the foreign-born population - Other Northern America (%)
Place of birth for the foreign-born population - Other (%)
According to 2022 data, the most numerous races in Fort Lee, VA are White alone (2,382 residents), Black alone (2,340 residents), and Hispanic (1,883 residents). 74.0% of Fort Lee residents speak English at home. 10.1% of Fort Lee, VA residents are foreign-born (4.0% born in Latin America, 2.8% born in Africa, 1.8% born in Asia, 1.3% born in Europe), which is 18.8% less than the foreign-born rate of 12.0% across the entire state of Virginia.
Race distribution in Fort Lee
2000 2022
4,965,637 70.2% White alone 1,376,378 19.4% Black alone 329,540 4.7% Hispanic 259,277 3.7% Asian alone 114,022 1.6% Two or more races 18,596 0.3% American Indian alone 11,685 0.2% Other race alone 3,380 0.05% Native Hawaiian and Other
5,095,130 58.7% White alone 1,594,785 18.4% Black alone 905,750 10.4% Hispanic 602,881 6.9% Asian alone 406,047 4.7% Two or more races 60,419 0.7% Other race alone 11,738 0.1% American Indian alone 6,869 0.08% Native Hawaiian and Other
Income and house value in Fort Lee Median household income in 2022 $78,808 White non-Hispanic householders$65,391 Black householders$72,221 Native Hawaiian and other Pacific Islander householders$164,296 Some other race householders$45,612 Two or more races householders$64,110 Hispanic or Latino race householdersMedian 2022 house value $-927,241,415 White Non-Hispanic householders$-605,797,724 Black or African American householders
Median age by race in Fort Lee
20.3 Median age for White residents20.5 22.2 25.1 Median age for Black or African American residents25.5 24.4 30.1 Median age for American Indian / Alaska Native residents11.2 29.2 31.4 Median age for Asian residents39.6 26.0 12.0 Median age for Native Hawaiian / Pacific Islander residents15.7 24.6 22.4 Median age for Other race residents20.4 26.2 20.6 Median age for Two or more races residents20.1 17.1 20.2 Median age for White alone residents20.3 22.2 20.0 Median age for Hispanic or Latino residents20.9 19.5
Owner/renter occupied households by race in Fort Lee
House owners and renters - White residents 29 4.5% Owner occupied624 95.5% Renter occupiedHouse owners and renters - Black or African American residents 565 100.0% Renter occupiedHouse owners and renters - American Indian / Alaska Native residents 18 100.0% Renter occupiedHouse owners and renters - Asian residents 48 100.0% Renter occupiedHouse owners and renters - Native Hawaiian / Pacific Islander residents 66 100.0% Renter occupiedHouse owners and renters - Other race residents 74 100.0% Renter occupiedHouse owners and renters - Two or more races residents 144 100.0% Renter occupiedHouse owners and renters - White alone residents 29 4.9% Owner occupied566 95.1% Renter occupiedHouse owners and renters - Hispanic or Latino residents 235 100.0% Renter occupied
Language usage in Fort Lee
English speakers - Total 74.0% of residents of Fort Lee speak English at home.
12.9% of residents speak Spanish at home 730 82.2% Speak English very well158 17.8% Speak English less than very well13.6% of residents speak other language at home 799 85.2% Speak English very well139 14.8% Speak English less than very well
English speakers - Born in the United States 87.0% of residents of Fort Lee speak English at home.
8.1% of residents speak Spanish at home 365 82.8% Speak English very well76 17.2% Speak English less than very well6.2% of residents speak other language at home 338 100.0% Speak English very well
English speakers - Native, born elsewhere 34.4% of residents of Fort Lee speak English at home.
26.4% of residents speak Spanish at home 142 79.8% Speak English very well36 20.2% Speak English less than very well27.0% of residents speak other language at home 182 100.0% Speak English very well
English speakers - Foreign-born 15.6% of residents of Fort Lee speak English at home.
24.7% of residents speak Spanish at home 114 62.6% Speak English very well68 37.4% Speak English less than very well60.7% of residents speak other language at home 309 69.1% Speak English very well138 30.9% Speak English less than very well
White (Caucasian) - Speak only English Native:
92.0% (1,950)Foreign-born:
18.8% (20)
White (Caucasian) - Speak another language Native:
6.6% (140)Foreign-born:
79.9% (86)
Black or African American - Speak only English Native:
90.3% (1,810)Foreign-born:
16.0% (58)
Black or African American - Speak another language Native:
10.9% (218)Foreign-born:
97.5% (354)
American Indian / Alaska Native - Speak another language Native:
25.3% (37)Foreign-born:
100.0% (22)
Asian - Speak another language Native:
53.9% (93)Foreign-born:
91.8% (87)
Native Hawaiian / Pacific Islander - Speak another language Native:
70.9% (122)Foreign-born:
49.7% (10)
Other race - Speak another language Native:
55.4% (235)Foreign-born:
100.0% (107)
Two or more races - Speak only English Native:
68.3% (1,042)Foreign-born:
8.4% (6)
Two or more races - Speak another language Native:
30.7% (468)Foreign-born:
91.3% (60)
White alone - Speak only English Native:
96.2% (1,904)Foreign-born:
31.1% (22)
White alone - Speak another language Native:
3.3% (65)Foreign-born:
68.8% (49)
Hispanic or Latino - Speak another language Native:
45.5% (789)Foreign-born:
100.0% (148)
Foreign-born residents in Fort Lee 767 residents are foreign born (4.0% Latin America , 2.8% Africa , 1.8% Asia , 1.3% Europe ).
This city:
10.1%Virginia:
12.6%
Marital status for residents in Fort Lee Marital status - White (Caucasian) population 15 years and over
Males 40.7% Never married57.1% Now married2.2% Separated0.0% Widowed0.0% DivorcedFemales 23.8% Never married69.6% Now married0.7% Separated0.7% Widowed5.1% DivorcedWomen who gave birth in the past 12 months Now married:
100.0% (22)Unmarried:
0.0% (0)
Women who did not give birth in the past 12 months Now married:
68.7% (411)Unmarried:
31.3% (187)
Marital status - Black or African American population 15 years and over
Males 36.3% Never married37.7% Now married0.0% Separated1.0% Widowed25.0% DivorcedFemales 42.3% Never married44.4% Now married3.3% Separated2.6% Widowed7.3% DivorcedWomen who gave birth in the past 12 months Now married:
55.2% (52)Unmarried:
44.8% (42)
Women who did not give birth in the past 12 months Now married:
44.8% (281)Unmarried:
55.2% (346)
Marital status - American Indian / Alaska Native population 15 years and over
Males 93.8% Never married6.2% Now married0.0% Separated0.0% Widowed0.0% DivorcedFemales 0.0% Never married100.0% Now married0.0% Separated0.0% Widowed0.0% DivorcedWomen who did not give birth in the past 12 months Now married:
100.0% (47)Unmarried:
0.0% (0)
Marital status - Asian population 15 years and over
Males 0.9% Never married74.5% Now married0.0% Separated0.0% Widowed24.5% DivorcedFemales 34.2% Never married65.8% Now married0.0% Separated0.0% Widowed0.0% DivorcedWomen who did not give birth in the past 12 months Now married:
65.8% (82)Unmarried:
34.2% (43)
Marital status - Native Hawaiian / Pacific Islander population 15 years and over
Males 55.6% Never married44.4% Now married0.0% Separated0.0% Widowed0.0% DivorcedFemales 54.9% Never married5.3% Now married0.0% Separated39.8% Widowed0.0% DivorcedWomen who gave birth in the past 12 months Now married:
9.0% (6)Unmarried:
91.0% (64)
Women who did not give birth in the past 12 months Now married:
7.7% (1)Unmarried:
92.3% (13)
Marital status - Other race population 15 years and over
Males 52.3% Never married47.7% Now married0.0% Separated0.0% Widowed0.0% DivorcedFemales 29.7% Never married37.8% Now married5.4% Separated0.0% Widowed27.0% DivorcedWomen who did not give birth in the past 12 months Now married:
34.4% (42)Unmarried:
65.6% (80)
Marital status - Two or more races population 15 years and over
Males 67.0% Never married33.0% Now married0.0% Separated0.0% Widowed0.0% DivorcedFemales 61.9% Never married38.1% Now married0.0% Separated0.0% Widowed0.0% DivorcedWomen who gave birth in the past 12 months Now married:
100.0% (27)Unmarried:
0.0% (0)
Women who did not give birth in the past 12 months Now married:
32.2% (113)Unmarried:
67.8% (237)
Marital status - White alone, not Hispanic / Latino population 15 years and over
Males 40.8% Never married56.9% Now married2.4% Separated0.0% Widowed0.0% DivorcedFemales 23.6% Never married70.7% Now married0.0% Separated0.8% Widowed4.9% DivorcedWomen who gave birth in the past 12 months Now married:
100.0% (22)Unmarried:
0.0% (0)
Women who did not give birth in the past 12 months Now married:
69.2% (374)Unmarried:
30.8% (167)
Marital status - Hispanic or Latino population 15 years and over
Males 65.7% Never married34.3% Now married0.0% Separated0.0% Widowed0.0% DivorcedFemales 55.2% Never married33.7% Now married2.7% Separated0.0% Widowed8.5% DivorcedWomen who did not give birth in the past 12 months Now married:
32.2% (126)Unmarried:
67.8% (265)
Ancestries in Fort Lee
170 4.4% German128 3.3% Sierra Leonean103 2.7% Irish100 2.6% European75 1.9% American66 1.7% African55 1.4% Haitian41 1.1% Czech41 1.1% Italian40 1.0% Scottish30 0.8% Trinidadian and Tobagonian24 0.6% French21 0.5% Brazilian20 0.5% English20 0.5% Iranian12 0.3% Nigerian11 0.3% U.S. Virgin Islander9 0.2% Norwegian8 0.2% British West Indian8 0.2% Jamaican4 0.1% Iraqi3 0.08% Northern European2 0.05% Russian2 0.05% Kenyan2 0.05% Yugoslavian1 0.03% Scandinavian
Geographical mobility in Fort Lee Same house 1 year ago 1,520 60.1% White (Caucasian)1,263 52.2% Black or African American64 35.1% American Indian / Alaska Native63 25.5% Asian46 21.1% Native Hawaiian / Pacific Islander219 38.0% Other race671 36.2% Two or more races1,437 61.6% White alone, not Hispanic / Latino584 30.9% Hispanic or LatinoMoved within same county 12 0.5% White / Caucasian35 1.4% Black or African American11 0.5% White alone, not Hispanic / LatinoMoved within same state 120 4.7% White / Caucasian49 2.0% Black or African American66 26.7% Asian27 4.6% Other race87 4.7% Two or more races77 3.3% White alone, not Hispanic / Latino84 4.4% Hispanic or LatinoMoved from different state 962 38.0% White / Caucasian1,972 81.6% Black or African American105 57.2% American Indian / Alaska Native147 59.3% Asian136 62.5% Native Hawaiian / Pacific Islander279 48.4% Other race1,069 57.7% Two or more races913 39.1% White alone, not Hispanic / Latino1,151 60.9% Hispanic or LatinoMoved from abroad 26 1.0% White6 0.2% Black or African American32 13.1% Asian54 9.3% Other race26 1.1% White alone, not Hispanic / Latino49 2.6% Hispanic or Latino
Children Nativity (place of birth) in Fort Lee
Children under 6 years - Living with two parents Both parents native 600 99.2% Native5 0.8% Foreign-bornBoth parents foreign-born 21 100.0% NativeOne native, one foreign-born parent 107 100.0% NativeChildren under 6 years - Living with one parent Native parent 81 100.0% NativeForeign-born parent 12 100.0% NativeChildren 6 to 17 years - Living with two parents Both parents native 948 100.0% NativeBoth parents foreign-born 143 100.0% NativeOne native, one foreign-born parent 81 100.0% NativeChildren 6 to 17 years - Living with one parent Native parent 149 99.1% Native1 0.9% Foreign-bornForeign-born parent 31 64.2% Native17 35.8% Foreign-born
Grandparents responsible for own grandchildren in Fort Lee
Grandparents (30 to 59 years) Black or African American 21 100.0% Not responsible for grandchildrenNative Hawaiian / Pacific Islander 49 100.0% Not responsible for grandchildren
Grandparents (60 years and over)