Races in Fort Leonard Wood, Missouri (MO) Detailed Stats
Data:
Races - White alone (%)
Races - White alone (% change since 2000)
Races - Black alone (%)
Races - Black alone (% change since 2000)
Races - American Indian alone (%)
Races - American Indian alone (% change since 2000)
Races - Asian alone (%)
Races - Asian alone (% change since 2000)
Races - Hispanic (%)
Races - Hispanic (% change since 2000)
Races - Native Hawaiian and Other Pacific Islander alone (%)
Races - Native Hawaiian and Other Pacific Islander alone (% change since 2000)
Races - Two or more races(%)
Races - Two or more races(% change since 2000)
Races - Other race alone (%)
Races - Other race alone (% change since 2000)
Racial diversity
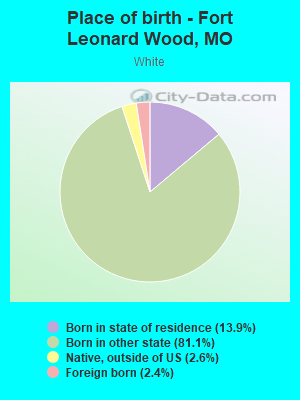
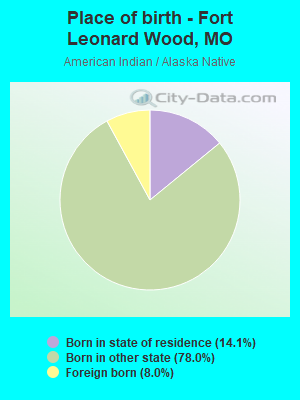
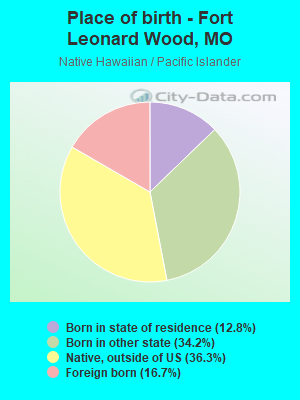
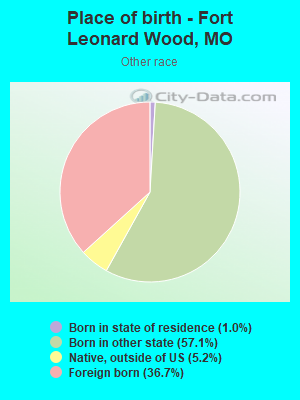
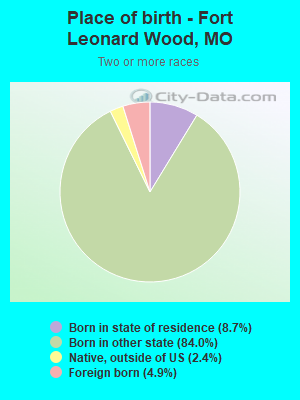
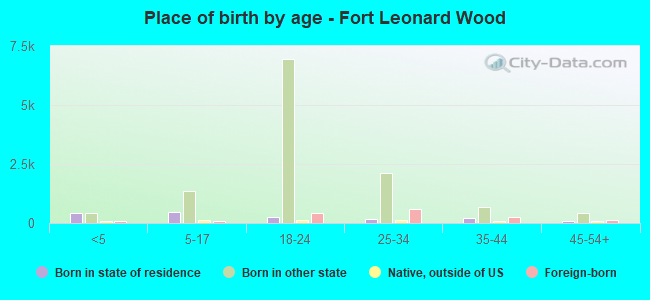
Place of birth - Born in state of residence (%)
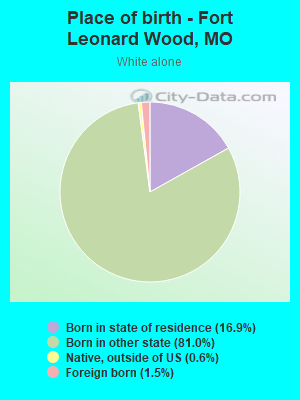
Place of birth - Born in state of residence (%) - White
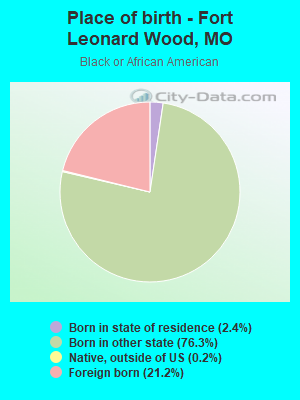
Place of birth - Born in state of residence (%) - Black or African American
Place of birth - Born in state of residence (%) - Asian
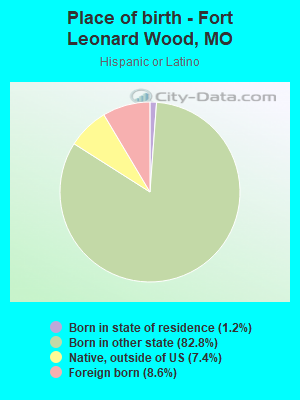
Place of birth - Born in state of residence (%) - Hispanic or Latino
Place of birth - Born in state of residence (%) - American Indian and Alaska Native
Place of birth - Born in state of residence (%) - Multirace
Place of birth - Born in state of residence (%) - Other Race
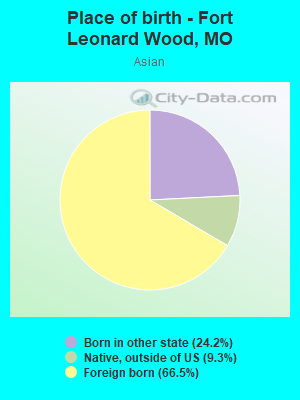
Place of birth - Born in other state (%)
Place of birth - Born in other state (%) - White
Place of birth - Born in other state (%) - Black or African American
Place of birth - Born in other state (%) - Asian
Place of birth - Born in other state (%) - Hispanic or Latino
Place of birth - Born in other state (%) - American Indian and Alaska Native
Place of birth - Born in other state (%) - Multirace
Place of birth - Born in other state (%) - Other Race
Place of birth - Native, outside of US (%)
Place of birth - Native, outside of US (%) - White
Place of birth - Native, outside of US (%) - Black or African American
Place of birth - Native, outside of US (%) - Asian
Place of birth - Native, outside of US (%) - Hispanic or Latino
Place of birth - Native, outside of US (%) - American Indian and Alaska Native
Place of birth - Native, outside of US (%) - Multirace
Place of birth - Native, outside of US (%) - Other Race
Place of birth - Foreign born (%)
Place of birth - Foreign born (%) - White
Place of birth - Foreign born (%) - Black or African American
Place of birth - Foreign born (%) - Asian
Place of birth - Foreign born (%) - Hispanic or Latino
Place of birth - Foreign born (%) - American Indian and Alaska Native
Place of birth - Foreign born (%) - Multirace
Place of birth - Foreign born (%) - Other Race
Residents speaking English at home (%)
Residents speaking English at home - Born in the United States (%)
Residents speaking English at home - Native, born elsewhere (%)
Residents speaking English at home - Foreign born (%)
Residents speaking Spanish at home (%)
Residents speaking Spanish at home - Born in the United States (%)
Residents speaking Spanish at home - Native, born elsewhere (%)
Residents speaking Spanish at home - Foreign born (%)
Residents speaking other language at home (%)
Residents speaking other language at home - Born in the United States (%)
Residents speaking other language at home - Native, born elsewhere (%)
Residents speaking other language at home - Foreign born (%)
Marital status - Never married (%)
Marital status - Now married (%)
Marital status - Separated (%)
Marital status - Widowed (%)
Marital status - Divorced (%)
Ancestries Reported - Arab (%)
Ancestries Reported - Czech (%)
Ancestries Reported - Danish (%)
Ancestries Reported - Dutch (%)
Ancestries Reported - English (%)
Ancestries Reported - French (%)
Ancestries Reported - French Canadian (%)
Ancestries Reported - German (%)
Ancestries Reported - Greek (%)
Ancestries Reported - Hungarian (%)
Ancestries Reported - Irish (%)
Ancestries Reported - Italian (%)
Ancestries Reported - Lithuanian (%)
Ancestries Reported - Norwegian (%)
Ancestries Reported - Polish (%)
Ancestries Reported - Portuguese (%)
Ancestries Reported - Russian (%)
Ancestries Reported - Scotch-Irish (%)
Ancestries Reported - Scottish (%)
Ancestries Reported - Slovak (%)
Ancestries Reported - Subsaharan African (%)
Ancestries Reported - Swedish (%)
Ancestries Reported - Swiss (%)
Ancestries Reported - Ukrainian (%)
Ancestries Reported - United States (%)
Ancestries Reported - Welsh (%)
Ancestries Reported - West Indian (%)
Ancestries Reported - Other (%)
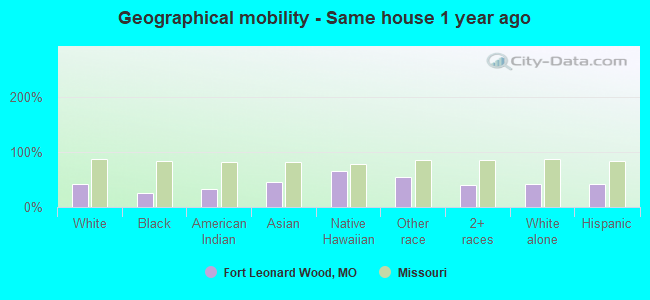
Geographical mobility - Same house 1 year ago (%)
Geographical mobility - Same house 1 year ago (%) - White
Geographical mobility - Same house 1 year ago (%) - Black or African American
Geographical mobility - Same house 1 year ago (%) - Asian
Geographical mobility - Same house 1 year ago (%) - Hispanic or Latino
Geographical mobility - Same house 1 year ago (%) - American Indian and Alaska Native
Geographical mobility - Same house 1 year ago (%) - Multirace
Geographical mobility - Same house 1 year ago (%) - Other Race
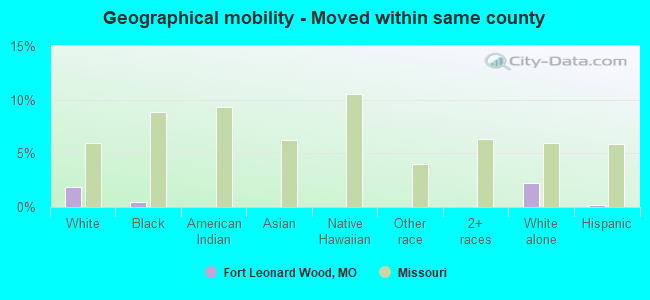
Geographical mobility - Moved within same county (%)
Geographical mobility - Moved within same county (%) - White
Geographical mobility - Moved within same county (%) - Black or African American
Geographical mobility - Moved within same county (%) - Asian
Geographical mobility - Moved within same county (%) - Hispanic or Latino
Geographical mobility - Moved within same county (%) - American Indian and Alaska Native
Geographical mobility - Moved within same county (%) - Multirace
Geographical mobility - Moved within same county (%) - Other Race
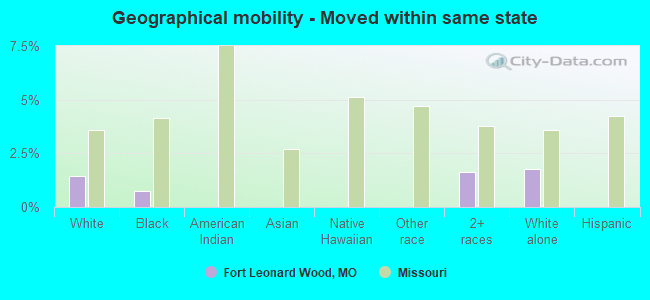
Geographical mobility - Moved from different county within same state (%)
Geographical mobility - Moved from different county within same state (%) - White
Geographical mobility - Moved from different county within same state (%) - Black or African American
Geographical mobility - Moved from different county within same state (%) - Asian
Geographical mobility - Moved from different county within same state (%) - Hispanic or Latino
Geographical mobility - Moved from different county within same state (%) - American Indian and Alaska Native
Geographical mobility - Moved from different county within same state (%) - Multirace
Geographical mobility - Moved from different county within same state (%) - Other Race
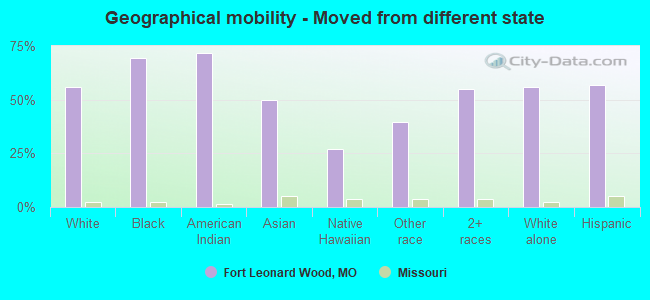
Geographical mobility - Moved from different state (%)
Geographical mobility - Moved from different state (%) - White
Geographical mobility - Moved from different state (%) - Black or African American
Geographical mobility - Moved from different state (%) - Asian
Geographical mobility - Moved from different state (%) - Hispanic or Latino
Geographical mobility - Moved from different state (%) - American Indian and Alaska Native
Geographical mobility - Moved from different state (%) - Multirace
Geographical mobility - Moved from different state (%) - Other Race
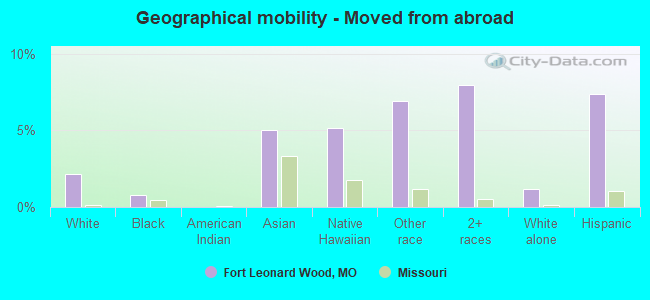
Geographical mobility - Moved from abroad (%)
Geographical mobility - Moved from abroad (%) - White
Geographical mobility - Moved from abroad (%) - Black or African American
Geographical mobility - Moved from abroad (%) - Asian
Geographical mobility - Moved from abroad (%) - Hispanic or Latino
Geographical mobility - Moved from abroad (%) - American Indian and Alaska Native
Geographical mobility - Moved from abroad (%) - Multirace
Geographical mobility - Moved from abroad (%) - Other Race
Place of birth for the foreign-born population - Ireland (%)
Place of birth for the foreign-born population - Denmark (%)
Place of birth for the foreign-born population - Norway (%)
Place of birth for the foreign-born population - Sweden (%)
Place of birth for the foreign-born population - United Kingdom (%)
Place of birth for the foreign-born population - England (%)
Place of birth for the foreign-born population - Scotland (%)
Place of birth for the foreign-born population - Other Northern Europe (%)
Place of birth for the foreign-born population - Austria (%)
Place of birth for the foreign-born population - Belgium (%)
Place of birth for the foreign-born population - France (%)
Place of birth for the foreign-born population - Germany (%)
Place of birth for the foreign-born population - Netherlands (%)
Place of birth for the foreign-born population - Switzerland (%)
Place of birth for the foreign-born population - Other Western Europe (%)
Place of birth for the foreign-born population - Greece (%)
Place of birth for the foreign-born population - Italy (%)
Place of birth for the foreign-born population - Portugal (%)
Place of birth for the foreign-born population - Spain (%)
Place of birth for the foreign-born population - Other Southern Europe (%)
Place of birth for the foreign-born population - Albania (%)
Place of birth for the foreign-born population - Belarus (%)
Place of birth for the foreign-born population - Bosnia and Herzegovina (%)
Place of birth for the foreign-born population - Bulgaria (%)
Place of birth for the foreign-born population - Croatia (%)
Place of birth for the foreign-born population - Czechoslovakia (%)
Place of birth for the foreign-born population - Hungary (%)
Place of birth for the foreign-born population - Latvia (%)
Place of birth for the foreign-born population - Lithuania (%)
Place of birth for the foreign-born population - North Macedonia (Macedonia) (%)
Place of birth for the foreign-born population - Moldova (%)
Place of birth for the foreign-born population - Poland (%)
Place of birth for the foreign-born population - Romania (%)
Place of birth for the foreign-born population - Russia (%)
Place of birth for the foreign-born population - Serbia (%)
Place of birth for the foreign-born population - Ukraine (%)
Place of birth for the foreign-born population - Other Eastern Europe (%)
Place of birth for the foreign-born population - China (%)
Place of birth for the foreign-born population - Hong Kong (%)
Place of birth for the foreign-born population - Taiwan (%)
Place of birth for the foreign-born population - Japan (%)
Place of birth for the foreign-born population - Korea (%)
Place of birth for the foreign-born population - Other Eastern Asia (%)
Place of birth for the foreign-born population - Afghanistan (%)
Place of birth for the foreign-born population - Bangladesh (%)
Place of birth for the foreign-born population - India (%)
Place of birth for the foreign-born population - Iran (%)
Place of birth for the foreign-born population - Kazakhstan (%)
Place of birth for the foreign-born population - Nepal (%)
Place of birth for the foreign-born population - Pakistan (%)
Place of birth for the foreign-born population - Sri Lanka (%)
Place of birth for the foreign-born population - Uzbekistan (%)
Place of birth for the foreign-born population - Other South Central Asia (%)
Place of birth for the foreign-born population - Burma (%)
Place of birth for the foreign-born population - Cambodia (%)
Place of birth for the foreign-born population - Indonesia (%)
Place of birth for the foreign-born population - Laos (%)
Place of birth for the foreign-born population - Malaysia (%)
Place of birth for the foreign-born population - Philippines (%)
Place of birth for the foreign-born population - Singapore (%)
Place of birth for the foreign-born population - Thailand (%)
Place of birth for the foreign-born population - Vietnam (%)
Place of birth for the foreign-born population - Other South Eastern Asia (%)
Place of birth for the foreign-born population - Armenia (%)
Place of birth for the foreign-born population - Iraq (%)
Place of birth for the foreign-born population - Israel (%)
Place of birth for the foreign-born population - Jordan (%)
Place of birth for the foreign-born population - Kuwait (%)
Place of birth for the foreign-born population - Lebanon (%)
Place of birth for the foreign-born population - Saudi Arabia (%)
Place of birth for the foreign-born population - Syria (%)
Place of birth for the foreign-born population - Turkey (%)
Place of birth for the foreign-born population - Yemen (%)
Place of birth for the foreign-born population - Other Western Asia (%)
Place of birth for the foreign-born population - Eritrea (%)
Place of birth for the foreign-born population - Ethiopia (%)
Place of birth for the foreign-born population - Kenya (%)
Place of birth for the foreign-born population - Somalia (%)
Place of birth for the foreign-born population - Uganda (%)
Place of birth for the foreign-born population - Zimbabwe (%)
Place of birth for the foreign-born population - Other Eastern Africa (%)
Place of birth for the foreign-born population - Cameroon (%)
Place of birth for the foreign-born population - Congo (%)
Place of birth for the foreign-born population - Democratic Republic of Congo (Zaire) (%)
Place of birth for the foreign-born population - Other Middle Africa (%)
Place of birth for the foreign-born population - Egypt (%)
Place of birth for the foreign-born population - Morocco (%)
Place of birth for the foreign-born population - Sudan (%)
Place of birth for the foreign-born population - Other Northern Africa (%)
Place of birth for the foreign-born population - South Africa (%)
Place of birth for the foreign-born population - Other Southern Africa (%)
Place of birth for the foreign-born population - Cabo Verde (%)
Place of birth for the foreign-born population - Ghana (%)
Place of birth for the foreign-born population - Liberia (%)
Place of birth for the foreign-born population - Nigeria (%)
Place of birth for the foreign-born population - Senegal (%)
Place of birth for the foreign-born population - Sierra Leone (%)
Place of birth for the foreign-born population - Other Western Africa (%)
Place of birth for the foreign-born population - Australia (%)
Place of birth for the foreign-born population - New Zealand (%)
Place of birth for the foreign-born population - Fiji (%)
Place of birth for the foreign-born population - Micronesia (%)
Place of birth for the foreign-born population - Bahamas (%)
Place of birth for the foreign-born population - Barbados (%)
Place of birth for the foreign-born population - Cuba (%)
Place of birth for the foreign-born population - Dominica (%)
Place of birth for the foreign-born population - Dominican Republic (%)
Place of birth for the foreign-born population - Grenada (%)
Place of birth for the foreign-born population - Haiti (%)
Place of birth for the foreign-born population - Jamaica (%)
Place of birth for the foreign-born population - St. Vincent and the Grenadines (%)
Place of birth for the foreign-born population - Trinidad and Tobago (%)
Place of birth for the foreign-born population - West Indies (%)
Place of birth for the foreign-born population - Other Caribbean (%)
Place of birth for the foreign-born population - Belize (%)
Place of birth for the foreign-born population - Costa Rica (%)
Place of birth for the foreign-born population - El Salvador (%)
Place of birth for the foreign-born population - Guatemala (%)
Place of birth for the foreign-born population - Honduras (%)
Place of birth for the foreign-born population - Mexico (%)
Place of birth for the foreign-born population - Nicaragua (%)
Place of birth for the foreign-born population - Panama (%)
Place of birth for the foreign-born population - Other Central America (%)
Place of birth for the foreign-born population - Argentina (%)
Place of birth for the foreign-born population - Bolivia (%)
Place of birth for the foreign-born population - Brazil (%)
Place of birth for the foreign-born population - Chile (%)
Place of birth for the foreign-born population - Colombia (%)
Place of birth for the foreign-born population - Ecuador (%)
Place of birth for the foreign-born population - Guyana (%)
Place of birth for the foreign-born population - Peru (%)
Place of birth for the foreign-born population - Uruguay (%)
Place of birth for the foreign-born population - Venezuela (%)
Place of birth for the foreign-born population - Other South America (%)
Place of birth for the foreign-born population - Canada (%)
Place of birth for the foreign-born population - Other Northern America (%)
Place of birth for the foreign-born population - Other (%)
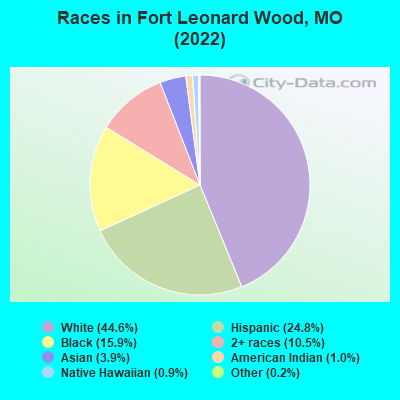
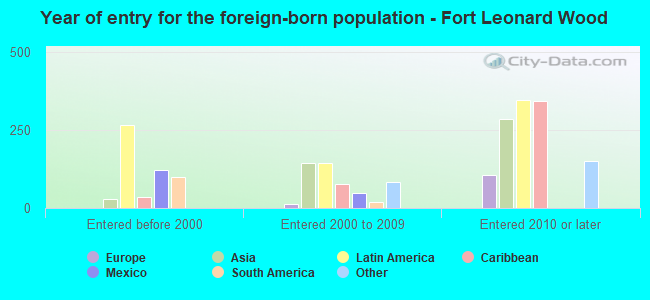
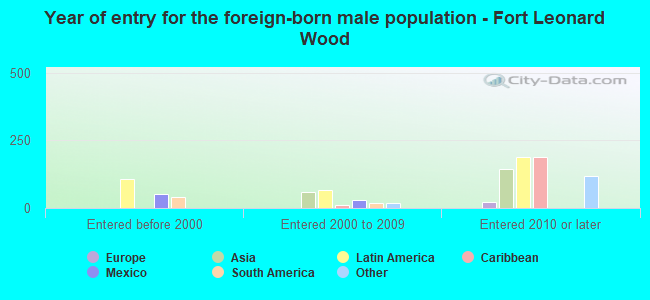
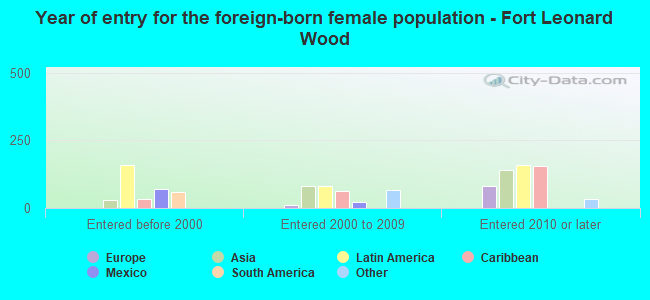
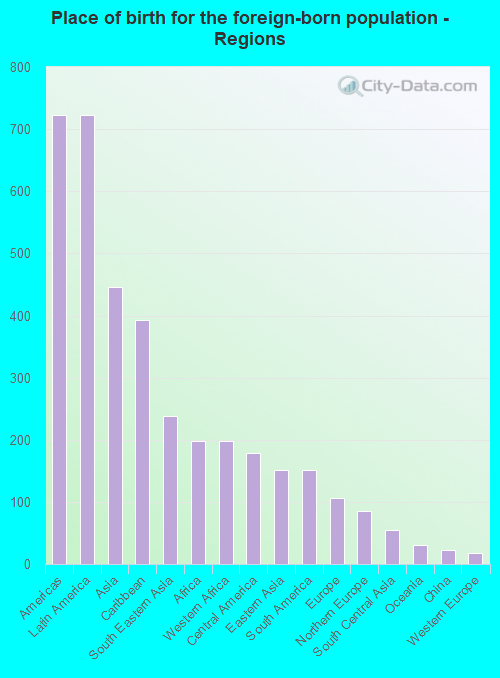
According to 2022 data, the most numerous races in Fort Leonard Wood, MO are White alone (6,992 residents), Black alone (2,499 residents), and Two or more races (1,648 residents). 75.8% of Fort Leonard Wood residents speak English at home. 9.6% of Fort Leonard Wood, MO residents are foreign-born (4.7% born in Latin America, 2.9% born in Asia, 1.3% born in Africa), which is 58.4% greater than the foreign-born rate of 4.0% across the entire state of Missouri.
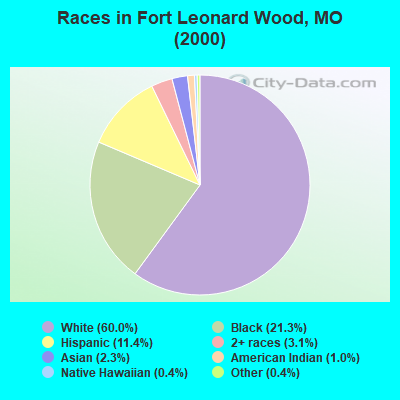
Race distribution in Fort Leonard Wood
2000 2022
4,686,474 83.8% White alone 625,667 11.2% Black alone 118,592 2.1% Hispanic 71,905 1.3% Two or more races 61,041 1.1% Asian alone 23,302 0.4% American Indian alone 5,291 0.09% Other race alone 2,939 0.05% Native Hawaiian and Other
4,733,411 76.6% White alone 656,739 10.6% Black alone 316,300 5.1% Two or more races 291,763 4.7% Hispanic 132,436 2.1% Asian alone 27,467 0.4% Other race alone 12,313 0.2% American Indian alone 7,528 0.1% Native Hawaiian and Other
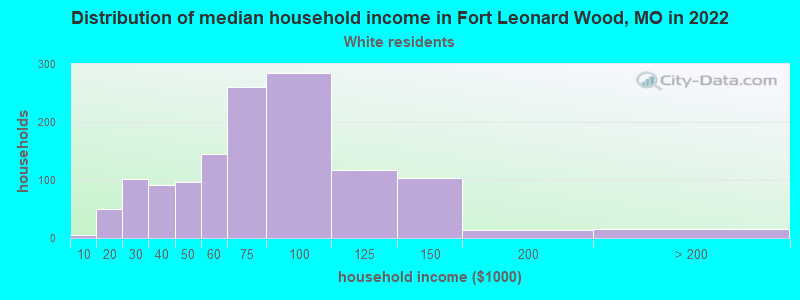
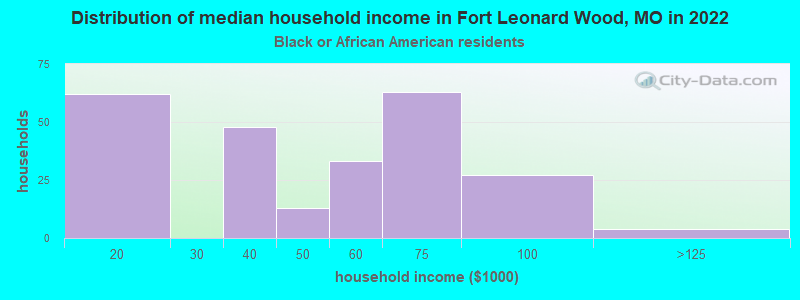
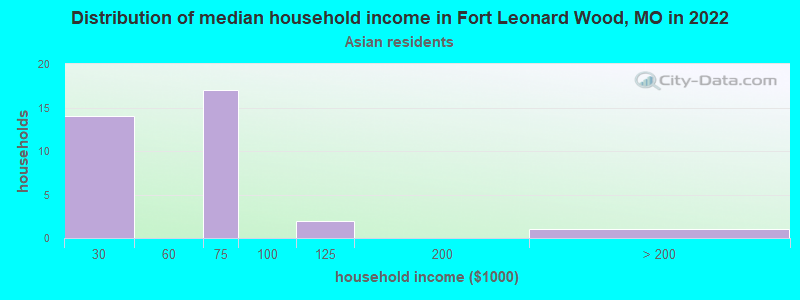
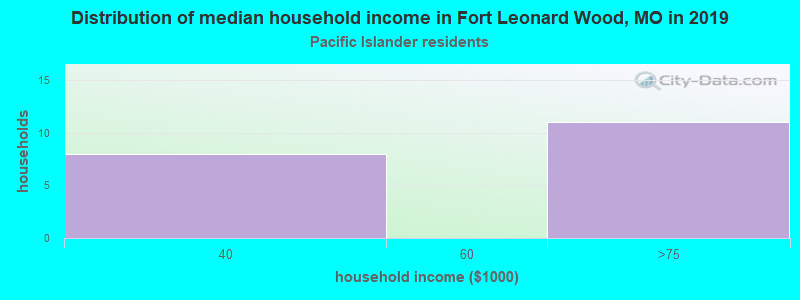
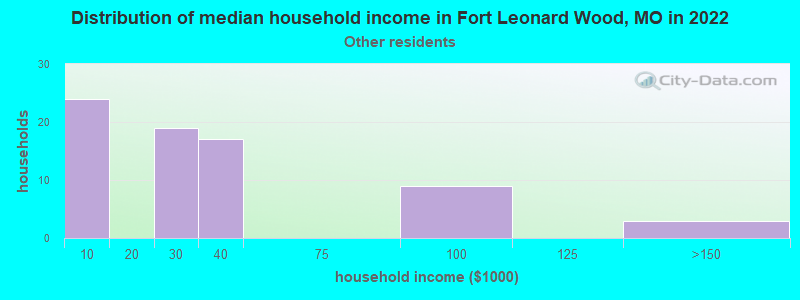
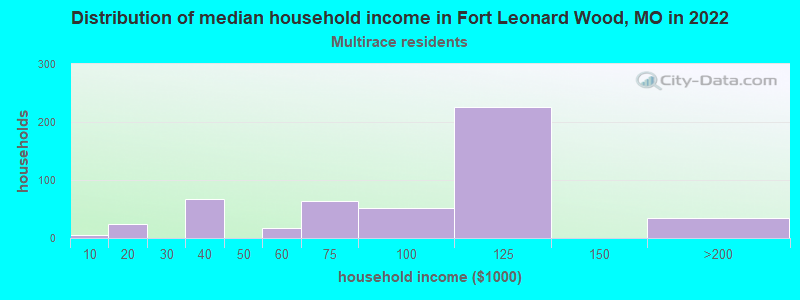
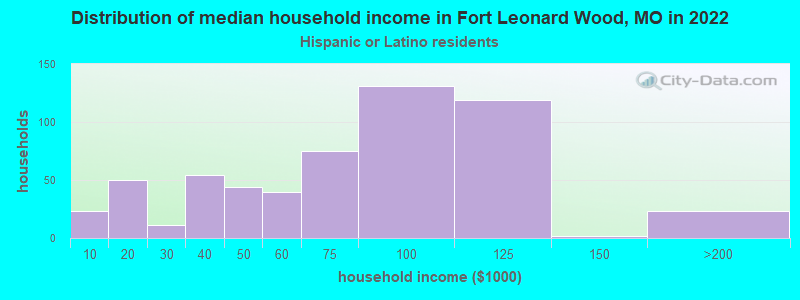
Income and house value in Fort Leonard Wood Median household income in 2022 $63,603 White non-Hispanic householders$50,965 Black householders$36,182 Native Hawaiian and other Pacific Islander householders$109,124 Two or more races householders$72,294 Hispanic or Latino race householdersMedian 2022 house value $-739,551,988 Black or African American householders
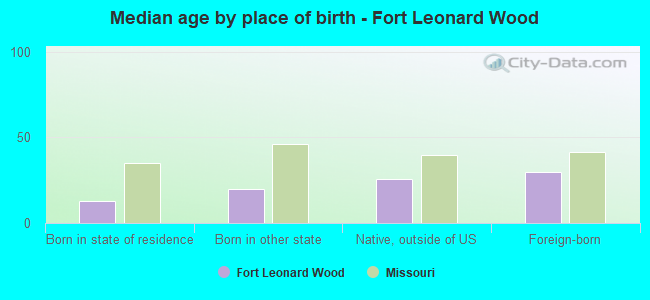
Median age by race in Fort Leonard Wood
20.1 Median age for White residents19.9 20.5 22.7 Median age for Black or African American residents21.1 24.0 23.2 Median age for American Indian / Alaska Native residents24.9 24.3 22.7 Median age for Asian residents23.7 22.5 29.7 Median age for Native Hawaiian / Pacific Islander residents28.8 36.7 28.9 Median age for Other race residents25.8 53.4 22.7 Median age for Two or more races residents22.9 23.5 19.9 Median age for White alone residents19.7 20.1 21.4 Median age for Hispanic or Latino residents21.4 24.4
Owner/renter occupied households by race in Fort Leonard Wood
House owners and renters - White residents 25 1.9% Owner occupied1,264 98.1% Renter occupiedHouse owners and renters - Black or African American residents 235 100.0% Renter occupiedHouse owners and renters - American Indian / Alaska Native residents 26 100.0% Renter occupiedHouse owners and renters - Asian residents 45 100.0% Renter occupiedHouse owners and renters - Native Hawaiian / Pacific Islander residents 54 100.0% Renter occupiedHouse owners and renters - Other race residents 65 100.0% Renter occupiedHouse owners and renters - Two or more races residents 471 100.0% Renter occupiedHouse owners and renters - White alone residents 25 2.2% Owner occupied1,121 97.8% Renter occupiedHouse owners and renters - Hispanic or Latino residents 543 100.0% Renter occupied
Language usage in Fort Leonard Wood
English speakers - Total 75.8% of residents of Fort Leonard Wood speak English at home.
17.3% of residents speak Spanish at home 2,090 81.6% Speak English very well470 18.4% Speak English less than very well7.2% of residents speak other language at home 642 60.5% Speak English very well420 39.5% Speak English less than very well
English speakers - Born in the United States 79.8% of residents of Fort Leonard Wood speak English at home.
18.0% of residents speak Spanish at home 1,849 86.8% Speak English very well280 13.2% Speak English less than very well3.6% of residents speak other language at home 222 51.6% Speak English very well208 48.4% Speak English less than very well
English speakers - Native, born elsewhere 45.9% of residents of Fort Leonard Wood speak English at home.
45.9% of residents speak Spanish at home 114 55.3% Speak English very well92 44.7% Speak English less than very well2.7% of residents speak other language at home 12 100.0% Speak English very well
English speakers - Foreign-born 34.5% of residents of Fort Leonard Wood speak English at home.
24.0% of residents speak Spanish at home 221 63.1% Speak English very well129 36.9% Speak English less than very well40.2% of residents speak other language at home 382 65.2% Speak English very well204 34.8% Speak English less than very well
White (Caucasian) - Speak only English Native:
83.5% (6,589)Foreign-born:
22.1% (39)
White (Caucasian) - Speak another language Native:
14.8% (1,165)Foreign-born:
77.7% (137)
Black or African American - Speak only English Native:
87.6% (1,850)Foreign-born:
59.7% (327)
Black or African American - Speak another language Native:
16.7% (354)Foreign-born:
40.8% (224)
Asian - Speak only English Native:
54.8% (80)Foreign-born:
28.6% (122)
Asian - Speak another language Native:
43.5% (63)Foreign-born:
71.3% (305)
Native Hawaiian / Pacific Islander - Speak only English Native:
66.4% (78)Foreign-born:
40.5% (9)
Native Hawaiian / Pacific Islander - Speak another language Native:
34.8% (41)Foreign-born:
61.1% (14)
Other race - Speak another language Native:
75.1% (150)Foreign-born:
94.9% (128)
Two or more races - Speak only English Native:
67.5% (2,244)Foreign-born:
22.9% (43)
Two or more races - Speak another language Native:
36.7% (1,221)Foreign-born:
67.6% (127)
White alone - Speak only English Native:
94.2% (6,035)Foreign-born:
62.5% (39)
White alone - Speak another language Native:
6.0% (386)Foreign-born:
30.6% (19)
Hispanic or Latino - Speak another language Native:
55.9% (1,915)Foreign-born:
99.4% (355)
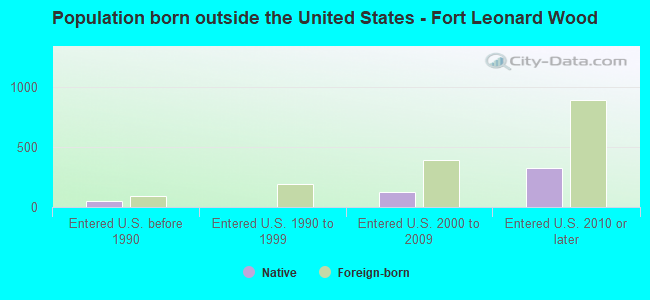
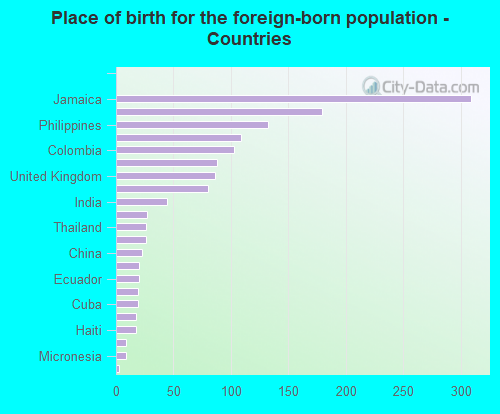
Foreign-born residents in Fort Leonard Wood 1,506 residents are foreign born (4.7% Latin America , 2.9% Asia , 1.3% Africa ).
This city:
9.6%Missouri:
4.2%
Marital status for residents in Fort Leonard Wood Marital status - White (Caucasian) population 15 years and over
Males 72.1% Never married27.0% Now married0.6% Separated0.0% Widowed0.3% DivorcedFemales 53.6% Never married39.3% Now married0.7% Separated0.0% Widowed6.5% DivorcedWomen who gave birth in the past 12 months Now married:
81.6% (82)Unmarried:
18.4% (19)
Women who did not give birth in the past 12 months Now married:
38.5% (875)Unmarried:
61.5% (1,399)
Marital status - Black or African American population 15 years and over
Males 74.6% Never married23.9% Now married0.0% Separated0.0% Widowed1.5% DivorcedFemales 67.8% Never married26.8% Now married0.0% Separated0.3% Widowed5.1% DivorcedWomen who did not give birth in the past 12 months Now married:
25.7% (332)Unmarried:
74.3% (957)
Marital status - American Indian / Alaska Native population 15 years and over
Males 87.7% Never married12.3% Now married0.0% Separated0.0% Widowed0.0% DivorcedFemales 100.0% Never married0.0% Now married0.0% Separated0.0% Widowed0.0% DivorcedWomen who did not give birth in the past 12 months Now married:
0.0% (0)Unmarried:
100.0% (55)
Marital status - Asian population 15 years and over
Males 56.5% Never married43.5% Now married0.0% Separated0.0% Widowed0.0% DivorcedFemales 44.5% Never married55.5% Now married0.0% Separated0.0% Widowed0.0% DivorcedWomen who did not give birth in the past 12 months Now married:
55.5% (143)Unmarried:
44.5% (114)
Marital status - Native Hawaiian / Pacific Islander population 15 years and over
Males 41.6% Never married31.7% Now married0.0% Separated0.0% Widowed26.7% DivorcedFemales 0.0% Never married100.0% Now married0.0% Separated0.0% Widowed0.0% DivorcedWomen who gave birth in the past 12 months Now married:
100.0% (12)Unmarried:
0.0% (0)
Women who did not give birth in the past 12 months Now married:
100.0% (20)Unmarried:
0.0% (0)
Marital status - Other race population 15 years and over
Males 32.4% Never married37.2% Now married0.0% Separated0.0% Widowed30.3% DivorcedFemales 0.0% Never married37.5% Now married0.0% Separated62.5% Widowed0.0% DivorcedWomen who gave birth in the past 12 months Now married:
100.0% (15)Unmarried:
0.0% (0)
Women who did not give birth in the past 12 months Now married:
100.0% (18)Unmarried:
0.0% (0)
Marital status - Two or more races population 15 years and over
Males 89.6% Never married10.4% Now married0.0% Separated0.0% Widowed0.0% DivorcedFemales 33.1% Never married55.5% Now married0.0% Separated0.0% Widowed11.4% DivorcedWomen who did not give birth in the past 12 months Now married:
55.5% (554)Unmarried:
44.5% (444)
Marital status - White alone, not Hispanic / Latino population 15 years and over
Males 72.2% Never married26.8% Now married0.7% Separated0.0% Widowed0.3% DivorcedFemales 56.7% Never married36.3% Now married0.0% Separated0.0% Widowed7.0% DivorcedWomen who gave birth in the past 12 months Now married:
81.2% (81)Unmarried:
18.8% (19)
Women who did not give birth in the past 12 months Now married:
34.7% (607)Unmarried:
65.3% (1,143)
Marital status - Hispanic or Latino population 15 years and over
Males 74.3% Never married23.4% Now married0.0% Separated0.0% Widowed2.4% DivorcedFemales 33.8% Never married54.5% Now married1.4% Separated3.7% Widowed6.6% DivorcedWomen who gave birth in the past 12 months Now married:
100.0% (15)Unmarried:
0.0% (0)
Women who did not give birth in the past 12 months Now married:
56.9% (712)Unmarried:
43.1% (540)
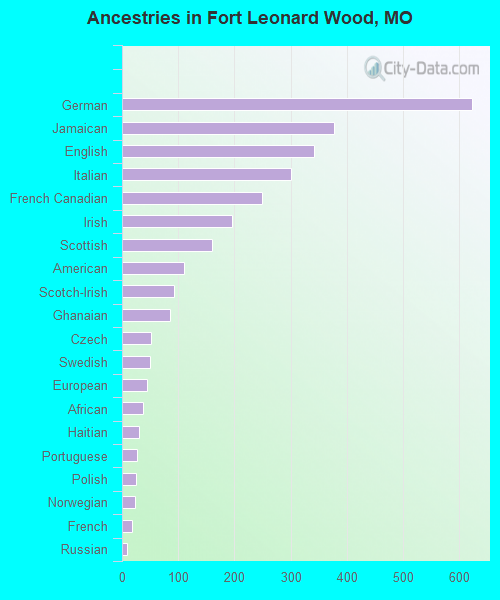
Ancestries in Fort Leonard Wood
622 8.6% German378 5.2% Jamaican341 4.7% English300 4.1% Italian250 3.5% French Canadian196 2.7% Irish161 2.2% Scottish110 1.5% American93 1.3% Scotch-Irish86 1.2% Ghanaian52 0.7% Czech50 0.7% Swedish45 0.6% European38 0.5% African30 0.4% Haitian26 0.4% Portuguese25 0.3% Polish24 0.3% Norwegian17 0.2% French9 0.1% Russian
Geographical mobility in Fort Leonard Wood Same house 1 year ago 3,547 41.2% White (Caucasian)648 24.7% Black or African American61 33.3% American Indian / Alaska Native292 45.7% Asian115 65.9% Native Hawaiian / Pacific Islander185 54.6% Other race1,483 39.8% Two or more races2,893 41.8% White alone, not Hispanic / Latino1,651 42.7% Hispanic or LatinoMoved within same county 163 1.9% White / Caucasian12 0.4% Black or African American156 2.2% White alone, not Hispanic / Latino8 0.2% Hispanic or LatinoMoved within same state 123 1.4% White / Caucasian20 0.8% Black or African American60 1.6% Two or more races124 1.8% White alone, not Hispanic / LatinoMoved from different state 4,799 55.7% White / Caucasian1,820 69.4% Black or African American131 71.7% American Indian / Alaska Native319 50.0% Asian48 27.2% Native Hawaiian / Pacific Islander135 39.8% Other race2,050 55.0% Two or more races3,860 55.8% White alone, not Hispanic / Latino2,189 56.6% Hispanic or LatinoMoved from abroad 183 2.1% White20 0.8% Black or African American32 5.0% Asian9 5.2% Native Hawaiian / Pacific Islander23 6.9% Other race297 8.0% Two or more races79 1.1% White alone, not Hispanic / Latino284 7.3% Hispanic or Latino
Children Nativity (place of birth) in Fort Leonard Wood
Children under 6 years - Living with two parents Both parents native 723 100.0% NativeBoth parents foreign-born 71 75.9% Native23 24.1% Foreign-bornOne native, one foreign-born parent 60 72.6% Native23 27.4% Foreign-bornChildren under 6 years - Living with one parent Native parent 180 100.0% NativeChildren 6 to 17 years - Living with two parents Both parents native 1,162 100.0% NativeBoth parents foreign-born 94 93.7% Native6 6.3% Foreign-bornOne native, one foreign-born parent 148 87.3% Native21 12.7% Foreign-bornChildren 6 to 17 years - Living with one parent Native parent 134 100.0% Native
Grandparents responsible for own grandchildren in Fort Leonard Wood
Grandparents (30 to 59 years) White / Caucasian 12 50.9% Responsible for grandchildren12 49.1% Not responsible for grandchildrenWhite alone, not Hispanic / Latino 12 100.0% Not responsible for grandchildrenHispanic or Latino 18 100.0% Responsible for grandchildren
Grandparents (60 years and over) White / Caucasian 16 100.0% Responsible for grandchildrenWhite alone, not Hispanic / Latino 16 100.0% Responsible for grandchildrenHispanic or Latino 27 100.0% Not responsible for grandchildren