Races in Fort Pierce North, Florida (FL) Detailed Stats
Data:
Races - White alone (%)
Races - White alone (% change since 2000)
Races - Black alone (%)
Races - Black alone (% change since 2000)
Races - American Indian alone (%)
Races - American Indian alone (% change since 2000)
Races - Asian alone (%)
Races - Asian alone (% change since 2000)
Races - Hispanic (%)
Races - Hispanic (% change since 2000)
Races - Native Hawaiian and Other Pacific Islander alone (%)
Races - Native Hawaiian and Other Pacific Islander alone (% change since 2000)
Races - Two or more races(%)
Races - Two or more races(% change since 2000)
Races - Other race alone (%)
Races - Other race alone (% change since 2000)
Racial diversity
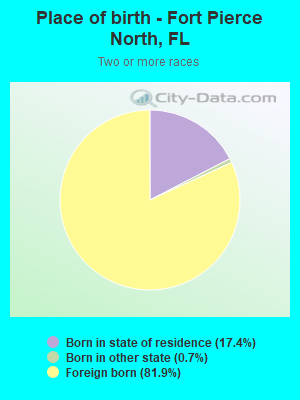
Place of birth - Born in state of residence (%)
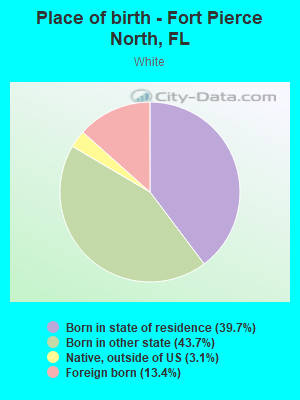
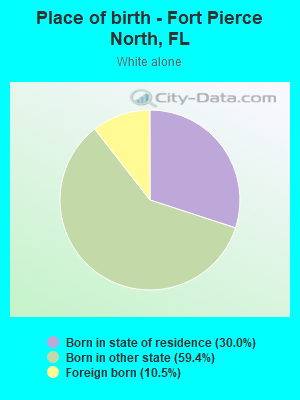
Place of birth - Born in state of residence (%) - White
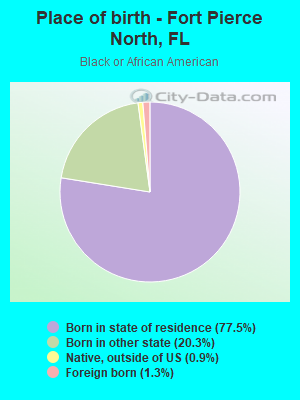
Place of birth - Born in state of residence (%) - Black or African American
Place of birth - Born in state of residence (%) - Asian
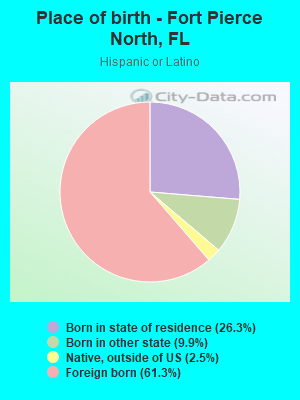
Place of birth - Born in state of residence (%) - Hispanic or Latino
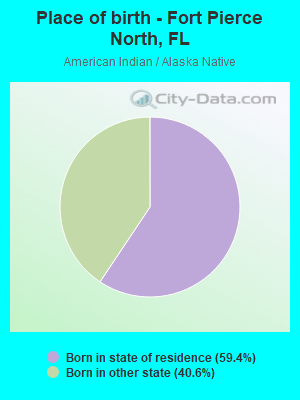
Place of birth - Born in state of residence (%) - American Indian and Alaska Native
Place of birth - Born in state of residence (%) - Multirace
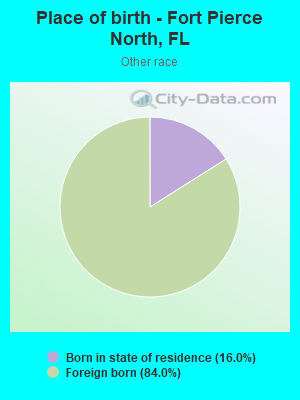
Place of birth - Born in state of residence (%) - Other Race
Place of birth - Born in other state (%)
Place of birth - Born in other state (%) - White
Place of birth - Born in other state (%) - Black or African American
Place of birth - Born in other state (%) - Asian
Place of birth - Born in other state (%) - Hispanic or Latino
Place of birth - Born in other state (%) - American Indian and Alaska Native
Place of birth - Born in other state (%) - Multirace
Place of birth - Born in other state (%) - Other Race
Place of birth - Native, outside of US (%)
Place of birth - Native, outside of US (%) - White
Place of birth - Native, outside of US (%) - Black or African American
Place of birth - Native, outside of US (%) - Asian
Place of birth - Native, outside of US (%) - Hispanic or Latino
Place of birth - Native, outside of US (%) - American Indian and Alaska Native
Place of birth - Native, outside of US (%) - Multirace
Place of birth - Native, outside of US (%) - Other Race
Place of birth - Foreign born (%)
Place of birth - Foreign born (%) - White
Place of birth - Foreign born (%) - Black or African American
Place of birth - Foreign born (%) - Asian
Place of birth - Foreign born (%) - Hispanic or Latino
Place of birth - Foreign born (%) - American Indian and Alaska Native
Place of birth - Foreign born (%) - Multirace
Place of birth - Foreign born (%) - Other Race
Residents speaking English at home (%)
Residents speaking English at home - Born in the United States (%)
Residents speaking English at home - Native, born elsewhere (%)
Residents speaking English at home - Foreign born (%)
Residents speaking Spanish at home (%)
Residents speaking Spanish at home - Born in the United States (%)
Residents speaking Spanish at home - Native, born elsewhere (%)
Residents speaking Spanish at home - Foreign born (%)
Residents speaking other language at home (%)
Residents speaking other language at home - Born in the United States (%)
Residents speaking other language at home - Native, born elsewhere (%)
Residents speaking other language at home - Foreign born (%)
Marital status - Never married (%)
Marital status - Now married (%)
Marital status - Separated (%)
Marital status - Widowed (%)
Marital status - Divorced (%)
Ancestries Reported - Arab (%)
Ancestries Reported - Czech (%)
Ancestries Reported - Danish (%)
Ancestries Reported - Dutch (%)
Ancestries Reported - English (%)
Ancestries Reported - French (%)
Ancestries Reported - French Canadian (%)
Ancestries Reported - German (%)
Ancestries Reported - Greek (%)
Ancestries Reported - Hungarian (%)
Ancestries Reported - Irish (%)
Ancestries Reported - Italian (%)
Ancestries Reported - Lithuanian (%)
Ancestries Reported - Norwegian (%)
Ancestries Reported - Polish (%)
Ancestries Reported - Portuguese (%)
Ancestries Reported - Russian (%)
Ancestries Reported - Scotch-Irish (%)
Ancestries Reported - Scottish (%)
Ancestries Reported - Slovak (%)
Ancestries Reported - Subsaharan African (%)
Ancestries Reported - Swedish (%)
Ancestries Reported - Swiss (%)
Ancestries Reported - Ukrainian (%)
Ancestries Reported - United States (%)
Ancestries Reported - Welsh (%)
Ancestries Reported - West Indian (%)
Ancestries Reported - Other (%)
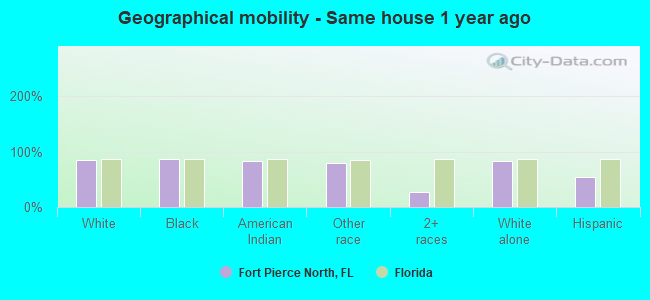
Geographical mobility - Same house 1 year ago (%)
Geographical mobility - Same house 1 year ago (%) - White
Geographical mobility - Same house 1 year ago (%) - Black or African American
Geographical mobility - Same house 1 year ago (%) - Asian
Geographical mobility - Same house 1 year ago (%) - Hispanic or Latino
Geographical mobility - Same house 1 year ago (%) - American Indian and Alaska Native
Geographical mobility - Same house 1 year ago (%) - Multirace
Geographical mobility - Same house 1 year ago (%) - Other Race
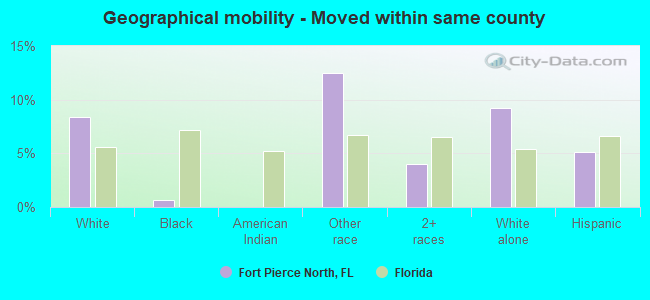
Geographical mobility - Moved within same county (%)
Geographical mobility - Moved within same county (%) - White
Geographical mobility - Moved within same county (%) - Black or African American
Geographical mobility - Moved within same county (%) - Asian
Geographical mobility - Moved within same county (%) - Hispanic or Latino
Geographical mobility - Moved within same county (%) - American Indian and Alaska Native
Geographical mobility - Moved within same county (%) - Multirace
Geographical mobility - Moved within same county (%) - Other Race
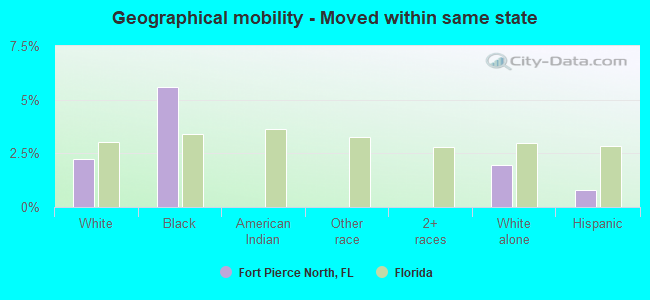
Geographical mobility - Moved from different county within same state (%)
Geographical mobility - Moved from different county within same state (%) - White
Geographical mobility - Moved from different county within same state (%) - Black or African American
Geographical mobility - Moved from different county within same state (%) - Asian
Geographical mobility - Moved from different county within same state (%) - Hispanic or Latino
Geographical mobility - Moved from different county within same state (%) - American Indian and Alaska Native
Geographical mobility - Moved from different county within same state (%) - Multirace
Geographical mobility - Moved from different county within same state (%) - Other Race
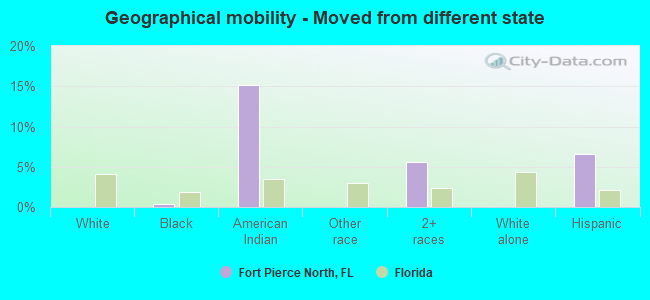
Geographical mobility - Moved from different state (%)
Geographical mobility - Moved from different state (%) - White
Geographical mobility - Moved from different state (%) - Black or African American
Geographical mobility - Moved from different state (%) - Asian
Geographical mobility - Moved from different state (%) - Hispanic or Latino
Geographical mobility - Moved from different state (%) - American Indian and Alaska Native
Geographical mobility - Moved from different state (%) - Multirace
Geographical mobility - Moved from different state (%) - Other Race
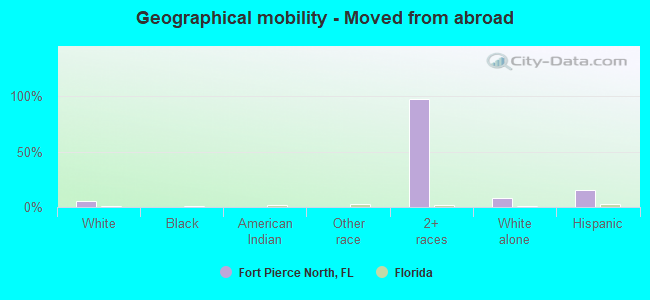
Geographical mobility - Moved from abroad (%)
Geographical mobility - Moved from abroad (%) - White
Geographical mobility - Moved from abroad (%) - Black or African American
Geographical mobility - Moved from abroad (%) - Asian
Geographical mobility - Moved from abroad (%) - Hispanic or Latino
Geographical mobility - Moved from abroad (%) - American Indian and Alaska Native
Geographical mobility - Moved from abroad (%) - Multirace
Geographical mobility - Moved from abroad (%) - Other Race
Place of birth for the foreign-born population - Ireland (%)
Place of birth for the foreign-born population - Denmark (%)
Place of birth for the foreign-born population - Norway (%)
Place of birth for the foreign-born population - Sweden (%)
Place of birth for the foreign-born population - United Kingdom (%)
Place of birth for the foreign-born population - England (%)
Place of birth for the foreign-born population - Scotland (%)
Place of birth for the foreign-born population - Other Northern Europe (%)
Place of birth for the foreign-born population - Austria (%)
Place of birth for the foreign-born population - Belgium (%)
Place of birth for the foreign-born population - France (%)
Place of birth for the foreign-born population - Germany (%)
Place of birth for the foreign-born population - Netherlands (%)
Place of birth for the foreign-born population - Switzerland (%)
Place of birth for the foreign-born population - Other Western Europe (%)
Place of birth for the foreign-born population - Greece (%)
Place of birth for the foreign-born population - Italy (%)
Place of birth for the foreign-born population - Portugal (%)
Place of birth for the foreign-born population - Spain (%)
Place of birth for the foreign-born population - Other Southern Europe (%)
Place of birth for the foreign-born population - Albania (%)
Place of birth for the foreign-born population - Belarus (%)
Place of birth for the foreign-born population - Bosnia and Herzegovina (%)
Place of birth for the foreign-born population - Bulgaria (%)
Place of birth for the foreign-born population - Croatia (%)
Place of birth for the foreign-born population - Czechoslovakia (%)
Place of birth for the foreign-born population - Hungary (%)
Place of birth for the foreign-born population - Latvia (%)
Place of birth for the foreign-born population - Lithuania (%)
Place of birth for the foreign-born population - North Macedonia (Macedonia) (%)
Place of birth for the foreign-born population - Moldova (%)
Place of birth for the foreign-born population - Poland (%)
Place of birth for the foreign-born population - Romania (%)
Place of birth for the foreign-born population - Russia (%)
Place of birth for the foreign-born population - Serbia (%)
Place of birth for the foreign-born population - Ukraine (%)
Place of birth for the foreign-born population - Other Eastern Europe (%)
Place of birth for the foreign-born population - China (%)
Place of birth for the foreign-born population - Hong Kong (%)
Place of birth for the foreign-born population - Taiwan (%)
Place of birth for the foreign-born population - Japan (%)
Place of birth for the foreign-born population - Korea (%)
Place of birth for the foreign-born population - Other Eastern Asia (%)
Place of birth for the foreign-born population - Afghanistan (%)
Place of birth for the foreign-born population - Bangladesh (%)
Place of birth for the foreign-born population - India (%)
Place of birth for the foreign-born population - Iran (%)
Place of birth for the foreign-born population - Kazakhstan (%)
Place of birth for the foreign-born population - Nepal (%)
Place of birth for the foreign-born population - Pakistan (%)
Place of birth for the foreign-born population - Sri Lanka (%)
Place of birth for the foreign-born population - Uzbekistan (%)
Place of birth for the foreign-born population - Other South Central Asia (%)
Place of birth for the foreign-born population - Burma (%)
Place of birth for the foreign-born population - Cambodia (%)
Place of birth for the foreign-born population - Indonesia (%)
Place of birth for the foreign-born population - Laos (%)
Place of birth for the foreign-born population - Malaysia (%)
Place of birth for the foreign-born population - Philippines (%)
Place of birth for the foreign-born population - Singapore (%)
Place of birth for the foreign-born population - Thailand (%)
Place of birth for the foreign-born population - Vietnam (%)
Place of birth for the foreign-born population - Other South Eastern Asia (%)
Place of birth for the foreign-born population - Armenia (%)
Place of birth for the foreign-born population - Iraq (%)
Place of birth for the foreign-born population - Israel (%)
Place of birth for the foreign-born population - Jordan (%)
Place of birth for the foreign-born population - Kuwait (%)
Place of birth for the foreign-born population - Lebanon (%)
Place of birth for the foreign-born population - Saudi Arabia (%)
Place of birth for the foreign-born population - Syria (%)
Place of birth for the foreign-born population - Turkey (%)
Place of birth for the foreign-born population - Yemen (%)
Place of birth for the foreign-born population - Other Western Asia (%)
Place of birth for the foreign-born population - Eritrea (%)
Place of birth for the foreign-born population - Ethiopia (%)
Place of birth for the foreign-born population - Kenya (%)
Place of birth for the foreign-born population - Somalia (%)
Place of birth for the foreign-born population - Uganda (%)
Place of birth for the foreign-born population - Zimbabwe (%)
Place of birth for the foreign-born population - Other Eastern Africa (%)
Place of birth for the foreign-born population - Cameroon (%)
Place of birth for the foreign-born population - Congo (%)
Place of birth for the foreign-born population - Democratic Republic of Congo (Zaire) (%)
Place of birth for the foreign-born population - Other Middle Africa (%)
Place of birth for the foreign-born population - Egypt (%)
Place of birth for the foreign-born population - Morocco (%)
Place of birth for the foreign-born population - Sudan (%)
Place of birth for the foreign-born population - Other Northern Africa (%)
Place of birth for the foreign-born population - South Africa (%)
Place of birth for the foreign-born population - Other Southern Africa (%)
Place of birth for the foreign-born population - Cabo Verde (%)
Place of birth for the foreign-born population - Ghana (%)
Place of birth for the foreign-born population - Liberia (%)
Place of birth for the foreign-born population - Nigeria (%)
Place of birth for the foreign-born population - Senegal (%)
Place of birth for the foreign-born population - Sierra Leone (%)
Place of birth for the foreign-born population - Other Western Africa (%)
Place of birth for the foreign-born population - Australia (%)
Place of birth for the foreign-born population - New Zealand (%)
Place of birth for the foreign-born population - Fiji (%)
Place of birth for the foreign-born population - Micronesia (%)
Place of birth for the foreign-born population - Bahamas (%)
Place of birth for the foreign-born population - Barbados (%)
Place of birth for the foreign-born population - Cuba (%)
Place of birth for the foreign-born population - Dominica (%)
Place of birth for the foreign-born population - Dominican Republic (%)
Place of birth for the foreign-born population - Grenada (%)
Place of birth for the foreign-born population - Haiti (%)
Place of birth for the foreign-born population - Jamaica (%)
Place of birth for the foreign-born population - St. Vincent and the Grenadines (%)
Place of birth for the foreign-born population - Trinidad and Tobago (%)
Place of birth for the foreign-born population - West Indies (%)
Place of birth for the foreign-born population - Other Caribbean (%)
Place of birth for the foreign-born population - Belize (%)
Place of birth for the foreign-born population - Costa Rica (%)
Place of birth for the foreign-born population - El Salvador (%)
Place of birth for the foreign-born population - Guatemala (%)
Place of birth for the foreign-born population - Honduras (%)
Place of birth for the foreign-born population - Mexico (%)
Place of birth for the foreign-born population - Nicaragua (%)
Place of birth for the foreign-born population - Panama (%)
Place of birth for the foreign-born population - Other Central America (%)
Place of birth for the foreign-born population - Argentina (%)
Place of birth for the foreign-born population - Bolivia (%)
Place of birth for the foreign-born population - Brazil (%)
Place of birth for the foreign-born population - Chile (%)
Place of birth for the foreign-born population - Colombia (%)
Place of birth for the foreign-born population - Ecuador (%)
Place of birth for the foreign-born population - Guyana (%)
Place of birth for the foreign-born population - Peru (%)
Place of birth for the foreign-born population - Uruguay (%)
Place of birth for the foreign-born population - Venezuela (%)
Place of birth for the foreign-born population - Other South America (%)
Place of birth for the foreign-born population - Canada (%)
Place of birth for the foreign-born population - Other Northern America (%)
Place of birth for the foreign-born population - Other (%)
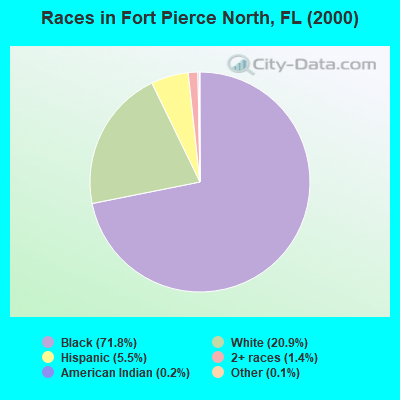
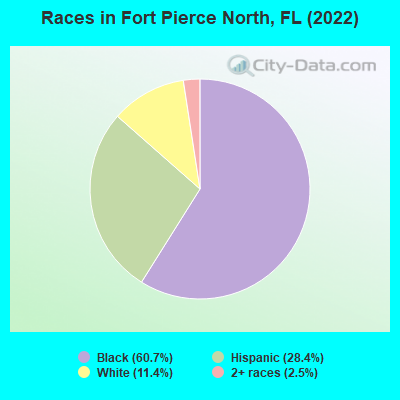
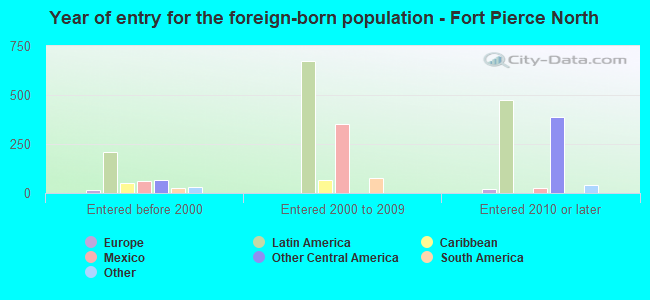
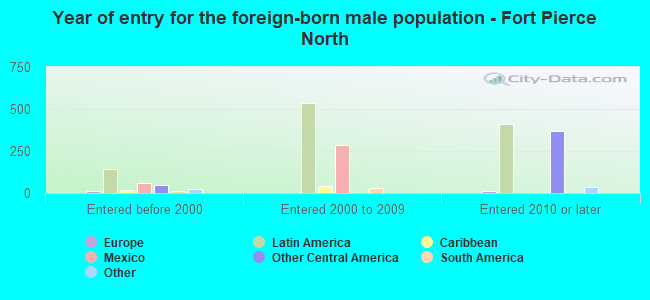
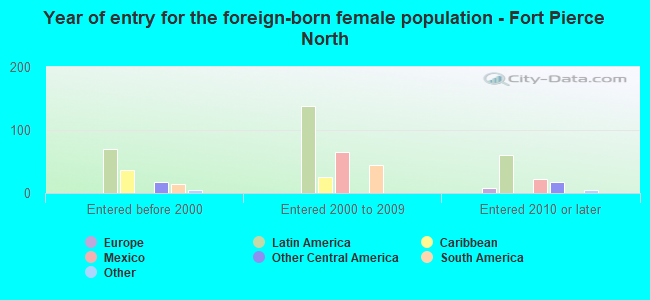
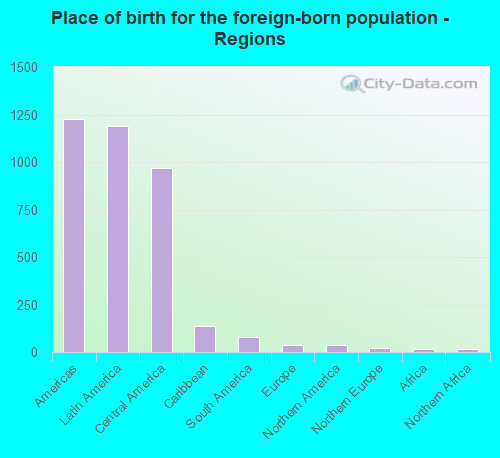
According to 2022 data, the most numerous races in Fort Pierce North, FL are White alone (795 residents), Hispanic (1,984 residents), and Black alone (4,238 residents). 74.2% of Fort Pierce North residents speak English at home. 18.4% of Fort Pierce North, FL residents are foreign-born (17.3% born in Latin America), which is 14.3% less than the foreign-born rate of 21.0% across the entire state of Florida.
Race distribution in Fort Pierce North
2000 2022
10,458,509 65.4% White alone 2,682,715 16.8% Hispanic 2,264,268 14.2% Black alone 261,693 1.6% Asian alone 236,954 1.5% Two or more races 42,358 0.3% American Indian alone 28,994 0.2% Other race alone 6,887 0.04% Native Hawaiian and Other
11,309,403 50.8% White alone 6,025,039 27.1% Hispanic 3,241,015 14.6% Black alone 861,630 3.9% Two or more races 623,692 2.8% Asian alone 152,054 0.7% Other race alone 22,504 0.1% American Indian alone 9,486 0.04% Native Hawaiian and Other
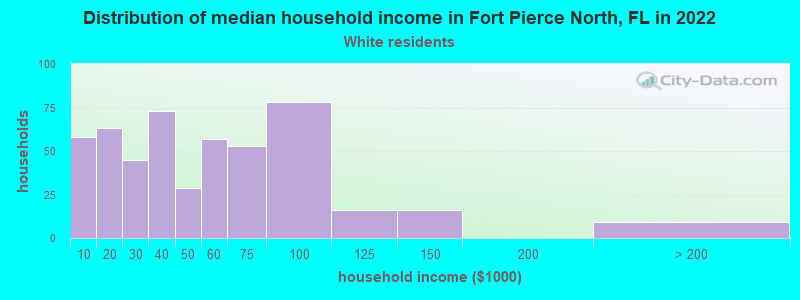
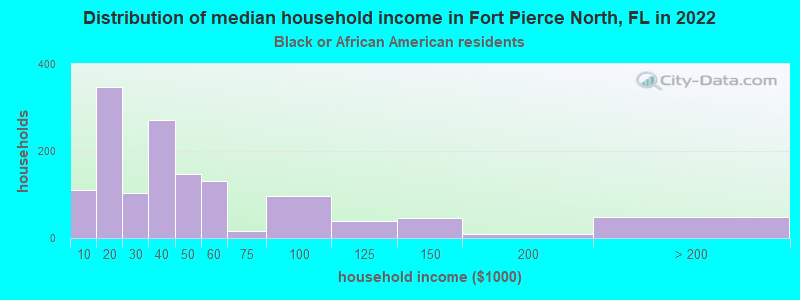
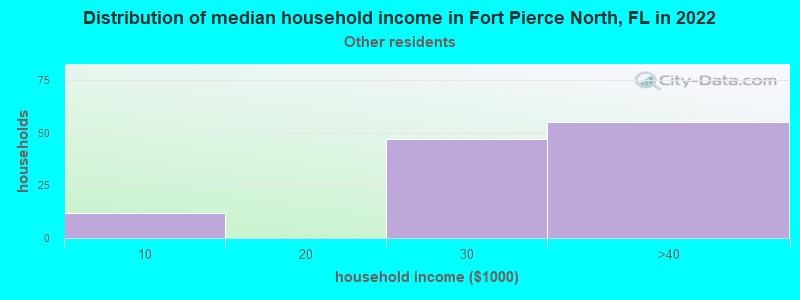
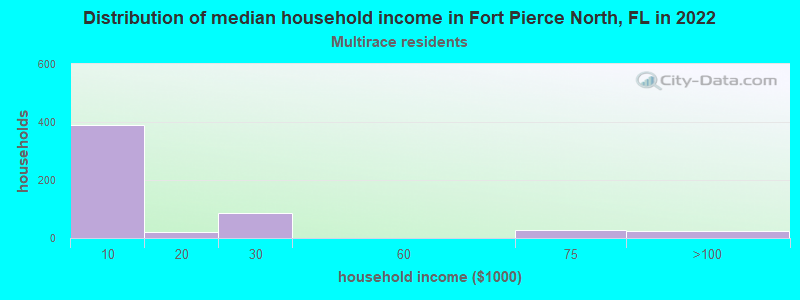
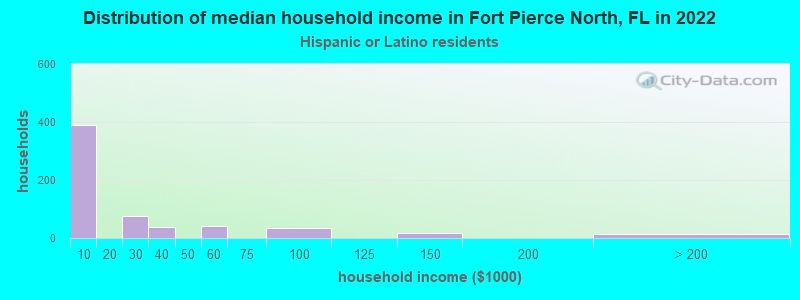
Income and house value in Fort Pierce North Median household income in 2022 $39,581 White non-Hispanic householders$35,732 Black householders$2,207 Two or more races householders$2,770 Hispanic or Latino race householdersMedian 2022 house value $141,763 White Non-Hispanic householders$167,057 Black or African American householders$180,678 Some other race householders$154,827 Two or more races householders$182,902 Hispanic or Latino householders
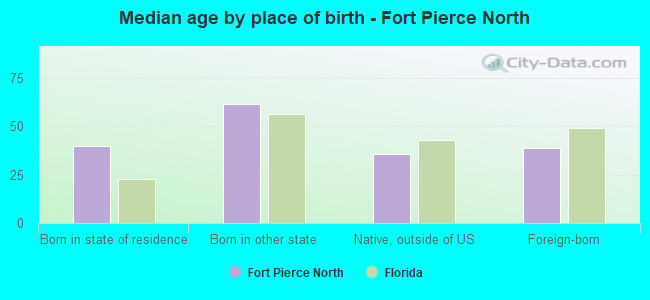
Median age by race in Fort Pierce North
49.3 Median age for White residents45.4 49.8 49.5 Median age for Black or African American residents46.5 53.1 29.7 Median age for American Indian / Alaska Native residents-611,418,047.3 -594,925,633.7 -688,271,604.2 Median age for Asian residents-717,695,472.5 -668,109,667.4 -660,215,053.1 Median age for Native Hawaiian / Pacific Islander residents-662,309,367.5 -668,008,047.6 33.6 Median age for Other race residents32.9 41.6 39.9 Median age for Two or more races residents39.5 63.0 62.0 Median age for White alone residents64.5 57.4 36.8 Median age for Hispanic or Latino residents39.0 35.6
Owner/renter occupied households by race in Fort Pierce North
House owners and renters - White residents 366 75.8% Owner occupied117 24.2% Renter occupiedHouse owners and renters - Black or African American residents 1,027 70.0% Owner occupied440 30.0% Renter occupiedHouse owners and renters - American Indian / Alaska Native residents 60 100.0% Renter occupiedHouse owners and renters - Other race residents 110 85.8% Owner occupied18 14.2% Renter occupiedHouse owners and renters - Two or more races residents 168 25.7% Owner occupied485 74.3% Renter occupiedHouse owners and renters - White alone residents 328 77.5% Owner occupied95 22.5% Renter occupiedHouse owners and renters - Hispanic or Latino residents 189 29.9% Owner occupied441 70.1% Renter occupied
Language usage in Fort Pierce North
English speakers - Total 74.2% of residents of Fort Pierce North speak English at home.
24.6% of residents speak Spanish at home 532 31.9% Speak English very well1,136 68.1% Speak English less than very well2.0% of residents speak other language at home 24 17.5% Speak English very well113 82.5% Speak English less than very well
English speakers - Born in the United States 95.2% of residents of Fort Pierce North speak English at home.
4.7% of residents speak Spanish at home 74 100.0% Speak English very well0.8% of residents speak other language at home 6 46.2% Speak English very well7 53.8% Speak English less than very well
English speakers - Native, born elsewhere 36.8% of residents of Fort Pierce North speak English at home.
60.5% of residents speak Spanish at home 20 43.5% Speak English very well26 56.5% Speak English less than very well
English speakers - Foreign-born 5.9% of residents of Fort Pierce North speak English at home.
90.4% of residents speak Spanish at home 151 12.5% Speak English very well1,059 87.5% Speak English less than very well8.6% of residents speak other language at home 14 12.2% Speak English very well101 87.8% Speak English less than very well
White (Caucasian) - Speak only English Native:
78.6% (792)Foreign-born:
26.8% (46)
White (Caucasian) - Speak another language Native:
20.1% (203)Foreign-born:
69.1% (118)
Black or African American - Speak only English Native:
100.0% (4,166)Foreign-born:
52.1% (28)
Black or African American - Speak another language Native:
0.3% (12)Foreign-born:
33.7% (18)
White alone - Speak only English Native:
98.0% (685)Foreign-born:
46.2% (39)
White alone - Speak another language Native:
1.8% (13)Foreign-born:
53.7% (45)
Hispanic or Latino - Speak only English Native:
36.0% (235)Foreign-born:
1.5% (18)
Hispanic or Latino - Speak another language Native:
63.1% (412)Foreign-born:
97.5% (1,202)
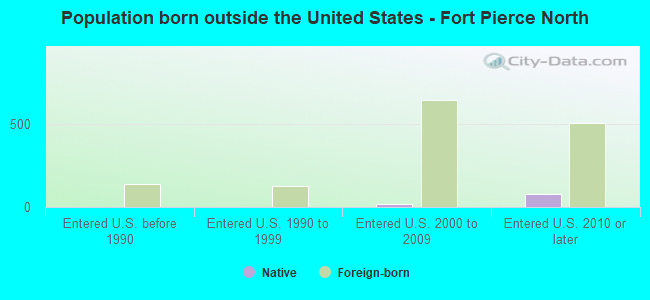
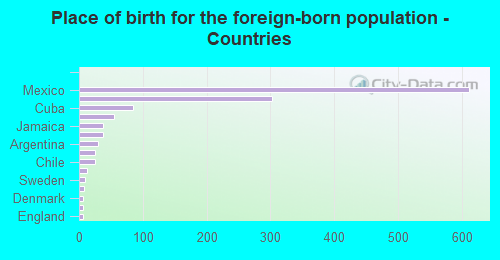
Foreign-born residents in Fort Pierce North 1,284 residents are foreign born (17.3% Latin America ).
This city:
18.4%Florida:
21.1%
Marital status for residents in Fort Pierce North Marital status - White (Caucasian) population 15 years and over
Males 27.4% Never married48.0% Now married0.8% Separated6.5% Widowed17.3% DivorcedFemales 12.0% Never married39.5% Now married4.0% Separated14.0% Widowed30.4% DivorcedWomen who gave birth in the past 12 months Now married:
100.0% (31)Unmarried:
0.0% (0)
Women who did not give birth in the past 12 months Now married:
34.3% (77)Unmarried:
65.7% (148)
Marital status - Black or African American population 15 years and over
Males 57.8% Never married27.3% Now married1.4% Separated7.2% Widowed6.2% DivorcedFemales 34.4% Never married22.5% Now married4.0% Separated25.1% Widowed14.0% DivorcedWomen who gave birth in the past 12 months Now married:
0.0% (0)Unmarried:
100.0% (35)
Women who did not give birth in the past 12 months Now married:
9.9% (71)Unmarried:
90.1% (648)
Marital status - American Indian / Alaska Native population 15 years and over
Males 0.0% Never married0.0% Now married100.0% Separated0.0% Widowed0.0% DivorcedFemales 100.0% Never married0.0% Now married0.0% Separated0.0% Widowed0.0% DivorcedWomen who did not give birth in the past 12 months Now married:
0.0% (0)Unmarried:
100.0% (231)
Marital status - Other race population 15 years and over
Males 7.6% Never married92.4% Now married0.0% Separated0.0% Widowed0.0% DivorcedFemales 0.0% Never married83.7% Now married16.3% Separated0.0% Widowed0.0% DivorcedWomen who gave birth in the past 12 months Now married:
100.0% (20)Unmarried:
0.0% (0)
Women who did not give birth in the past 12 months Now married:
100.0% (103)Unmarried:
0.0% (0)
Marital status - Two or more races population 15 years and over
Males 87.5% Never married11.3% Now married1.2% Separated0.0% Widowed0.0% DivorcedFemales 0.0% Never married29.6% Now married0.0% Separated19.7% Widowed50.7% DivorcedMarital status - White alone, not Hispanic / Latino population 15 years and over
Males 7.6% Never married42.8% Now married1.6% Separated13.2% Widowed34.8% DivorcedFemales 13.5% Never married28.5% Now married5.1% Separated17.5% Widowed35.3% DivorcedWomen who did not give birth in the past 12 months Now married:
22.6% (44)Unmarried:
77.4% (149)
Marital status - Hispanic or Latino population 15 years and over
Males 67.1% Never married29.1% Now married3.8% Separated0.0% Widowed0.0% DivorcedFemales 41.9% Never married49.7% Now married3.9% Separated0.3% Widowed4.2% DivorcedWomen who gave birth in the past 12 months Now married:
100.0% (53)Unmarried:
0.0% (0)
Women who did not give birth in the past 12 months Now married:
42.5% (124)Unmarried:
57.5% (168)
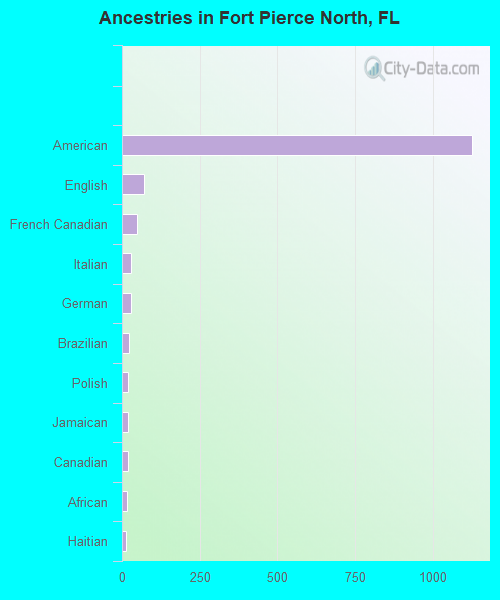
Ancestries in Fort Pierce North
1,124 25.2% American70 1.6% English48 1.1% French Canadian29 0.7% Italian28 0.6% German24 0.5% Brazilian20 0.4% Polish20 0.4% Jamaican18 0.4% Canadian15 0.3% African14 0.3% Haitian9 0.2% Swedish8 0.2% Dutch7 0.2% French7 0.2% Greek6 0.1% Scotch-Irish5 0.1% Czech5 0.1% Irish
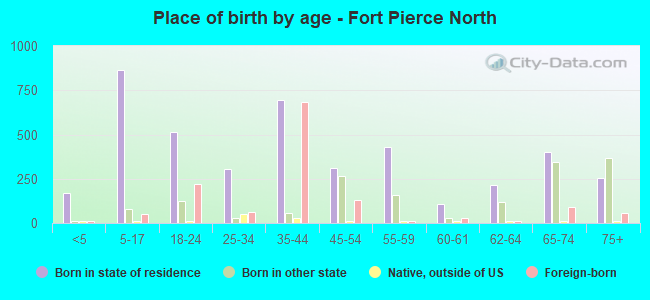
Children Nativity (place of birth) in Fort Pierce North
Children under 6 years - Living with two parents Both parents foreign-born 62 100.0% NativeOne native, one foreign-born parent 53 100.0% NativeChildren under 6 years - Living with one parent Native parent 109 100.0% NativeForeign-born parent 13 100.0% NativeChildren 6 to 17 years - Living with two parents Both parents native 70 100.0% NativeBoth parents foreign-born 63 50.9% Native61 49.1% Foreign-bornOne native, one foreign-born parent 89 100.0% NativeChildren 6 to 17 years - Living with one parent Native parent 589 100.0% Native
Grandparents responsible for own grandchildren in Fort Pierce North
Grandparents (30 to 59 years) White / Caucasian 17 100.0% Responsible for grandchildrenBlack or African American 41 100.0% Responsible for grandchildrenOther race 21 38.3% Responsible for grandchildren34 61.7% Not responsible for grandchildrenWhite alone, not Hispanic / Latino 17 100.0% Responsible for grandchildrenHispanic or Latino 17 39.8% Responsible for grandchildren25 60.2% Not responsible for grandchildrenGrandparents (60 years and over) White / Caucasian 9 32.5% Responsible for grandchildren19 67.5% Not responsible for grandchildrenBlack or African American 74 45.9% Responsible for grandchildren87 54.1% Not responsible for grandchildrenWhite alone, not Hispanic / Latino 10 100.0% Responsible for grandchildrenHispanic or Latino 20 100.0% Not responsible for grandchildren