Races in Fort Polk South, Louisiana (LA) Detailed Stats
Data:
Races - White alone (%)
Races - White alone (% change since 2000)
Races - Black alone (%)
Races - Black alone (% change since 2000)
Races - American Indian alone (%)
Races - American Indian alone (% change since 2000)
Races - Asian alone (%)
Races - Asian alone (% change since 2000)
Races - Hispanic (%)
Races - Hispanic (% change since 2000)
Races - Native Hawaiian and Other Pacific Islander alone (%)
Races - Native Hawaiian and Other Pacific Islander alone (% change since 2000)
Races - Two or more races(%)
Races - Two or more races(% change since 2000)
Races - Other race alone (%)
Races - Other race alone (% change since 2000)
Racial diversity
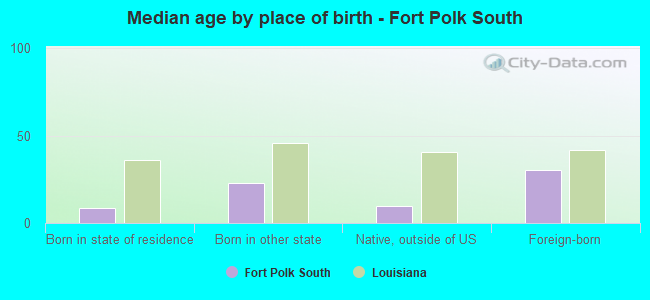
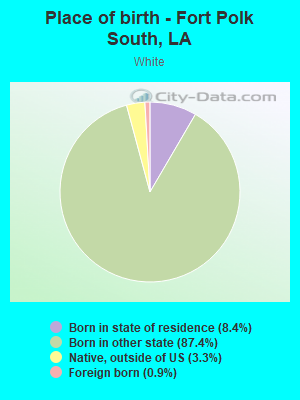
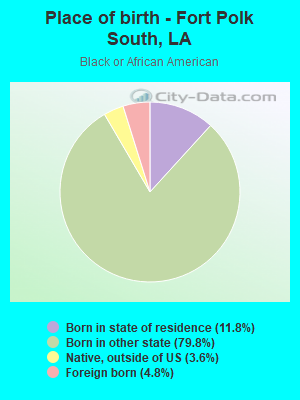
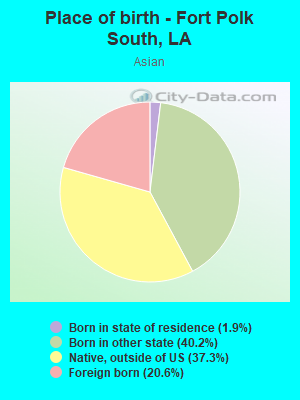
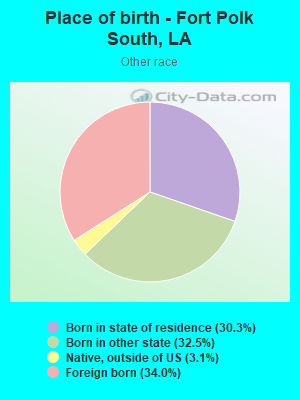
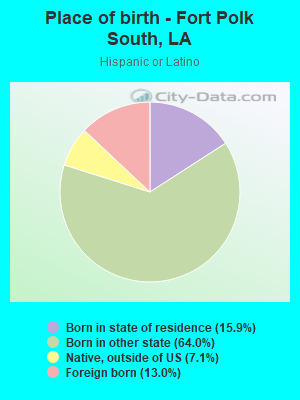
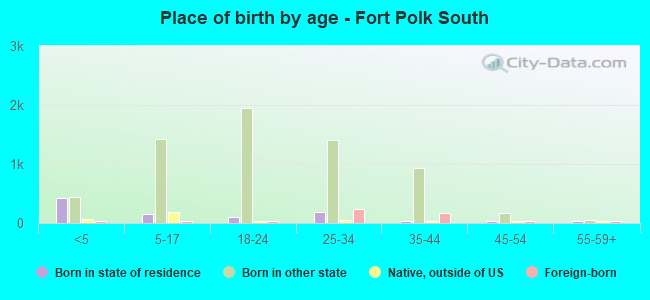
Place of birth - Born in state of residence (%)
Place of birth - Born in state of residence (%) - White
Place of birth - Born in state of residence (%) - Black or African American
Place of birth - Born in state of residence (%) - Asian
Place of birth - Born in state of residence (%) - Hispanic or Latino
Place of birth - Born in state of residence (%) - American Indian and Alaska Native
Place of birth - Born in state of residence (%) - Multirace
Place of birth - Born in state of residence (%) - Other Race
Place of birth - Born in other state (%)
Place of birth - Born in other state (%) - White
Place of birth - Born in other state (%) - Black or African American
Place of birth - Born in other state (%) - Asian
Place of birth - Born in other state (%) - Hispanic or Latino
Place of birth - Born in other state (%) - American Indian and Alaska Native
Place of birth - Born in other state (%) - Multirace
Place of birth - Born in other state (%) - Other Race
Place of birth - Native, outside of US (%)
Place of birth - Native, outside of US (%) - White
Place of birth - Native, outside of US (%) - Black or African American
Place of birth - Native, outside of US (%) - Asian
Place of birth - Native, outside of US (%) - Hispanic or Latino
Place of birth - Native, outside of US (%) - American Indian and Alaska Native
Place of birth - Native, outside of US (%) - Multirace
Place of birth - Native, outside of US (%) - Other Race
Place of birth - Foreign born (%)
Place of birth - Foreign born (%) - White
Place of birth - Foreign born (%) - Black or African American
Place of birth - Foreign born (%) - Asian
Place of birth - Foreign born (%) - Hispanic or Latino
Place of birth - Foreign born (%) - American Indian and Alaska Native
Place of birth - Foreign born (%) - Multirace
Place of birth - Foreign born (%) - Other Race
Residents speaking English at home (%)
Residents speaking English at home - Born in the United States (%)
Residents speaking English at home - Native, born elsewhere (%)
Residents speaking English at home - Foreign born (%)
Residents speaking Spanish at home (%)
Residents speaking Spanish at home - Born in the United States (%)
Residents speaking Spanish at home - Native, born elsewhere (%)
Residents speaking Spanish at home - Foreign born (%)
Residents speaking other language at home (%)
Residents speaking other language at home - Born in the United States (%)
Residents speaking other language at home - Native, born elsewhere (%)
Residents speaking other language at home - Foreign born (%)
Marital status - Never married (%)
Marital status - Now married (%)
Marital status - Separated (%)
Marital status - Widowed (%)
Marital status - Divorced (%)
Ancestries Reported - Arab (%)
Ancestries Reported - Czech (%)
Ancestries Reported - Danish (%)
Ancestries Reported - Dutch (%)
Ancestries Reported - English (%)
Ancestries Reported - French (%)
Ancestries Reported - French Canadian (%)
Ancestries Reported - German (%)
Ancestries Reported - Greek (%)
Ancestries Reported - Hungarian (%)
Ancestries Reported - Irish (%)
Ancestries Reported - Italian (%)
Ancestries Reported - Lithuanian (%)
Ancestries Reported - Norwegian (%)
Ancestries Reported - Polish (%)
Ancestries Reported - Portuguese (%)
Ancestries Reported - Russian (%)
Ancestries Reported - Scotch-Irish (%)
Ancestries Reported - Scottish (%)
Ancestries Reported - Slovak (%)
Ancestries Reported - Subsaharan African (%)
Ancestries Reported - Swedish (%)
Ancestries Reported - Swiss (%)
Ancestries Reported - Ukrainian (%)
Ancestries Reported - United States (%)
Ancestries Reported - Welsh (%)
Ancestries Reported - West Indian (%)
Ancestries Reported - Other (%)
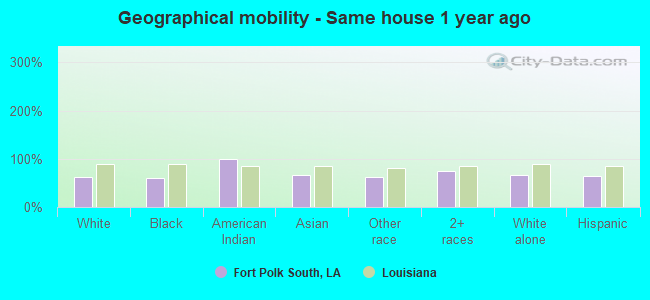
Geographical mobility - Same house 1 year ago (%)
Geographical mobility - Same house 1 year ago (%) - White
Geographical mobility - Same house 1 year ago (%) - Black or African American
Geographical mobility - Same house 1 year ago (%) - Asian
Geographical mobility - Same house 1 year ago (%) - Hispanic or Latino
Geographical mobility - Same house 1 year ago (%) - American Indian and Alaska Native
Geographical mobility - Same house 1 year ago (%) - Multirace
Geographical mobility - Same house 1 year ago (%) - Other Race
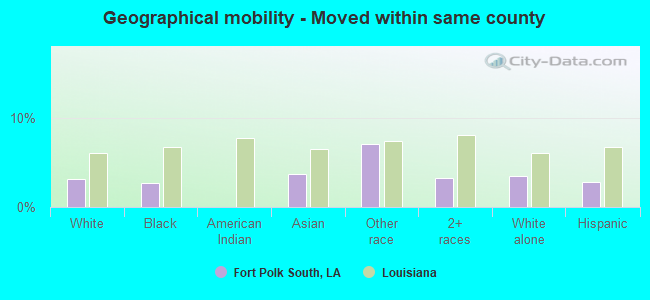
Geographical mobility - Moved within same county (%)
Geographical mobility - Moved within same county (%) - White
Geographical mobility - Moved within same county (%) - Black or African American
Geographical mobility - Moved within same county (%) - Asian
Geographical mobility - Moved within same county (%) - Hispanic or Latino
Geographical mobility - Moved within same county (%) - American Indian and Alaska Native
Geographical mobility - Moved within same county (%) - Multirace
Geographical mobility - Moved within same county (%) - Other Race
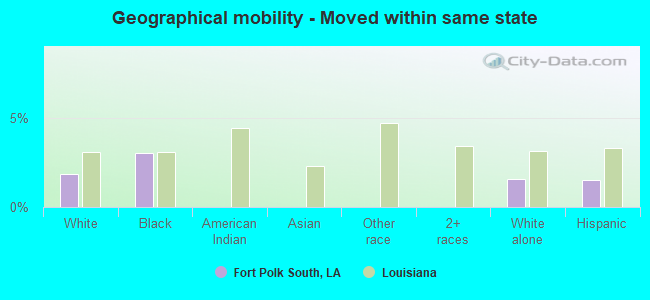
Geographical mobility - Moved from different county within same state (%)
Geographical mobility - Moved from different county within same state (%) - White
Geographical mobility - Moved from different county within same state (%) - Black or African American
Geographical mobility - Moved from different county within same state (%) - Asian
Geographical mobility - Moved from different county within same state (%) - Hispanic or Latino
Geographical mobility - Moved from different county within same state (%) - American Indian and Alaska Native
Geographical mobility - Moved from different county within same state (%) - Multirace
Geographical mobility - Moved from different county within same state (%) - Other Race
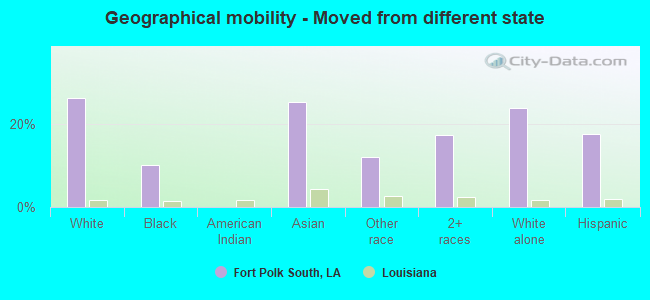
Geographical mobility - Moved from different state (%)
Geographical mobility - Moved from different state (%) - White
Geographical mobility - Moved from different state (%) - Black or African American
Geographical mobility - Moved from different state (%) - Asian
Geographical mobility - Moved from different state (%) - Hispanic or Latino
Geographical mobility - Moved from different state (%) - American Indian and Alaska Native
Geographical mobility - Moved from different state (%) - Multirace
Geographical mobility - Moved from different state (%) - Other Race
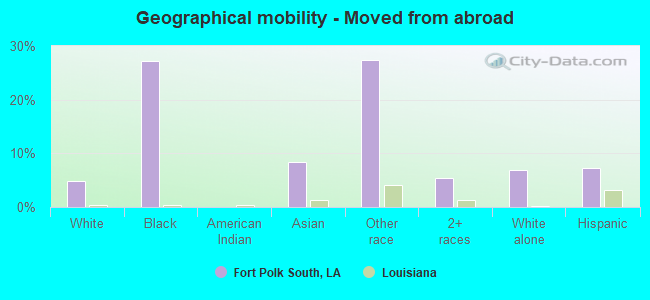
Geographical mobility - Moved from abroad (%)
Geographical mobility - Moved from abroad (%) - White
Geographical mobility - Moved from abroad (%) - Black or African American
Geographical mobility - Moved from abroad (%) - Asian
Geographical mobility - Moved from abroad (%) - Hispanic or Latino
Geographical mobility - Moved from abroad (%) - American Indian and Alaska Native
Geographical mobility - Moved from abroad (%) - Multirace
Geographical mobility - Moved from abroad (%) - Other Race
Place of birth for the foreign-born population - Ireland (%)
Place of birth for the foreign-born population - Denmark (%)
Place of birth for the foreign-born population - Norway (%)
Place of birth for the foreign-born population - Sweden (%)
Place of birth for the foreign-born population - United Kingdom (%)
Place of birth for the foreign-born population - England (%)
Place of birth for the foreign-born population - Scotland (%)
Place of birth for the foreign-born population - Other Northern Europe (%)
Place of birth for the foreign-born population - Austria (%)
Place of birth for the foreign-born population - Belgium (%)
Place of birth for the foreign-born population - France (%)
Place of birth for the foreign-born population - Germany (%)
Place of birth for the foreign-born population - Netherlands (%)
Place of birth for the foreign-born population - Switzerland (%)
Place of birth for the foreign-born population - Other Western Europe (%)
Place of birth for the foreign-born population - Greece (%)
Place of birth for the foreign-born population - Italy (%)
Place of birth for the foreign-born population - Portugal (%)
Place of birth for the foreign-born population - Spain (%)
Place of birth for the foreign-born population - Other Southern Europe (%)
Place of birth for the foreign-born population - Albania (%)
Place of birth for the foreign-born population - Belarus (%)
Place of birth for the foreign-born population - Bosnia and Herzegovina (%)
Place of birth for the foreign-born population - Bulgaria (%)
Place of birth for the foreign-born population - Croatia (%)
Place of birth for the foreign-born population - Czechoslovakia (%)
Place of birth for the foreign-born population - Hungary (%)
Place of birth for the foreign-born population - Latvia (%)
Place of birth for the foreign-born population - Lithuania (%)
Place of birth for the foreign-born population - North Macedonia (Macedonia) (%)
Place of birth for the foreign-born population - Moldova (%)
Place of birth for the foreign-born population - Poland (%)
Place of birth for the foreign-born population - Romania (%)
Place of birth for the foreign-born population - Russia (%)
Place of birth for the foreign-born population - Serbia (%)
Place of birth for the foreign-born population - Ukraine (%)
Place of birth for the foreign-born population - Other Eastern Europe (%)
Place of birth for the foreign-born population - China (%)
Place of birth for the foreign-born population - Hong Kong (%)
Place of birth for the foreign-born population - Taiwan (%)
Place of birth for the foreign-born population - Japan (%)
Place of birth for the foreign-born population - Korea (%)
Place of birth for the foreign-born population - Other Eastern Asia (%)
Place of birth for the foreign-born population - Afghanistan (%)
Place of birth for the foreign-born population - Bangladesh (%)
Place of birth for the foreign-born population - India (%)
Place of birth for the foreign-born population - Iran (%)
Place of birth for the foreign-born population - Kazakhstan (%)
Place of birth for the foreign-born population - Nepal (%)
Place of birth for the foreign-born population - Pakistan (%)
Place of birth for the foreign-born population - Sri Lanka (%)
Place of birth for the foreign-born population - Uzbekistan (%)
Place of birth for the foreign-born population - Other South Central Asia (%)
Place of birth for the foreign-born population - Burma (%)
Place of birth for the foreign-born population - Cambodia (%)
Place of birth for the foreign-born population - Indonesia (%)
Place of birth for the foreign-born population - Laos (%)
Place of birth for the foreign-born population - Malaysia (%)
Place of birth for the foreign-born population - Philippines (%)
Place of birth for the foreign-born population - Singapore (%)
Place of birth for the foreign-born population - Thailand (%)
Place of birth for the foreign-born population - Vietnam (%)
Place of birth for the foreign-born population - Other South Eastern Asia (%)
Place of birth for the foreign-born population - Armenia (%)
Place of birth for the foreign-born population - Iraq (%)
Place of birth for the foreign-born population - Israel (%)
Place of birth for the foreign-born population - Jordan (%)
Place of birth for the foreign-born population - Kuwait (%)
Place of birth for the foreign-born population - Lebanon (%)
Place of birth for the foreign-born population - Saudi Arabia (%)
Place of birth for the foreign-born population - Syria (%)
Place of birth for the foreign-born population - Turkey (%)
Place of birth for the foreign-born population - Yemen (%)
Place of birth for the foreign-born population - Other Western Asia (%)
Place of birth for the foreign-born population - Eritrea (%)
Place of birth for the foreign-born population - Ethiopia (%)
Place of birth for the foreign-born population - Kenya (%)
Place of birth for the foreign-born population - Somalia (%)
Place of birth for the foreign-born population - Uganda (%)
Place of birth for the foreign-born population - Zimbabwe (%)
Place of birth for the foreign-born population - Other Eastern Africa (%)
Place of birth for the foreign-born population - Cameroon (%)
Place of birth for the foreign-born population - Congo (%)
Place of birth for the foreign-born population - Democratic Republic of Congo (Zaire) (%)
Place of birth for the foreign-born population - Other Middle Africa (%)
Place of birth for the foreign-born population - Egypt (%)
Place of birth for the foreign-born population - Morocco (%)
Place of birth for the foreign-born population - Sudan (%)
Place of birth for the foreign-born population - Other Northern Africa (%)
Place of birth for the foreign-born population - South Africa (%)
Place of birth for the foreign-born population - Other Southern Africa (%)
Place of birth for the foreign-born population - Cabo Verde (%)
Place of birth for the foreign-born population - Ghana (%)
Place of birth for the foreign-born population - Liberia (%)
Place of birth for the foreign-born population - Nigeria (%)
Place of birth for the foreign-born population - Senegal (%)
Place of birth for the foreign-born population - Sierra Leone (%)
Place of birth for the foreign-born population - Other Western Africa (%)
Place of birth for the foreign-born population - Australia (%)
Place of birth for the foreign-born population - New Zealand (%)
Place of birth for the foreign-born population - Fiji (%)
Place of birth for the foreign-born population - Micronesia (%)
Place of birth for the foreign-born population - Bahamas (%)
Place of birth for the foreign-born population - Barbados (%)
Place of birth for the foreign-born population - Cuba (%)
Place of birth for the foreign-born population - Dominica (%)
Place of birth for the foreign-born population - Dominican Republic (%)
Place of birth for the foreign-born population - Grenada (%)
Place of birth for the foreign-born population - Haiti (%)
Place of birth for the foreign-born population - Jamaica (%)
Place of birth for the foreign-born population - St. Vincent and the Grenadines (%)
Place of birth for the foreign-born population - Trinidad and Tobago (%)
Place of birth for the foreign-born population - West Indies (%)
Place of birth for the foreign-born population - Other Caribbean (%)
Place of birth for the foreign-born population - Belize (%)
Place of birth for the foreign-born population - Costa Rica (%)
Place of birth for the foreign-born population - El Salvador (%)
Place of birth for the foreign-born population - Guatemala (%)
Place of birth for the foreign-born population - Honduras (%)
Place of birth for the foreign-born population - Mexico (%)
Place of birth for the foreign-born population - Nicaragua (%)
Place of birth for the foreign-born population - Panama (%)
Place of birth for the foreign-born population - Other Central America (%)
Place of birth for the foreign-born population - Argentina (%)
Place of birth for the foreign-born population - Bolivia (%)
Place of birth for the foreign-born population - Brazil (%)
Place of birth for the foreign-born population - Chile (%)
Place of birth for the foreign-born population - Colombia (%)
Place of birth for the foreign-born population - Ecuador (%)
Place of birth for the foreign-born population - Guyana (%)
Place of birth for the foreign-born population - Peru (%)
Place of birth for the foreign-born population - Uruguay (%)
Place of birth for the foreign-born population - Venezuela (%)
Place of birth for the foreign-born population - Other South America (%)
Place of birth for the foreign-born population - Canada (%)
Place of birth for the foreign-born population - Other Northern America (%)
Place of birth for the foreign-born population - Other (%)
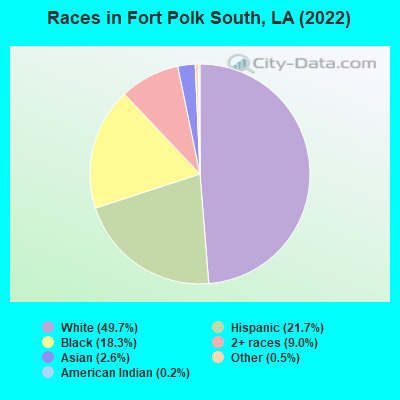
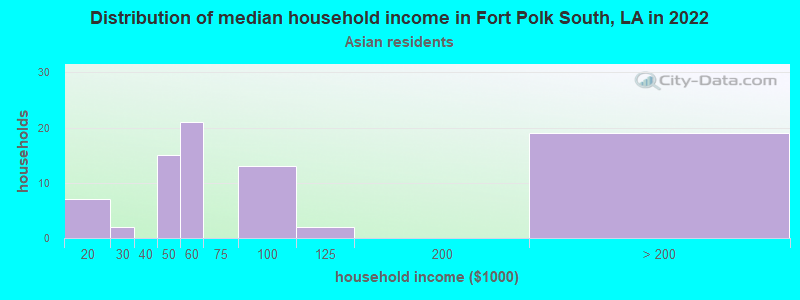
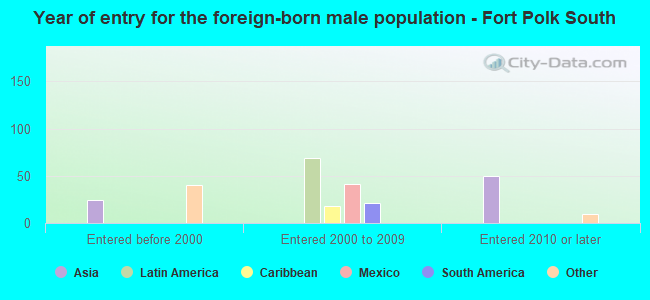
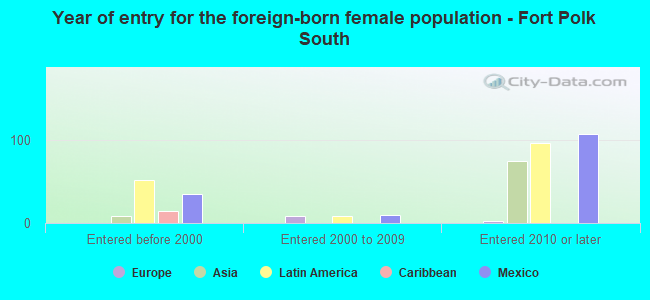
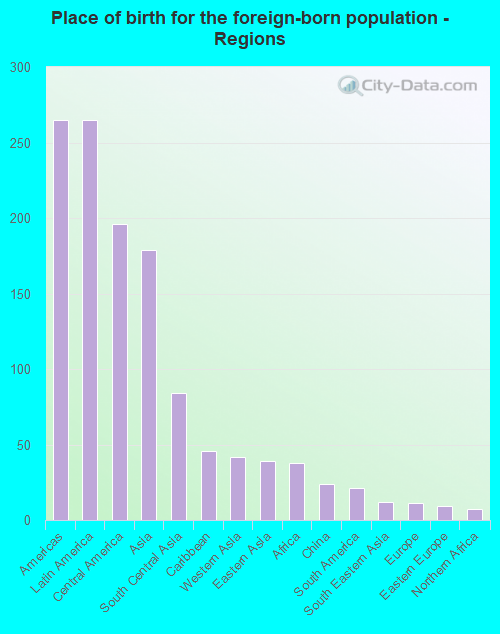
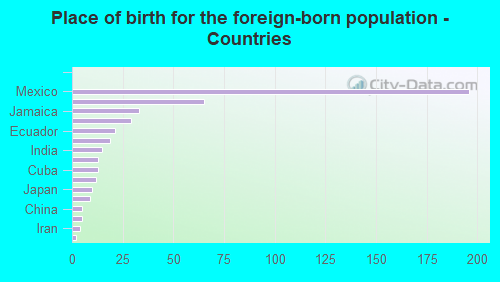
According to 2022 data, the most numerous races in Fort Polk South, LA are White alone (4,097 residents), Black alone (1,511 residents), and Hispanic (1,784 residents). 85.0% of Fort Polk South residents speak English at home. 6.0% of Fort Polk South, LA residents are foreign-born (3.1% born in Latin America, 2.1% born in Asia), which is 33.3% greater than the foreign-born rate of 4.0% across the entire state of Louisiana.
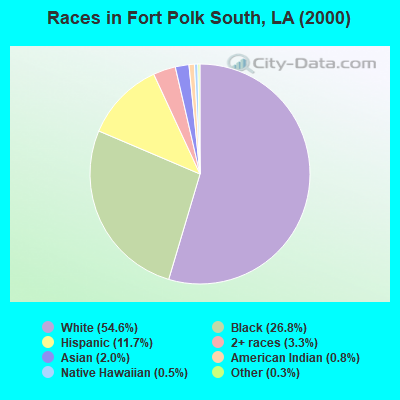
Race distribution in Fort Polk South
2000 2022
2,794,391 62.5% White alone 1,443,390 32.3% Black alone 107,738 2.4% Hispanic 54,256 1.2% Asian alone 39,260 0.9% Two or more races 24,129 0.5% American Indian alone 4,736 0.1% Other race alone 1,076 0.02% Native Hawaiian and Other
2,603,221 56.7% White alone 1,420,055 30.9% Black alone 262,213 5.7% Hispanic 183,270 4.0% Two or more races 81,169 1.8% Asian alone 19,991 0.4% American Indian alone 18,043 0.4% Other race alone 2,279 0.05% Native Hawaiian and Other
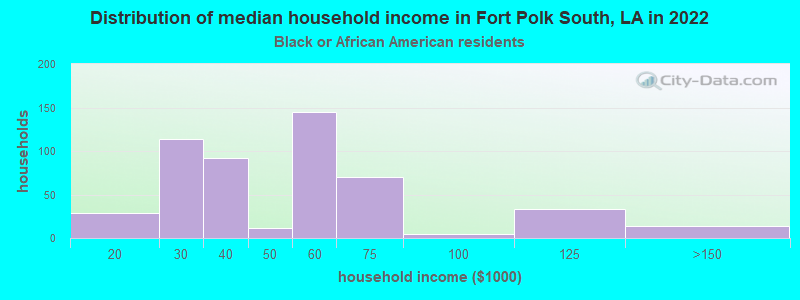
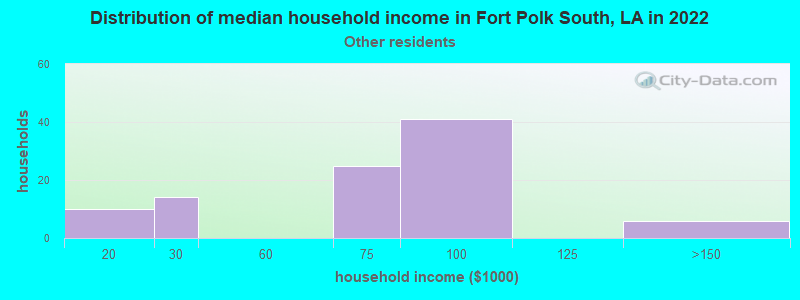
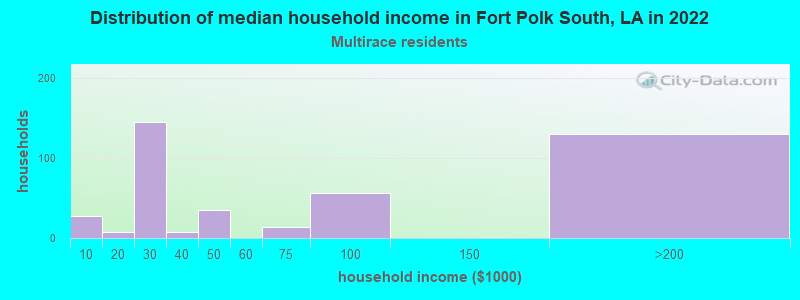
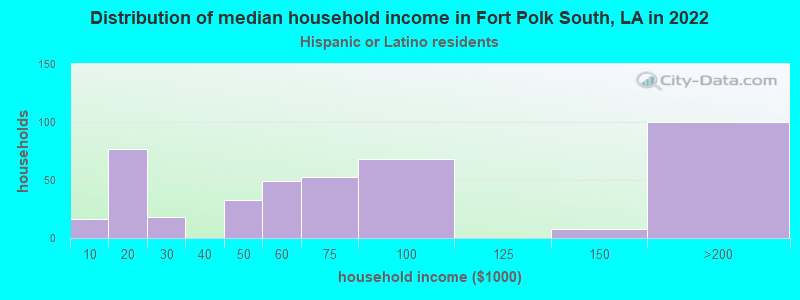
Income and house value in Fort Polk South Median household income in 2022 $61,215 White non-Hispanic householders$49,025 Black householders$94,724 Some other race householders$61,067 Hispanic or Latino race householdersMedian 2022 house value $-2,013,296,221 Black or African American householders$-805,318,488 Hispanic or Latino householders
Median age by race in Fort Polk South
22.6 Median age for White residents23.1 21.2 23.1 Median age for Black or African American residents22.4 25.1 -754,036,086.6 Median age for American Indian / Alaska Native residents-739,906,102.5 -781,341,107.1 36.8 Median age for Asian residents33.6 39.8 -821,138,210.6 Median age for Native Hawaiian / Pacific Islander residents-868,167,201.7 -599,999,999.4 27.0 Median age for Other race residents19.0 32.4 23.1 Median age for Two or more races residents23.5 19.3 22.9 Median age for White alone residents23.8 21.4 19.7 Median age for Hispanic or Latino residents18.7 25.0
Owner/renter occupied households by race in Fort Polk South
House owners and renters - White residents 1,277 100.0% Renter occupiedHouse owners and renters - Black or African American residents 490 100.0% Renter occupiedHouse owners and renters - American Indian / Alaska Native residents 18 100.0% Renter occupiedHouse owners and renters - Asian residents 64 100.0% Renter occupiedHouse owners and renters - Other race residents 111 100.0% Renter occupiedHouse owners and renters - Two or more races residents 380 100.0% Renter occupiedHouse owners and renters - White alone residents 1,178 100.0% Renter occupiedHouse owners and renters - Hispanic or Latino residents 362 100.0% Renter occupied
Language usage in Fort Polk South
English speakers - Total 85.0% of residents of Fort Polk South speak English at home.
10.1% of residents speak Spanish at home 510 70.0% Speak English very well219 30.0% Speak English less than very well4.9% of residents speak other language at home 282 79.2% Speak English very well74 20.8% Speak English less than very well
English speakers - Born in the United States 93.7% of residents of Fort Polk South speak English at home.
5.3% of residents speak Spanish at home 261 81.8% Speak English very well58 18.2% Speak English less than very well0.9% of residents speak other language at home 52 100.0% Speak English very well
English speakers - Native, born elsewhere 49.7% of residents of Fort Polk South speak English at home.
25.2% of residents speak Spanish at home 64 82.1% Speak English very well14 17.9% Speak English less than very well25.2% of residents speak other language at home 57 73.1% Speak English very well21 26.9% Speak English less than very well
English speakers - Foreign-born 6.9% of residents of Fort Polk South speak English at home.
46.5% of residents speak Spanish at home 85 38.5% Speak English very well136 61.5% Speak English less than very well47.4% of residents speak other language at home 162 72.0% Speak English very well63 28.0% Speak English less than very well
White (Caucasian) - Speak only English Native:
97.0% (4,102)Foreign-born:
7.5% (3)
White (Caucasian) - Speak another language Native:
3.1% (130)Foreign-born:
84.2% (37)
Black or African American - Speak only English Native:
97.1% (1,276)Foreign-born:
44.7% (33)
Black or African American - Speak another language Native:
3.1% (41)Foreign-born:
55.1% (41)
Asian - Speak another language Native:
56.1% (102)Foreign-born:
100.0% (55)
Other race - Speak another language Native:
63.9% (200)Foreign-born:
100.0% (192)
Two or more races - Speak another language Native:
25.6% (217)Foreign-born:
100.0% (172)
White alone - Speak only English Native:
99.5% (3,529)Foreign-born:
11.5% (4)
White alone - Speak another language Native:
0.6% (21)Foreign-born:
88.3% (28)
Hispanic or Latino - Speak another language Native:
32.4% (463)Foreign-born:
99.9% (221)
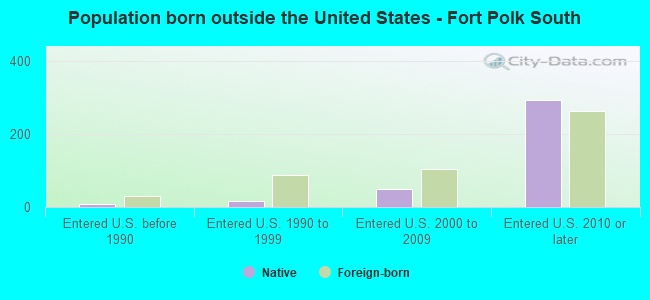
Foreign-born residents in Fort Polk South 494 residents are foreign born (3.1% Latin America , 2.1% Asia ).
This city:
6.0%Louisiana:
4.2%
Marital status for residents in Fort Polk South Marital status - White (Caucasian) population 15 years and over
Males 45.6% Never married46.7% Now married4.4% Separated0.0% Widowed3.3% DivorcedFemales 15.5% Never married82.9% Now married1.6% Separated0.0% Widowed0.0% DivorcedWomen who gave birth in the past 12 months Now married:
100.0% (116)Unmarried:
0.0% (0)
Women who did not give birth in the past 12 months Now married:
82.7% (875)Unmarried:
17.3% (184)
Marital status - Black or African American population 15 years and over
Males 46.2% Never married52.5% Now married0.0% Separated0.0% Widowed1.3% DivorcedFemales 24.5% Never married54.0% Now married10.0% Separated0.0% Widowed11.5% DivorcedWomen who gave birth in the past 12 months Now married:
100.0% (36)Unmarried:
0.0% (0)
Women who did not give birth in the past 12 months Now married:
64.7% (172)Unmarried:
35.3% (94)
Marital status - Asian population 15 years and over
Males 13.5% Never married86.5% Now married0.0% Separated0.0% Widowed0.0% DivorcedFemales 7.6% Never married92.4% Now married0.0% Separated0.0% Widowed0.0% DivorcedWomen who gave birth in the past 12 months Now married:
100.0% (18)Unmarried:
0.0% (0)
Women who did not give birth in the past 12 months Now married:
89.8% (46)Unmarried:
10.2% (5)
Marital status - Other race population 15 years and over
Males 34.7% Never married65.3% Now married0.0% Separated0.0% Widowed0.0% DivorcedFemales 5.7% Never married94.3% Now married0.0% Separated0.0% Widowed0.0% DivorcedWomen who did not give birth in the past 12 months Now married:
94.3% (160)Unmarried:
5.7% (10)
Marital status - Two or more races population 15 years and over
Males 37.4% Never married62.6% Now married0.0% Separated0.0% Widowed0.0% DivorcedFemales 26.4% Never married69.2% Now married0.0% Separated0.0% Widowed4.3% DivorcedWomen who gave birth in the past 12 months Now married:
100.0% (57)Unmarried:
0.0% (0)
Women who did not give birth in the past 12 months Now married:
60.0% (134)Unmarried:
40.0% (89)
Marital status - White alone, not Hispanic / Latino population 15 years and over
Males 45.5% Never married45.9% Now married5.0% Separated0.0% Widowed3.7% DivorcedFemales 15.8% Never married82.2% Now married2.0% Separated0.0% Widowed0.0% DivorcedWomen who gave birth in the past 12 months Now married:
100.0% (110)Unmarried:
0.0% (0)
Women who did not give birth in the past 12 months Now married:
82.0% (705)Unmarried:
18.0% (155)
Marital status - Hispanic or Latino population 15 years and over
Males 43.9% Never married56.1% Now married0.0% Separated0.0% Widowed0.0% DivorcedFemales 7.6% Never married92.4% Now married0.0% Separated0.0% Widowed0.0% DivorcedWomen who gave birth in the past 12 months Now married:
100.0% (24)Unmarried:
0.0% (0)
Women who did not give birth in the past 12 months Now married:
92.0% (385)Unmarried:
8.0% (34)
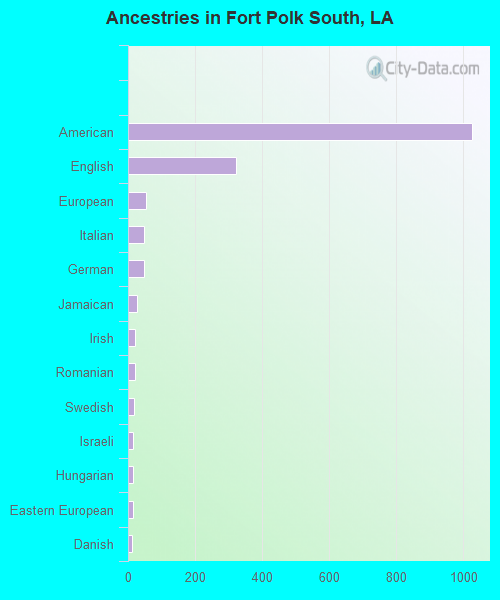
Ancestries in Fort Polk South
1,025 19.2% American323 6.1% English53 1.0% European49 0.9% Italian47 0.9% German26 0.5% Jamaican22 0.4% Irish20 0.4% Romanian18 0.3% Swedish16 0.3% Israeli15 0.3% Hungarian14 0.3% Eastern European12 0.2% Danish9 0.2% French8 0.2% African7 0.1% British6 0.1% Scandinavian3 0.06% French Canadian
Children Nativity (place of birth) in Fort Polk South
Children under 6 years - Living with two parents Both parents native 878 100.0% NativeBoth parents foreign-born 60 100.0% NativeOne native, one foreign-born parent 106 100.0% NativeChildren under 6 years - Living with one parent Native parent 37 100.0% Native
Children 6 to 17 years - Living with two parents Both parents native 1,079 100.0% NativeBoth parents foreign-born 7 100.0% Foreign-bornOne native, one foreign-born parent 399 100.0% NativeChildren 6 to 17 years - Living with one parent Native parent 57 100.0% Native
Grandparents responsible for own grandchildren in Fort Polk South
Grandparents (30 to 59 years) Two or more races 9 100.0% Not responsible for grandchildren
Grandparents (60 years and over) Two or more races 17 100.0% Not responsible for grandchildren