Races in Fort Riley, Kansas (KS) Detailed Stats
Data:
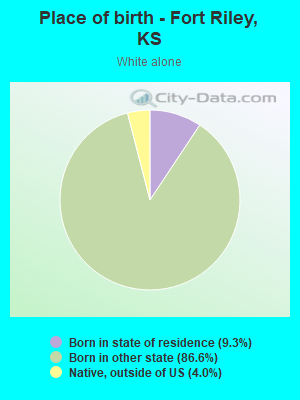
Races - White alone (%)
Races - White alone (% change since 2000)
Races - Black alone (%)
Races - Black alone (% change since 2000)
Races - American Indian alone (%)
Races - American Indian alone (% change since 2000)
Races - Asian alone (%)
Races - Asian alone (% change since 2000)
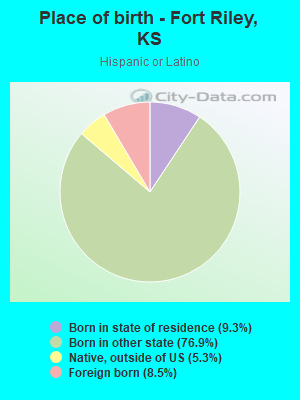
Races - Hispanic (%)
Races - Hispanic (% change since 2000)
Races - Native Hawaiian and Other Pacific Islander alone (%)
Races - Native Hawaiian and Other Pacific Islander alone (% change since 2000)
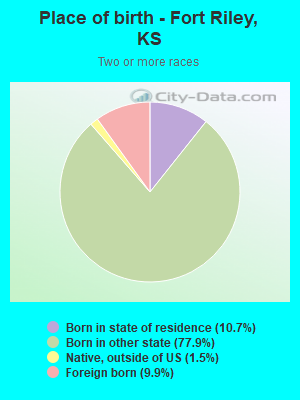
Races - Two or more races(%)
Races - Two or more races(% change since 2000)
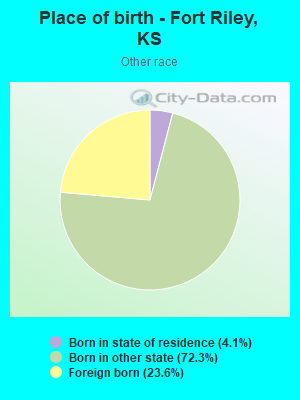
Races - Other race alone (%)
Races - Other race alone (% change since 2000)
Racial diversity
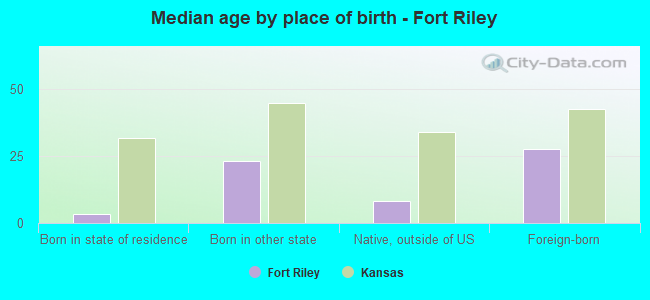
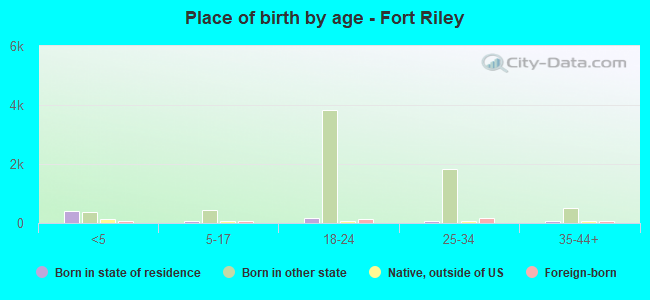
Place of birth - Born in state of residence (%)
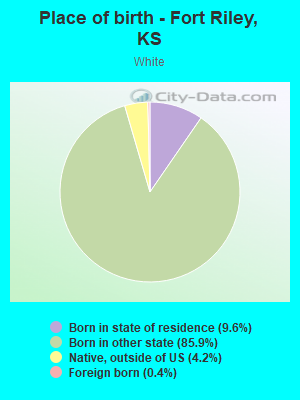
Place of birth - Born in state of residence (%) - White
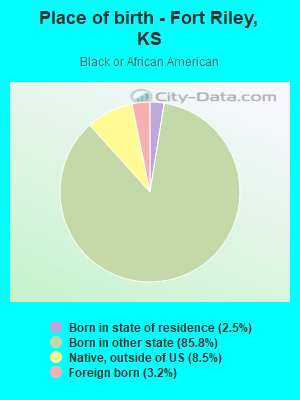
Place of birth - Born in state of residence (%) - Black or African American
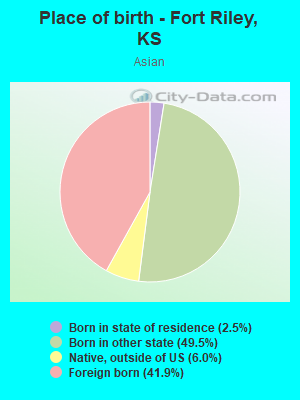
Place of birth - Born in state of residence (%) - Asian
Place of birth - Born in state of residence (%) - Hispanic or Latino
Place of birth - Born in state of residence (%) - American Indian and Alaska Native
Place of birth - Born in state of residence (%) - Multirace
Place of birth - Born in state of residence (%) - Other Race
Place of birth - Born in other state (%)
Place of birth - Born in other state (%) - White
Place of birth - Born in other state (%) - Black or African American
Place of birth - Born in other state (%) - Asian
Place of birth - Born in other state (%) - Hispanic or Latino
Place of birth - Born in other state (%) - American Indian and Alaska Native
Place of birth - Born in other state (%) - Multirace
Place of birth - Born in other state (%) - Other Race
Place of birth - Native, outside of US (%)
Place of birth - Native, outside of US (%) - White
Place of birth - Native, outside of US (%) - Black or African American
Place of birth - Native, outside of US (%) - Asian
Place of birth - Native, outside of US (%) - Hispanic or Latino
Place of birth - Native, outside of US (%) - American Indian and Alaska Native
Place of birth - Native, outside of US (%) - Multirace
Place of birth - Native, outside of US (%) - Other Race
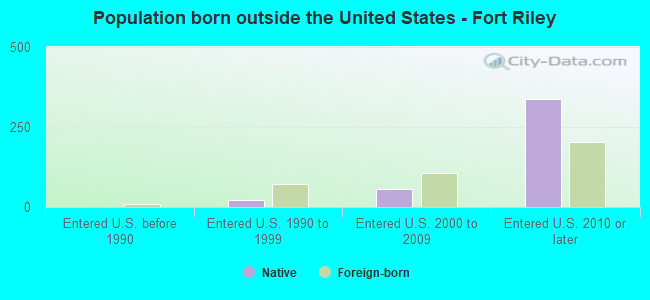
Place of birth - Foreign born (%)
Place of birth - Foreign born (%) - White
Place of birth - Foreign born (%) - Black or African American
Place of birth - Foreign born (%) - Asian
Place of birth - Foreign born (%) - Hispanic or Latino
Place of birth - Foreign born (%) - American Indian and Alaska Native
Place of birth - Foreign born (%) - Multirace
Place of birth - Foreign born (%) - Other Race
Residents speaking English at home (%)
Residents speaking English at home - Born in the United States (%)
Residents speaking English at home - Native, born elsewhere (%)
Residents speaking English at home - Foreign born (%)
Residents speaking Spanish at home (%)
Residents speaking Spanish at home - Born in the United States (%)
Residents speaking Spanish at home - Native, born elsewhere (%)
Residents speaking Spanish at home - Foreign born (%)
Residents speaking other language at home (%)
Residents speaking other language at home - Born in the United States (%)
Residents speaking other language at home - Native, born elsewhere (%)
Residents speaking other language at home - Foreign born (%)
Marital status - Never married (%)
Marital status - Now married (%)
Marital status - Separated (%)
Marital status - Widowed (%)
Marital status - Divorced (%)
Ancestries Reported - Arab (%)
Ancestries Reported - Czech (%)
Ancestries Reported - Danish (%)
Ancestries Reported - Dutch (%)
Ancestries Reported - English (%)
Ancestries Reported - French (%)
Ancestries Reported - French Canadian (%)
Ancestries Reported - German (%)
Ancestries Reported - Greek (%)
Ancestries Reported - Hungarian (%)
Ancestries Reported - Irish (%)
Ancestries Reported - Italian (%)
Ancestries Reported - Lithuanian (%)
Ancestries Reported - Norwegian (%)
Ancestries Reported - Polish (%)
Ancestries Reported - Portuguese (%)
Ancestries Reported - Russian (%)
Ancestries Reported - Scotch-Irish (%)
Ancestries Reported - Scottish (%)
Ancestries Reported - Slovak (%)
Ancestries Reported - Subsaharan African (%)
Ancestries Reported - Swedish (%)
Ancestries Reported - Swiss (%)
Ancestries Reported - Ukrainian (%)
Ancestries Reported - United States (%)
Ancestries Reported - Welsh (%)
Ancestries Reported - West Indian (%)
Ancestries Reported - Other (%)
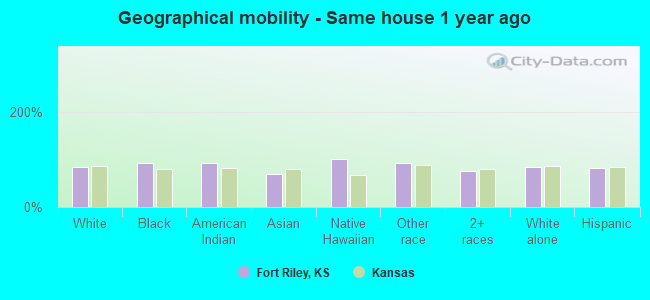
Geographical mobility - Same house 1 year ago (%)
Geographical mobility - Same house 1 year ago (%) - White
Geographical mobility - Same house 1 year ago (%) - Black or African American
Geographical mobility - Same house 1 year ago (%) - Asian
Geographical mobility - Same house 1 year ago (%) - Hispanic or Latino
Geographical mobility - Same house 1 year ago (%) - American Indian and Alaska Native
Geographical mobility - Same house 1 year ago (%) - Multirace
Geographical mobility - Same house 1 year ago (%) - Other Race
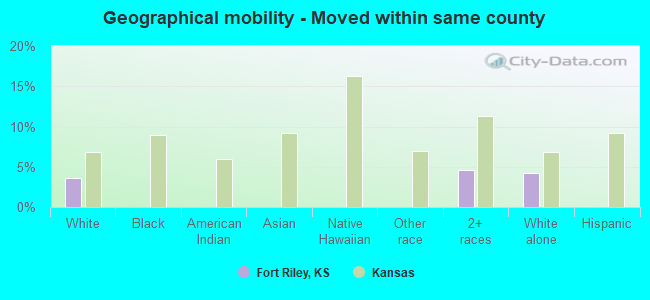
Geographical mobility - Moved within same county (%)
Geographical mobility - Moved within same county (%) - White
Geographical mobility - Moved within same county (%) - Black or African American
Geographical mobility - Moved within same county (%) - Asian
Geographical mobility - Moved within same county (%) - Hispanic or Latino
Geographical mobility - Moved within same county (%) - American Indian and Alaska Native
Geographical mobility - Moved within same county (%) - Multirace
Geographical mobility - Moved within same county (%) - Other Race
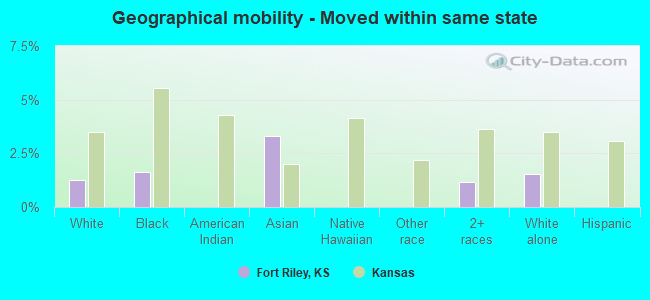
Geographical mobility - Moved from different county within same state (%)
Geographical mobility - Moved from different county within same state (%) - White
Geographical mobility - Moved from different county within same state (%) - Black or African American
Geographical mobility - Moved from different county within same state (%) - Asian
Geographical mobility - Moved from different county within same state (%) - Hispanic or Latino
Geographical mobility - Moved from different county within same state (%) - American Indian and Alaska Native
Geographical mobility - Moved from different county within same state (%) - Multirace
Geographical mobility - Moved from different county within same state (%) - Other Race
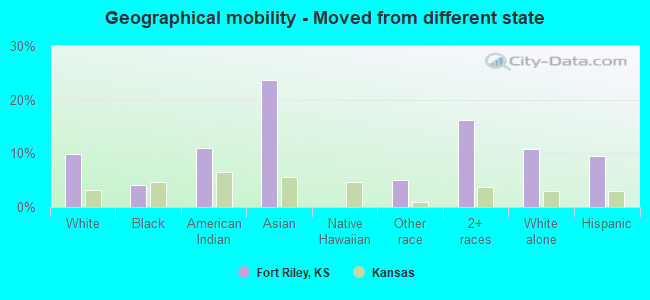
Geographical mobility - Moved from different state (%)
Geographical mobility - Moved from different state (%) - White
Geographical mobility - Moved from different state (%) - Black or African American
Geographical mobility - Moved from different state (%) - Asian
Geographical mobility - Moved from different state (%) - Hispanic or Latino
Geographical mobility - Moved from different state (%) - American Indian and Alaska Native
Geographical mobility - Moved from different state (%) - Multirace
Geographical mobility - Moved from different state (%) - Other Race
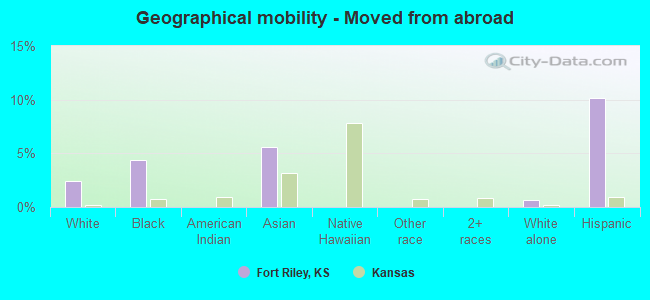
Geographical mobility - Moved from abroad (%)
Geographical mobility - Moved from abroad (%) - White
Geographical mobility - Moved from abroad (%) - Black or African American
Geographical mobility - Moved from abroad (%) - Asian
Geographical mobility - Moved from abroad (%) - Hispanic or Latino
Geographical mobility - Moved from abroad (%) - American Indian and Alaska Native
Geographical mobility - Moved from abroad (%) - Multirace
Geographical mobility - Moved from abroad (%) - Other Race
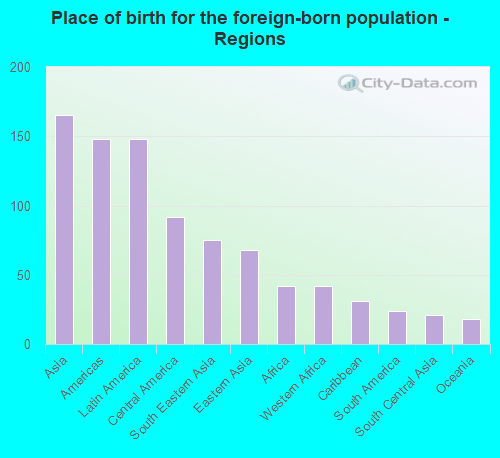
Place of birth for the foreign-born population - Ireland (%)
Place of birth for the foreign-born population - Denmark (%)
Place of birth for the foreign-born population - Norway (%)
Place of birth for the foreign-born population - Sweden (%)
Place of birth for the foreign-born population - United Kingdom (%)
Place of birth for the foreign-born population - England (%)
Place of birth for the foreign-born population - Scotland (%)
Place of birth for the foreign-born population - Other Northern Europe (%)
Place of birth for the foreign-born population - Austria (%)
Place of birth for the foreign-born population - Belgium (%)
Place of birth for the foreign-born population - France (%)
Place of birth for the foreign-born population - Germany (%)
Place of birth for the foreign-born population - Netherlands (%)
Place of birth for the foreign-born population - Switzerland (%)
Place of birth for the foreign-born population - Other Western Europe (%)
Place of birth for the foreign-born population - Greece (%)
Place of birth for the foreign-born population - Italy (%)
Place of birth for the foreign-born population - Portugal (%)
Place of birth for the foreign-born population - Spain (%)
Place of birth for the foreign-born population - Other Southern Europe (%)
Place of birth for the foreign-born population - Albania (%)
Place of birth for the foreign-born population - Belarus (%)
Place of birth for the foreign-born population - Bosnia and Herzegovina (%)
Place of birth for the foreign-born population - Bulgaria (%)
Place of birth for the foreign-born population - Croatia (%)
Place of birth for the foreign-born population - Czechoslovakia (%)
Place of birth for the foreign-born population - Hungary (%)
Place of birth for the foreign-born population - Latvia (%)
Place of birth for the foreign-born population - Lithuania (%)
Place of birth for the foreign-born population - North Macedonia (Macedonia) (%)
Place of birth for the foreign-born population - Moldova (%)
Place of birth for the foreign-born population - Poland (%)
Place of birth for the foreign-born population - Romania (%)
Place of birth for the foreign-born population - Russia (%)
Place of birth for the foreign-born population - Serbia (%)
Place of birth for the foreign-born population - Ukraine (%)
Place of birth for the foreign-born population - Other Eastern Europe (%)
Place of birth for the foreign-born population - China (%)
Place of birth for the foreign-born population - Hong Kong (%)
Place of birth for the foreign-born population - Taiwan (%)
Place of birth for the foreign-born population - Japan (%)
Place of birth for the foreign-born population - Korea (%)
Place of birth for the foreign-born population - Other Eastern Asia (%)
Place of birth for the foreign-born population - Afghanistan (%)
Place of birth for the foreign-born population - Bangladesh (%)
Place of birth for the foreign-born population - India (%)
Place of birth for the foreign-born population - Iran (%)
Place of birth for the foreign-born population - Kazakhstan (%)
Place of birth for the foreign-born population - Nepal (%)
Place of birth for the foreign-born population - Pakistan (%)
Place of birth for the foreign-born population - Sri Lanka (%)
Place of birth for the foreign-born population - Uzbekistan (%)
Place of birth for the foreign-born population - Other South Central Asia (%)
Place of birth for the foreign-born population - Burma (%)
Place of birth for the foreign-born population - Cambodia (%)
Place of birth for the foreign-born population - Indonesia (%)
Place of birth for the foreign-born population - Laos (%)
Place of birth for the foreign-born population - Malaysia (%)
Place of birth for the foreign-born population - Philippines (%)
Place of birth for the foreign-born population - Singapore (%)
Place of birth for the foreign-born population - Thailand (%)
Place of birth for the foreign-born population - Vietnam (%)
Place of birth for the foreign-born population - Other South Eastern Asia (%)
Place of birth for the foreign-born population - Armenia (%)
Place of birth for the foreign-born population - Iraq (%)
Place of birth for the foreign-born population - Israel (%)
Place of birth for the foreign-born population - Jordan (%)
Place of birth for the foreign-born population - Kuwait (%)
Place of birth for the foreign-born population - Lebanon (%)
Place of birth for the foreign-born population - Saudi Arabia (%)
Place of birth for the foreign-born population - Syria (%)
Place of birth for the foreign-born population - Turkey (%)
Place of birth for the foreign-born population - Yemen (%)
Place of birth for the foreign-born population - Other Western Asia (%)
Place of birth for the foreign-born population - Eritrea (%)
Place of birth for the foreign-born population - Ethiopia (%)
Place of birth for the foreign-born population - Kenya (%)
Place of birth for the foreign-born population - Somalia (%)
Place of birth for the foreign-born population - Uganda (%)
Place of birth for the foreign-born population - Zimbabwe (%)
Place of birth for the foreign-born population - Other Eastern Africa (%)
Place of birth for the foreign-born population - Cameroon (%)
Place of birth for the foreign-born population - Congo (%)
Place of birth for the foreign-born population - Democratic Republic of Congo (Zaire) (%)
Place of birth for the foreign-born population - Other Middle Africa (%)
Place of birth for the foreign-born population - Egypt (%)
Place of birth for the foreign-born population - Morocco (%)
Place of birth for the foreign-born population - Sudan (%)
Place of birth for the foreign-born population - Other Northern Africa (%)
Place of birth for the foreign-born population - South Africa (%)
Place of birth for the foreign-born population - Other Southern Africa (%)
Place of birth for the foreign-born population - Cabo Verde (%)
Place of birth for the foreign-born population - Ghana (%)
Place of birth for the foreign-born population - Liberia (%)
Place of birth for the foreign-born population - Nigeria (%)
Place of birth for the foreign-born population - Senegal (%)
Place of birth for the foreign-born population - Sierra Leone (%)
Place of birth for the foreign-born population - Other Western Africa (%)
Place of birth for the foreign-born population - Australia (%)
Place of birth for the foreign-born population - New Zealand (%)
Place of birth for the foreign-born population - Fiji (%)
Place of birth for the foreign-born population - Micronesia (%)
Place of birth for the foreign-born population - Bahamas (%)
Place of birth for the foreign-born population - Barbados (%)
Place of birth for the foreign-born population - Cuba (%)
Place of birth for the foreign-born population - Dominica (%)
Place of birth for the foreign-born population - Dominican Republic (%)
Place of birth for the foreign-born population - Grenada (%)
Place of birth for the foreign-born population - Haiti (%)
Place of birth for the foreign-born population - Jamaica (%)
Place of birth for the foreign-born population - St. Vincent and the Grenadines (%)
Place of birth for the foreign-born population - Trinidad and Tobago (%)
Place of birth for the foreign-born population - West Indies (%)
Place of birth for the foreign-born population - Other Caribbean (%)
Place of birth for the foreign-born population - Belize (%)
Place of birth for the foreign-born population - Costa Rica (%)
Place of birth for the foreign-born population - El Salvador (%)
Place of birth for the foreign-born population - Guatemala (%)
Place of birth for the foreign-born population - Honduras (%)
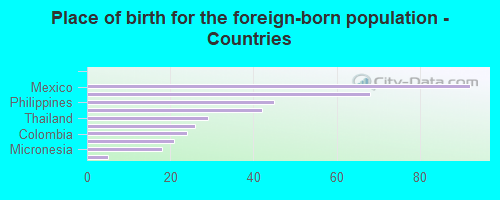
Place of birth for the foreign-born population - Mexico (%)
Place of birth for the foreign-born population - Nicaragua (%)
Place of birth for the foreign-born population - Panama (%)
Place of birth for the foreign-born population - Other Central America (%)
Place of birth for the foreign-born population - Argentina (%)
Place of birth for the foreign-born population - Bolivia (%)
Place of birth for the foreign-born population - Brazil (%)
Place of birth for the foreign-born population - Chile (%)
Place of birth for the foreign-born population - Colombia (%)
Place of birth for the foreign-born population - Ecuador (%)
Place of birth for the foreign-born population - Guyana (%)
Place of birth for the foreign-born population - Peru (%)
Place of birth for the foreign-born population - Uruguay (%)
Place of birth for the foreign-born population - Venezuela (%)
Place of birth for the foreign-born population - Other South America (%)
Place of birth for the foreign-born population - Canada (%)
Place of birth for the foreign-born population - Other Northern America (%)
Place of birth for the foreign-born population - Other (%)
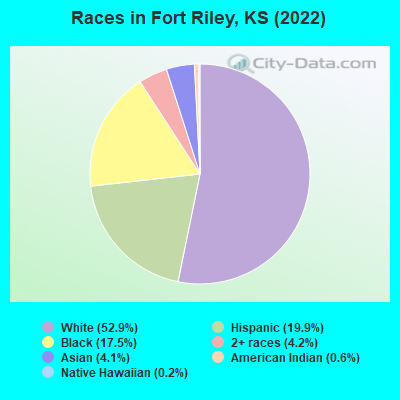
According to 2022 data, the most numerous races in Fort Riley, KS are White alone (4,563 residents), Hispanic (1,715 residents), and Black alone (1,507 residents). 91.3% of Fort Riley residents speak English at home.
Race distribution in Fort Riley 4,563 52.9% White alone 1,715 19.9% Hispanic 1,507 17.5% Black alone 366 4.2% Two or more races 351 4.1% Asian alone 49 0.6% American Indian alone 13 0.2% Native Hawaiian and Other
2000 2022
2,233,997 83.1% White alone 188,252 7.0% Hispanic 151,407 5.6% Black alone 46,301 1.7% Asian alone 42,508 1.6% Two or more races 22,322 0.8% American Indian alone 2,477 0.09% Other race alone 1,154 0.04% Native Hawaiian and Other
2,147,943 73.1% White alone 381,746 13.0% Hispanic 147,666 5.0% Black alone 145,362 4.9% Two or more races 85,085 2.9% Asian alone 13,263 0.5% Other race alone 12,065 0.4% American Indian alone 4,020 0.1% Native Hawaiian and Other
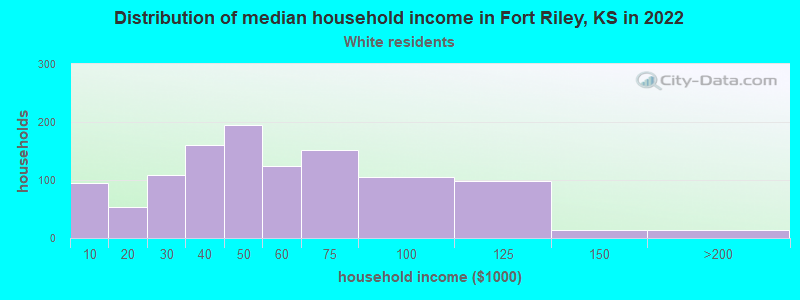
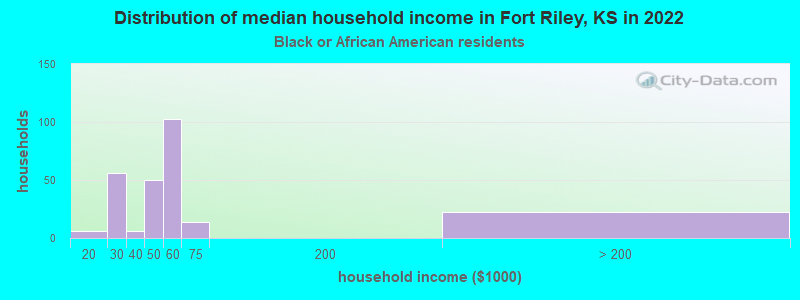
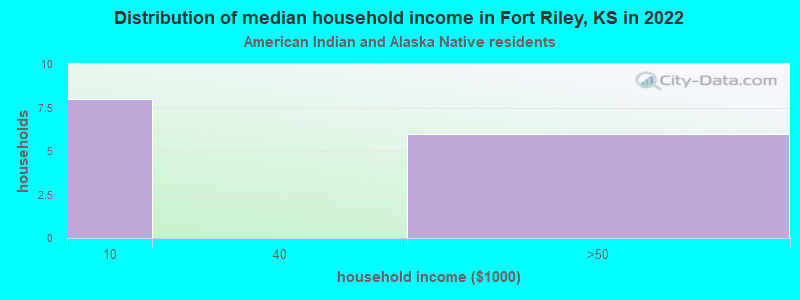
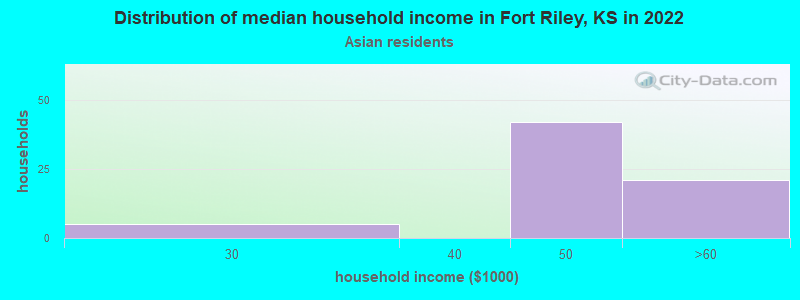
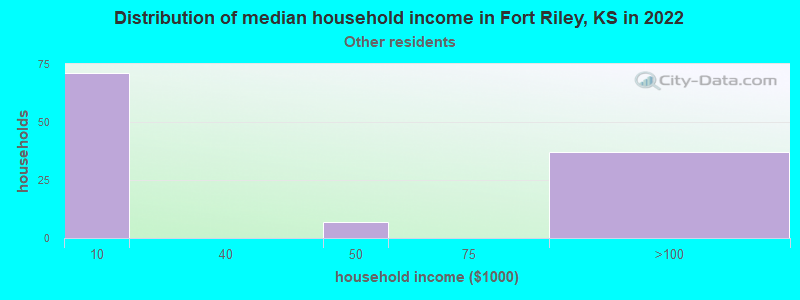
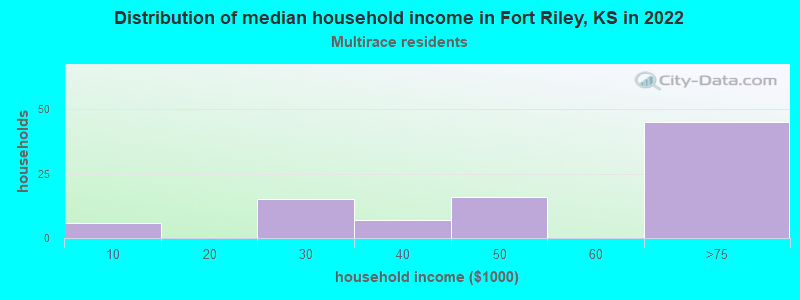
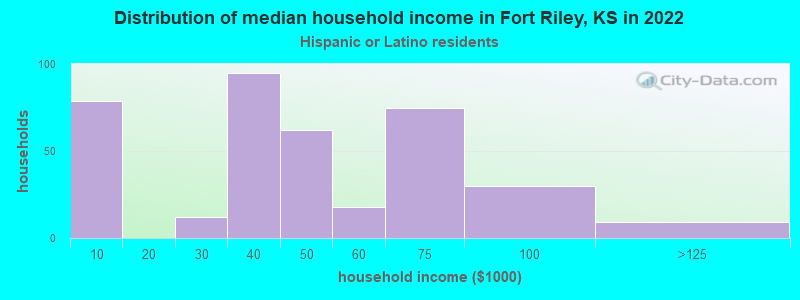
Income and house value in Fort Riley Median household income in 2022 $47,793 White non-Hispanic householders$51,756 Black householders$43,582 Asian householders$2,633 Some other race householders$45,447 Two or more races householders$41,876 Hispanic or Latino race householders
Median age by race in Fort Riley
23.1 Median age for White residents23.2 22.5 23.0 Median age for Black or African American residents23.2 21.8 23.0 Median age for American Indian / Alaska Native residents-781,078,107.0 -654,797,229.8 25.4 Median age for Asian residents25.9 29.7 -627,039,626.4 Median age for Native Hawaiian / Pacific Islander residents-669,240,668.6 -641,269,840.6 29.4 Median age for Other race residents37.6 25.7 22.8 Median age for Two or more races residents22.6 23.5 23.0 Median age for White alone residents23.1 23.0 23.6 Median age for Hispanic or Latino residents22.7 24.1
Owner/renter occupied households by race in Fort Riley
House owners and renters - White residents 26 2.4% Owner occupied1,068 97.6% Renter occupiedHouse owners and renters - Black or African American residents 5 1.9% Owner occupied255 98.1% Renter occupiedHouse owners and renters - American Indian / Alaska Native residents 13 100.0% Renter occupiedHouse owners and renters - Asian residents 57 100.0% Renter occupiedHouse owners and renters - Other race residents 129 100.0% Renter occupiedHouse owners and renters - Two or more races residents 79 100.0% Renter occupiedHouse owners and renters - White alone residents 26 2.8% Owner occupied911 97.2% Renter occupiedHouse owners and renters - Hispanic or Latino residents 371 100.0% Renter occupied
Language usage in Fort Riley
English speakers - Total 91.3% of residents of Fort Riley speak English at home.
6.7% of residents speak Spanish at home 421 81.3% Speak English very well97 18.7% Speak English less than very well2.0% of residents speak other language at home 148 94.3% Speak English very well9 5.7% Speak English less than very well
English speakers - Born in the United States 95.4% of residents of Fort Riley speak English at home.
4.2% of residents speak Spanish at home 274 96.5% Speak English very well10 3.5% Speak English less than very well0.4% of residents speak other language at home 28 100.0% Speak English very well
English speakers - Native, born elsewhere 55.8% of residents of Fort Riley speak English at home.
34.2% of residents speak Spanish at home 8 10.1% Speak English very well71 89.9% Speak English less than very well11.7% of residents speak other language at home 27 100.0% Speak English very well
English speakers - Foreign-born 34.0% of residents of Fort Riley speak English at home.
39.9% of residents speak Spanish at home 125 85.0% Speak English very well22 15.0% Speak English less than very well28.0% of residents speak other language at home 94 91.3% Speak English very well9 8.7% Speak English less than very well
White (Caucasian) - Speak another language Native:
2.9% (135)Foreign-born:
87.5% (18)
Black or African American - Speak only English Native:
97.2% (1,333)Foreign-born:
100.0% (50)
Asian - Speak only English Native:
96.3% (199)Foreign-born:
32.3% (48)
Asian - Speak another language Native:
12.2% (25)Foreign-born:
66.9% (99)
Other race - Speak another language Native:
64.1% (172)Foreign-born:
96.6% (82)
Two or more races - Speak only English Native:
92.7% (576)Foreign-born:
30.5% (28)
Two or more races - Speak another language Native:
3.7% (23)Foreign-born:
66.2% (62)
Hispanic or Latino - Speak another language Native:
26.7% (339)Foreign-born:
98.4% (143)
Foreign-born residents in Fort Riley
Marital status for residents in Fort Riley Marital status - White (Caucasian) population 15 years and over
Males 69.5% Never married28.2% Now married1.8% Separated0.0% Widowed0.4% DivorcedFemales 22.1% Never married77.1% Now married0.0% Separated0.8% Widowed0.0% DivorcedWomen who gave birth in the past 12 months Now married:
100.0% (220)Unmarried:
0.0% (0)
Women who did not give birth in the past 12 months Now married:
72.2% (645)Unmarried:
27.8% (248)
Marital status - Black or African American population 15 years and over
Males 74.0% Never married26.0% Now married0.0% Separated0.0% Widowed0.0% DivorcedFemales 24.1% Never married75.9% Now married0.0% Separated0.0% Widowed0.0% DivorcedWomen who gave birth in the past 12 months Now married:
100.0% (11)Unmarried:
0.0% (0)
Women who did not give birth in the past 12 months Now married:
75.0% (220)Unmarried:
25.0% (73)
Marital status - American Indian / Alaska Native population 15 years and over
Males 100.0% Never married0.0% Now married0.0% Separated0.0% Widowed0.0% DivorcedFemales 0.0% Never married100.0% Now married0.0% Separated0.0% Widowed0.0% DivorcedWomen who did not give birth in the past 12 months Now married:
100.0% (16)Unmarried:
0.0% (0)
Marital status - Asian population 15 years and over
Males 85.4% Never married14.6% Now married0.0% Separated0.0% Widowed0.0% DivorcedFemales 24.2% Never married75.8% Now married0.0% Separated0.0% Widowed0.0% DivorcedWomen who did not give birth in the past 12 months Now married:
72.9% (62)Unmarried:
27.1% (23)
Marital status - Other race population 15 years and over
Males 32.3% Never married67.7% Now married0.0% Separated0.0% Widowed0.0% DivorcedFemales 0.0% Never married100.0% Now married0.0% Separated0.0% Widowed0.0% DivorcedWomen who gave birth in the past 12 months Now married:
100.0% (240)Unmarried:
0.0% (0)
Women who did not give birth in the past 12 months Now married:
100.0% (64)Unmarried:
0.0% (0)
Marital status - Two or more races population 15 years and over
Males 86.2% Never married13.8% Now married0.0% Separated0.0% Widowed0.0% DivorcedFemales 9.0% Never married74.2% Now married0.0% Separated0.0% Widowed16.8% DivorcedWomen who did not give birth in the past 12 months Now married:
84.6% (152)Unmarried:
15.4% (28)
Marital status - White alone, not Hispanic / Latino population 15 years and over
Males 72.1% Never married25.2% Now married2.2% Separated0.0% Widowed0.5% DivorcedFemales 20.7% Never married78.3% Now married0.0% Separated1.0% Widowed0.0% DivorcedWomen who gave birth in the past 12 months Now married:
100.0% (210)Unmarried:
0.0% (0)
Women who did not give birth in the past 12 months Now married:
73.4% (564)Unmarried:
26.6% (204)
Marital status - Hispanic or Latino population 15 years and over
Males 57.7% Never married42.3% Now married0.0% Separated0.0% Widowed0.0% DivorcedFemales 11.7% Never married84.4% Now married0.0% Separated0.0% Widowed3.8% DivorcedWomen who gave birth in the past 12 months Now married:
100.0% (218)Unmarried:
0.0% (0)
Women who did not give birth in the past 12 months Now married:
78.4% (222)Unmarried:
21.6% (61)
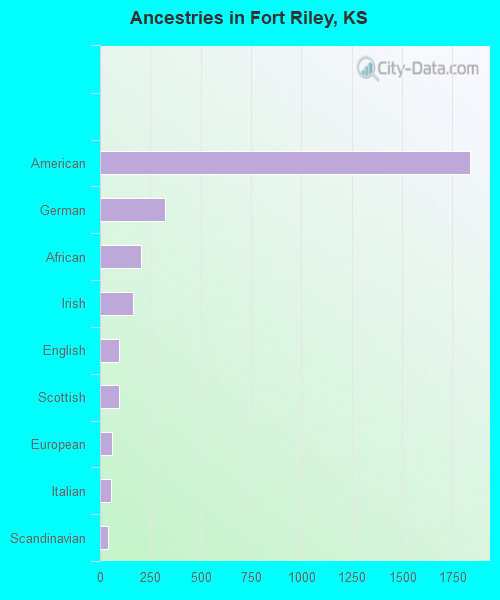
Ancestries in Fort Riley
1,840 31.8% American324 5.6% German204 3.5% African166 2.9% Irish96 1.7% English96 1.7% Scottish61 1.1% European57 1.0% Italian42 0.7% Scandinavian16 0.3% British8 0.1% Jamaican7 0.1% Norwegian6 0.1% Ukrainian5 0.09% Brazilian4 0.07% Polish
Children Nativity (place of birth) in Fort Riley
Children under 6 years - Living with two parents Both parents native 815 100.0% NativeOne native, one foreign-born parent 32 100.0% NativeChildren under 6 years - Living with one parent Native parent 123 100.0% NativeForeign-born parent 39 100.0% NativeChildren 6 to 17 years - Living with two parents Both parents native 437 99.9% Native1 0.1% Foreign-bornOne native, one foreign-born parent 39 92.3% Native3 7.7% Foreign-bornChildren 6 to 17 years - Living with one parent Native parent 5 100.0% NativeForeign-born parent 19 50.2% Native18 49.8% Foreign-born