Races in Framingham, Massachusetts (MA) Detailed Stats
Data:
Races - White alone (%)
Races - White alone (% change since 2000)
Races - Black alone (%)
Races - Black alone (% change since 2000)
Races - American Indian alone (%)
Races - American Indian alone (% change since 2000)
Races - Asian alone (%)
Races - Asian alone (% change since 2000)
Races - Hispanic (%)
Races - Hispanic (% change since 2000)
Races - Native Hawaiian and Other Pacific Islander alone (%)
Races - Native Hawaiian and Other Pacific Islander alone (% change since 2000)
Races - Two or more races(%)
Races - Two or more races(% change since 2000)
Races - Other race alone (%)
Races - Other race alone (% change since 2000)
Racial diversity
Place of birth - Born in state of residence (%)
Place of birth - Born in state of residence (%) - White
Place of birth - Born in state of residence (%) - Black or African American
Place of birth - Born in state of residence (%) - Asian
Place of birth - Born in state of residence (%) - Hispanic or Latino
Place of birth - Born in state of residence (%) - American Indian and Alaska Native
Place of birth - Born in state of residence (%) - Multirace
Place of birth - Born in state of residence (%) - Other Race
Place of birth - Born in other state (%)
Place of birth - Born in other state (%) - White
Place of birth - Born in other state (%) - Black or African American
Place of birth - Born in other state (%) - Asian
Place of birth - Born in other state (%) - Hispanic or Latino
Place of birth - Born in other state (%) - American Indian and Alaska Native
Place of birth - Born in other state (%) - Multirace
Place of birth - Born in other state (%) - Other Race
Place of birth - Native, outside of US (%)
Place of birth - Native, outside of US (%) - White
Place of birth - Native, outside of US (%) - Black or African American
Place of birth - Native, outside of US (%) - Asian
Place of birth - Native, outside of US (%) - Hispanic or Latino
Place of birth - Native, outside of US (%) - American Indian and Alaska Native
Place of birth - Native, outside of US (%) - Multirace
Place of birth - Native, outside of US (%) - Other Race
Place of birth - Foreign born (%)
Place of birth - Foreign born (%) - White
Place of birth - Foreign born (%) - Black or African American
Place of birth - Foreign born (%) - Asian
Place of birth - Foreign born (%) - Hispanic or Latino
Place of birth - Foreign born (%) - American Indian and Alaska Native
Place of birth - Foreign born (%) - Multirace
Place of birth - Foreign born (%) - Other Race
Residents speaking English at home (%)
Residents speaking English at home - Born in the United States (%)
Residents speaking English at home - Native, born elsewhere (%)
Residents speaking English at home - Foreign born (%)
Residents speaking Spanish at home (%)
Residents speaking Spanish at home - Born in the United States (%)
Residents speaking Spanish at home - Native, born elsewhere (%)
Residents speaking Spanish at home - Foreign born (%)
Residents speaking other language at home (%)
Residents speaking other language at home - Born in the United States (%)
Residents speaking other language at home - Native, born elsewhere (%)
Residents speaking other language at home - Foreign born (%)
Marital status - Never married (%)
Marital status - Now married (%)
Marital status - Separated (%)
Marital status - Widowed (%)
Marital status - Divorced (%)
Ancestries Reported - Arab (%)
Ancestries Reported - Czech (%)
Ancestries Reported - Danish (%)
Ancestries Reported - Dutch (%)
Ancestries Reported - English (%)
Ancestries Reported - French (%)
Ancestries Reported - French Canadian (%)
Ancestries Reported - German (%)
Ancestries Reported - Greek (%)
Ancestries Reported - Hungarian (%)
Ancestries Reported - Irish (%)
Ancestries Reported - Italian (%)
Ancestries Reported - Lithuanian (%)
Ancestries Reported - Norwegian (%)
Ancestries Reported - Polish (%)
Ancestries Reported - Portuguese (%)
Ancestries Reported - Russian (%)
Ancestries Reported - Scotch-Irish (%)
Ancestries Reported - Scottish (%)
Ancestries Reported - Slovak (%)
Ancestries Reported - Subsaharan African (%)
Ancestries Reported - Swedish (%)
Ancestries Reported - Swiss (%)
Ancestries Reported - Ukrainian (%)
Ancestries Reported - United States (%)
Ancestries Reported - Welsh (%)
Ancestries Reported - West Indian (%)
Ancestries Reported - Other (%)
Geographical mobility - Same house 1 year ago (%)
Geographical mobility - Same house 1 year ago (%) - White
Geographical mobility - Same house 1 year ago (%) - Black or African American
Geographical mobility - Same house 1 year ago (%) - Asian
Geographical mobility - Same house 1 year ago (%) - Hispanic or Latino
Geographical mobility - Same house 1 year ago (%) - American Indian and Alaska Native
Geographical mobility - Same house 1 year ago (%) - Multirace
Geographical mobility - Same house 1 year ago (%) - Other Race
Geographical mobility - Moved within same county (%)
Geographical mobility - Moved within same county (%) - White
Geographical mobility - Moved within same county (%) - Black or African American
Geographical mobility - Moved within same county (%) - Asian
Geographical mobility - Moved within same county (%) - Hispanic or Latino
Geographical mobility - Moved within same county (%) - American Indian and Alaska Native
Geographical mobility - Moved within same county (%) - Multirace
Geographical mobility - Moved within same county (%) - Other Race
Geographical mobility - Moved from different county within same state (%)
Geographical mobility - Moved from different county within same state (%) - White
Geographical mobility - Moved from different county within same state (%) - Black or African American
Geographical mobility - Moved from different county within same state (%) - Asian
Geographical mobility - Moved from different county within same state (%) - Hispanic or Latino
Geographical mobility - Moved from different county within same state (%) - American Indian and Alaska Native
Geographical mobility - Moved from different county within same state (%) - Multirace
Geographical mobility - Moved from different county within same state (%) - Other Race
Geographical mobility - Moved from different state (%)
Geographical mobility - Moved from different state (%) - White
Geographical mobility - Moved from different state (%) - Black or African American
Geographical mobility - Moved from different state (%) - Asian
Geographical mobility - Moved from different state (%) - Hispanic or Latino
Geographical mobility - Moved from different state (%) - American Indian and Alaska Native
Geographical mobility - Moved from different state (%) - Multirace
Geographical mobility - Moved from different state (%) - Other Race
Geographical mobility - Moved from abroad (%)
Geographical mobility - Moved from abroad (%) - White
Geographical mobility - Moved from abroad (%) - Black or African American
Geographical mobility - Moved from abroad (%) - Asian
Geographical mobility - Moved from abroad (%) - Hispanic or Latino
Geographical mobility - Moved from abroad (%) - American Indian and Alaska Native
Geographical mobility - Moved from abroad (%) - Multirace
Geographical mobility - Moved from abroad (%) - Other Race
Place of birth for the foreign-born population - Ireland (%)
Place of birth for the foreign-born population - Denmark (%)
Place of birth for the foreign-born population - Norway (%)
Place of birth for the foreign-born population - Sweden (%)
Place of birth for the foreign-born population - United Kingdom (%)
Place of birth for the foreign-born population - England (%)
Place of birth for the foreign-born population - Scotland (%)
Place of birth for the foreign-born population - Other Northern Europe (%)
Place of birth for the foreign-born population - Austria (%)
Place of birth for the foreign-born population - Belgium (%)
Place of birth for the foreign-born population - France (%)
Place of birth for the foreign-born population - Germany (%)
Place of birth for the foreign-born population - Netherlands (%)
Place of birth for the foreign-born population - Switzerland (%)
Place of birth for the foreign-born population - Other Western Europe (%)
Place of birth for the foreign-born population - Greece (%)
Place of birth for the foreign-born population - Italy (%)
Place of birth for the foreign-born population - Portugal (%)
Place of birth for the foreign-born population - Spain (%)
Place of birth for the foreign-born population - Other Southern Europe (%)
Place of birth for the foreign-born population - Albania (%)
Place of birth for the foreign-born population - Belarus (%)
Place of birth for the foreign-born population - Bosnia and Herzegovina (%)
Place of birth for the foreign-born population - Bulgaria (%)
Place of birth for the foreign-born population - Croatia (%)
Place of birth for the foreign-born population - Czechoslovakia (%)
Place of birth for the foreign-born population - Hungary (%)
Place of birth for the foreign-born population - Latvia (%)
Place of birth for the foreign-born population - Lithuania (%)
Place of birth for the foreign-born population - North Macedonia (Macedonia) (%)
Place of birth for the foreign-born population - Moldova (%)
Place of birth for the foreign-born population - Poland (%)
Place of birth for the foreign-born population - Romania (%)
Place of birth for the foreign-born population - Russia (%)
Place of birth for the foreign-born population - Serbia (%)
Place of birth for the foreign-born population - Ukraine (%)
Place of birth for the foreign-born population - Other Eastern Europe (%)
Place of birth for the foreign-born population - China (%)
Place of birth for the foreign-born population - Hong Kong (%)
Place of birth for the foreign-born population - Taiwan (%)
Place of birth for the foreign-born population - Japan (%)
Place of birth for the foreign-born population - Korea (%)
Place of birth for the foreign-born population - Other Eastern Asia (%)
Place of birth for the foreign-born population - Afghanistan (%)
Place of birth for the foreign-born population - Bangladesh (%)
Place of birth for the foreign-born population - India (%)
Place of birth for the foreign-born population - Iran (%)
Place of birth for the foreign-born population - Kazakhstan (%)
Place of birth for the foreign-born population - Nepal (%)
Place of birth for the foreign-born population - Pakistan (%)
Place of birth for the foreign-born population - Sri Lanka (%)
Place of birth for the foreign-born population - Uzbekistan (%)
Place of birth for the foreign-born population - Other South Central Asia (%)
Place of birth for the foreign-born population - Burma (%)
Place of birth for the foreign-born population - Cambodia (%)
Place of birth for the foreign-born population - Indonesia (%)
Place of birth for the foreign-born population - Laos (%)
Place of birth for the foreign-born population - Malaysia (%)
Place of birth for the foreign-born population - Philippines (%)
Place of birth for the foreign-born population - Singapore (%)
Place of birth for the foreign-born population - Thailand (%)
Place of birth for the foreign-born population - Vietnam (%)
Place of birth for the foreign-born population - Other South Eastern Asia (%)
Place of birth for the foreign-born population - Armenia (%)
Place of birth for the foreign-born population - Iraq (%)
Place of birth for the foreign-born population - Israel (%)
Place of birth for the foreign-born population - Jordan (%)
Place of birth for the foreign-born population - Kuwait (%)
Place of birth for the foreign-born population - Lebanon (%)
Place of birth for the foreign-born population - Saudi Arabia (%)
Place of birth for the foreign-born population - Syria (%)
Place of birth for the foreign-born population - Turkey (%)
Place of birth for the foreign-born population - Yemen (%)
Place of birth for the foreign-born population - Other Western Asia (%)
Place of birth for the foreign-born population - Eritrea (%)
Place of birth for the foreign-born population - Ethiopia (%)
Place of birth for the foreign-born population - Kenya (%)
Place of birth for the foreign-born population - Somalia (%)
Place of birth for the foreign-born population - Uganda (%)
Place of birth for the foreign-born population - Zimbabwe (%)
Place of birth for the foreign-born population - Other Eastern Africa (%)
Place of birth for the foreign-born population - Cameroon (%)
Place of birth for the foreign-born population - Congo (%)
Place of birth for the foreign-born population - Democratic Republic of Congo (Zaire) (%)
Place of birth for the foreign-born population - Other Middle Africa (%)
Place of birth for the foreign-born population - Egypt (%)
Place of birth for the foreign-born population - Morocco (%)
Place of birth for the foreign-born population - Sudan (%)
Place of birth for the foreign-born population - Other Northern Africa (%)
Place of birth for the foreign-born population - South Africa (%)
Place of birth for the foreign-born population - Other Southern Africa (%)
Place of birth for the foreign-born population - Cabo Verde (%)
Place of birth for the foreign-born population - Ghana (%)
Place of birth for the foreign-born population - Liberia (%)
Place of birth for the foreign-born population - Nigeria (%)
Place of birth for the foreign-born population - Senegal (%)
Place of birth for the foreign-born population - Sierra Leone (%)
Place of birth for the foreign-born population - Other Western Africa (%)
Place of birth for the foreign-born population - Australia (%)
Place of birth for the foreign-born population - New Zealand (%)
Place of birth for the foreign-born population - Fiji (%)
Place of birth for the foreign-born population - Micronesia (%)
Place of birth for the foreign-born population - Bahamas (%)
Place of birth for the foreign-born population - Barbados (%)
Place of birth for the foreign-born population - Cuba (%)
Place of birth for the foreign-born population - Dominica (%)
Place of birth for the foreign-born population - Dominican Republic (%)
Place of birth for the foreign-born population - Grenada (%)
Place of birth for the foreign-born population - Haiti (%)
Place of birth for the foreign-born population - Jamaica (%)
Place of birth for the foreign-born population - St. Vincent and the Grenadines (%)
Place of birth for the foreign-born population - Trinidad and Tobago (%)
Place of birth for the foreign-born population - West Indies (%)
Place of birth for the foreign-born population - Other Caribbean (%)
Place of birth for the foreign-born population - Belize (%)
Place of birth for the foreign-born population - Costa Rica (%)
Place of birth for the foreign-born population - El Salvador (%)
Place of birth for the foreign-born population - Guatemala (%)
Place of birth for the foreign-born population - Honduras (%)
Place of birth for the foreign-born population - Mexico (%)
Place of birth for the foreign-born population - Nicaragua (%)
Place of birth for the foreign-born population - Panama (%)
Place of birth for the foreign-born population - Other Central America (%)
Place of birth for the foreign-born population - Argentina (%)
Place of birth for the foreign-born population - Bolivia (%)
Place of birth for the foreign-born population - Brazil (%)
Place of birth for the foreign-born population - Chile (%)
Place of birth for the foreign-born population - Colombia (%)
Place of birth for the foreign-born population - Ecuador (%)
Place of birth for the foreign-born population - Guyana (%)
Place of birth for the foreign-born population - Peru (%)
Place of birth for the foreign-born population - Uruguay (%)
Place of birth for the foreign-born population - Venezuela (%)
Place of birth for the foreign-born population - Other South America (%)
Place of birth for the foreign-born population - Canada (%)
Place of birth for the foreign-born population - Other Northern America (%)
Place of birth for the foreign-born population - Other (%)
Latest news about races in Framingham, MA collected exclusively by city-data.com from local newspapers, TV, and radio stations
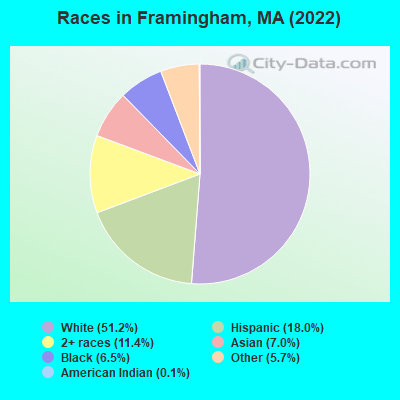
According to 2022 data, the most numerous races in Framingham, MA are White alone (36,341 residents), Hispanic (12,739 residents), and Asian alone (4,965 residents). 57.0% of Framingham residents speak English at home. 31.9% of Framingham, MA residents are foreign-born (19.5% born in Latin America, 6.3% born in Asia), which is 43.7% greater than the foreign-born rate of 18.0% across the entire state of Massachusetts.
Race distribution in Framingham
2000 2022
50,293 75.2% White alone 7,265 10.9% Hispanic 3,515 5.3% Asian alone 2,991 4.5% Black alone 1,611 2.4% Two or more races 1,148 1.7% Other race alone 79 0.1% American Indian alone 8 0.01% Native Hawaiian and Other
36,341 51.2% White alone 12,739 18.0% Hispanic 8,111 11.4% Two or more races 4,965 7.0% Asian alone 4,624 6.5% Black alone 4,074 5.7% Other race alone 93 0.1% American Indian alone
2000 2022
5,198,359 81.9% White alone 428,729 6.8% Hispanic 318,329 5.0% Black alone 236,786 3.7% Asian alone 110,338 1.7% Two or more races 43,586 0.7% Other race alone 11,264 0.2% American Indian alone 1,706 0.03% Native Hawaiian and Other
4,676,627 67.0% White alone 911,038 13.0% Hispanic 501,463 7.2% Asian alone 459,740 6.6% Black alone 341,889 4.9% Two or more races 84,403 1.2% Other race alone 5,838 0.08% American Indian alone 976 0.01% Native Hawaiian and Other
Income and house value in Framingham Median household income in 2022 $102,945 White non-Hispanic householders$80,237 Black householders$116,782 Asian householders$70,630 Some other race householders$72,340 Two or more races householders$59,268 Hispanic or Latino race householdersMedian 2022 house value $619,077 White Non-Hispanic householders$619,934 Black or African American householders $724,829 Asian householders$427,866 Some other race householders$683,957 Two or more races householders$503,321 Hispanic or Latino householders
Median age by race in Framingham
45.8 Median age for White residents49.1 44.9 33.5 Median age for Black or African American residents31.6 52.5 38.1 Median age for American Indian / Alaska Native residents-666,666,666.0 -666,666,666.0 38.7 Median age for Asian residents41.9 37.3 -666,666,666.0 Median age for Native Hawaiian / Pacific Islander residents-666,666,666.0 -666,666,666.0 30.7 Median age for Other race residents30.4 30.9 34.1 Median age for Two or more races residents24.3 35.5 47.6 Median age for White alone residents50.5 45.2 28.6 Median age for Hispanic or Latino residents27.6 30.2
Owner/renter occupied households by race in Framingham
House owners and renters - White residents 11,735 68.0% Owner occupied5,521 32.0% Renter occupiedHouse owners and renters - Black or African American residents 904 60.5% Owner occupied590 39.5% Renter occupiedHouse owners and renters - American Indian / Alaska Native residents 32 100.0% Renter occupiedHouse owners and renters - Asian residents 1,081 51.9% Owner occupied1,002 48.1% Renter occupiedHouse owners and renters - Native Hawaiian / Pacific Islander residents 28 100.0% Owner occupiedHouse owners and renters - Other race residents 728 27.8% Owner occupied1,893 72.2% Renter occupiedHouse owners and renters - Two or more races residents 989 20.0% Owner occupied3,947 80.0% Renter occupiedHouse owners and renters - White alone residents 11,735 68.4% Owner occupied5,424 31.6% Renter occupiedHouse owners and renters - Hispanic or Latino residents 554 14.6% Owner occupied3,248 85.4% Renter occupied
Language usage in Framingham
English speakers - Total 57.0% of residents of Framingham speak English at home.
14.7% of residents speak Spanish at home 5,081 51.9% Speak English very well4,717 48.1% Speak English less than very well28.3% of residents speak other language at home 10,074 53.3% Speak English very well8,814 46.7% Speak English less than very well
English speakers - Born in the United States 92.9% of residents of Framingham speak English at home.
4.5% of residents speak Spanish at home 488 87.9% Speak English very well67 12.1% Speak English less than very well2.6% of residents speak other language at home 159 50.3% Speak English very well157 49.7% Speak English less than very well
English speakers - Native, born elsewhere 20.9% of residents of Framingham speak English at home.
59.4% of residents speak Spanish at home 1,021 63.9% Speak English very well578 36.1% Speak English less than very well19.7% of residents speak other language at home 311 58.7% Speak English very well219 41.3% Speak English less than very well
English speakers - Foreign-born 10.0% of residents of Framingham speak English at home.
24.5% of residents speak Spanish at home 1,650 30.0% Speak English very well3,849 70.0% Speak English less than very well65.4% of residents speak other language at home 6,320 43.0% Speak English very well8,362 57.0% Speak English less than very well
White (Caucasian) - Speak only English Native:
93.2% (30,048)Foreign-born:
20.6% (745)
White (Caucasian) - Speak another language Native:
6.8% (2,189)Foreign-born:
79.4% (2,864)
Black or African American - Speak only English Native:
82.3% (1,811)Foreign-born:
56.1% (1,280)
Black or African American - Speak another language Native:
17.7% (390)Foreign-born:
43.9% (1,001)
American Indian / Alaska Native - Speak only English Native:
25.4% (14)Foreign-born:
76.4% (4)
Asian - Speak only English Native:
60.1% (679)Foreign-born:
4.3% (145)
Asian - Speak another language Native:
39.9% (451)Foreign-born:
95.7% (3,228)
Other race - Speak only English Native:
11.4% (293)Foreign-born:
1.0% (55)
Other race - Speak another language Native:
88.6% (2,271)Foreign-born:
99.0% (5,478)
Two or more races - Speak only English Native:
47.8% (2,864)Foreign-born:
0.4% (27)
Two or more races - Speak another language Native:
52.2% (3,123)Foreign-born:
99.6% (7,610)
White alone - Speak only English Native:
94.4% (30,006)Foreign-born:
18.9% (645)
White alone - Speak another language Native:
5.6% (1,771)Foreign-born:
81.1% (2,767)
Hispanic or Latino - Speak only English Native:
18.3% (966)Foreign-born:
2.7% (155)
Hispanic or Latino - Speak another language Native:
81.7% (4,326)Foreign-born:
97.3% (5,667)
Foreign-born residents in Framingham 22,856 residents are foreign born (19.5% Latin America , 6.3% Asia ).
This city:
31.9%Massachusetts:
17.6%
Marital status for residents in Framingham Marital status - White (Caucasian) population 15 years and over
Males 25.6% Never married61.9% Now married1.3% Separated1.1% Widowed10.0% DivorcedFemales 33.1% Never married49.0% Now married1.8% Separated8.1% Widowed8.1% DivorcedWomen who gave birth in the past 12 months Now married:
100.0% (448)Unmarried:
0.0% (0)
Women who did not give birth in the past 12 months Now married:
37.3% (3,037)Unmarried:
62.7% (5,103)
Marital status - Black or African American population 15 years and over
Males 44.0% Never married47.6% Now married0.7% Separated0.0% Widowed7.7% DivorcedFemales 34.0% Never married51.2% Now married1.5% Separated4.2% Widowed9.1% DivorcedWomen who gave birth in the past 12 months Now married:
55.6% (39)Unmarried:
44.4% (31)
Women who did not give birth in the past 12 months Now married:
47.7% (506)Unmarried:
52.3% (556)
Marital status - American Indian / Alaska Native population 15 years and over
Males 21.2% Never married78.8% Now married0.0% Separated0.0% Widowed0.0% DivorcedFemales 0.0% Never married100.0% Now married0.0% Separated0.0% Widowed0.0% DivorcedWomen who did not give birth in the past 12 months Now married:
100.0% (20)Unmarried:
0.0% (0)
Marital status - Asian population 15 years and over
Males 23.7% Never married69.8% Now married0.7% Separated0.7% Widowed5.1% DivorcedFemales 17.4% Never married71.7% Now married1.5% Separated7.4% Widowed2.0% DivorcedWomen who gave birth in the past 12 months Now married:
100.0% (96)Unmarried:
0.0% (0)
Women who did not give birth in the past 12 months Now married:
61.9% (724)Unmarried:
38.1% (445)
Marital status - Other race population 15 years and over
Males 39.7% Never married48.3% Now married1.7% Separated0.0% Widowed10.3% DivorcedFemales 39.2% Never married45.0% Now married3.2% Separated2.5% Widowed10.1% DivorcedWomen who gave birth in the past 12 months Now married:
50.0% (26)Unmarried:
50.0% (26)
Women who did not give birth in the past 12 months Now married:
48.8% (1,643)Unmarried:
51.2% (1,727)
Marital status - Two or more races population 15 years and over
Males 63.5% Never married32.1% Now married2.8% Separated0.0% Widowed1.7% DivorcedFemales 40.6% Never married36.6% Now married3.6% Separated10.4% Widowed8.6% DivorcedWomen who gave birth in the past 12 months Now married:
24.4% (141)Unmarried:
75.6% (436)
Women who did not give birth in the past 12 months Now married:
38.9% (1,448)Unmarried:
61.1% (2,279)
Marital status - White alone, not Hispanic / Latino population 15 years and over
Males 24.4% Never married62.9% Now married1.4% Separated1.1% Widowed10.2% DivorcedFemales 32.4% Never married49.4% Now married1.8% Separated8.2% Widowed8.1% DivorcedWomen who gave birth in the past 12 months Now married:
100.0% (448)Unmarried:
0.0% (0)
Women who did not give birth in the past 12 months Now married:
38.0% (3,037)Unmarried:
62.0% (4,945)
Marital status - Hispanic or Latino population 15 years and over
Males 42.3% Never married46.5% Now married0.7% Separated0.1% Widowed10.3% DivorcedFemales 35.3% Never married46.6% Now married3.7% Separated5.3% Widowed9.1% DivorcedWomen who gave birth in the past 12 months Now married:
68.4% (149)Unmarried:
31.6% (69)
Women who did not give birth in the past 12 months Now married:
47.9% (1,486)Unmarried:
52.1% (1,616)
Ancestries in Framingham
8,755 21.6% Brazilian3,033 7.5% Irish2,214 5.5% Italian1,368 3.4% American1,215 3.0% English868 2.1% Russian548 1.4% European485 1.2% Portuguese376 0.9% Scottish374 0.9% Eastern European373 0.9% French Canadian361 0.9% Jamaican360 0.9% Canadian351 0.9% German345 0.9% Polish284 0.7% Iranian252 0.6% Egyptian248 0.6% African242 0.6% Haitian199 0.5% Norwegian188 0.5% Greek150 0.4% Ugandan126 0.3% Cape Verdean123 0.3% French120 0.3% Swedish115 0.3% British108 0.3% Northern European104 0.3% Finnish103 0.3% Trinidadian and Tobagonian80 0.2% Ukrainian79 0.2% Armenian78 0.2% Israeli77 0.2% Ghanaian67 0.2% Scotch-Irish67 0.2% Turkish66 0.2% Kenyan65 0.2% Lithuanian63 0.2% West Indian58 0.1% Albanian49 0.1% Nigerian45 0.1% Dutch37 0.09% Ethiopian37 0.09% Syrian35 0.09% South African32 0.08% Hungarian31 0.08% Croatian29 0.07% Austrian29 0.07% Czech29 0.07% Bahamian27 0.07% Moroccan23 0.06% Romanian23 0.06% Swiss20 0.05% Slovak18 0.04% Celtic10 0.02% Jordanian8 0.02% Welsh4 0.01% U.S. Virgin Islander
Geographical mobility in Framingham Same house 1 year ago 33,066 90.0% White (Caucasian)3,919 89.1% Black or African American80 86.5% American Indian / Alaska Native4,968 90.0% Asian26 100.0% Native Hawaiian / Pacific Islander9,653 82.5% Other race9,161 81.1% Two or more races32,531 90.7% White alone, not Hispanic / Latino10,387 81.1% Hispanic or LatinoMoved within same county 1,541 4.2% White / Caucasian158 3.6% Black or African American10 10.5% American Indian / Alaska Native351 6.4% Asian654 5.6% Other race1,250 11.1% Two or more races1,231 3.4% White alone, not Hispanic / Latino763 6.0% Hispanic or LatinoMoved within same state 1,737 4.7% White / Caucasian127 2.9% Black or African American83 1.5% Asian207 1.8% Other race247 2.2% Two or more races1,737 4.8% White alone, not Hispanic / Latino662 5.2% Hispanic or LatinoMoved from different state 191 0.5% White / Caucasian242 5.5% Black or African American77 1.4% Asian326 2.8% Other race46 0.4% Two or more races191 0.5% White alone, not Hispanic / Latino260 2.0% Hispanic or LatinoMoved from abroad 189 0.5% White64 1.5% Black or African American14 0.2% Asian792 6.8% Other race811 7.2% Two or more races189 0.5% White alone, not Hispanic / Latino804 6.3% Hispanic or Latino
Children Nativity (place of birth) in Framingham
Children under 6 years - Living with two parents Both parents native 1,117 100.0% NativeBoth parents foreign-born 1,130 70.8% Native465 29.2% Foreign-bornOne native, one foreign-born parent 394 100.0% NativeChildren under 6 years - Living with one parent Native parent 449 100.0% NativeForeign-born parent 1,425 95.7% Native64 4.3% Foreign-bornChildren 6 to 17 years - Living with two parents Both parents native 2,250 100.0% NativeBoth parents foreign-born 2,159 87.5% Native309 12.5% Foreign-bornOne native, one foreign-born parent 1,203 95.2% Native60 4.8% Foreign-bornChildren 6 to 17 years - Living with one parent Native parent 16 5.0% Native301 95.0% Foreign-bornForeign-born parent 2,181 69.9% Native940 30.1% Foreign-born
Place of birth for residents in Framingham 14,858 Americas14,484 Latin America10,061 South America4,704 Asia2,889 Central America2,195 South Central Asia1,891 Europe1,766 Eastern Asia1,637 China1,533 Caribbean1,387 Africa933 Eastern Europe632 Southern Europe406 Western Asia392 Eastern Africa386 Western Africa373 Northern America336 South Eastern Asia236 Northern Africa209 Northern Europe133 Middle Africa117 Southern Africa87 Western Europe14 Oceania8,020 Brazil1,410 India1,274 China1,245 El Salvador944 Ecuador898 Guatemala891 Dominican Republic470 Venezuela407 Russia373 Canada345 Mexico336 Pakistan310 Haiti297 Iran290 Portugal249 Italy244 Uganda241 Honduras214 Hong Kong210 Ukraine208 Colombia193 Vietnam178 Egypt149 Ghana148 Taiwan129 Argentina127 Nigeria127 Peru119 Kenya117 South Africa114 Cameroon106 Panama101 Jamaica99 Turkey96 Saudi Arabia93 Poland92 Sri Lanka89 Cabo Verde87 Trinidad and Tobago80 Greece78 Iraq77 England71 Israel68 Bahamas67 Korea62 Japan57 Morocco54 Bolivia53 Philippines51 Nicaragua49 Cambodia46 United Kingdom44 Belarus42 Czechoslovakia42 Nepal36 Ireland32 France31 Moldova28 Ethiopia27 Guyana24 Singapore22 Hungary21 Germany20 Chile19 Azerbaijan19 Scotland18 Congo17 Azores Islands17 Switzerland16 Norway16 Uzbekistan14 Thailand14 Syria13 Sweden12 Spain12 Lithuania12 Belgium10 Cuba10 Jordan10 Kuwait10 St. Lucia4 Netherlands4 Bosnia and Herzegovina
Grandparents responsible for own grandchildren in Framingham
Grandparents (30 to 59 years) White / Caucasian 31 23.2% Responsible for grandchildren103 76.8% Not responsible for grandchildrenBlack or African American 15 100.0% Not responsible for grandchildrenOther race 148 100.0% Not responsible for grandchildrenTwo or more races 39 100.0% Not responsible for grandchildrenWhite alone, not Hispanic / Latino 35 30.3% Responsible for grandchildren80 69.7% Not responsible for grandchildrenHispanic or Latino 88 100.0% Not responsible for grandchildrenGrandparents (60 years and over) White / Caucasian 54 26.4% Responsible for grandchildren152 73.6% Not responsible for grandchildrenBlack or African American 98 100.0% Not responsible for grandchildrenOther race 73 59.3% Responsible for grandchildren50 40.7% Not responsible for grandchildrenTwo or more races 48 100.0% Not responsible for grandchildrenWhite alone, not Hispanic / Latino 55 26.6% Responsible for grandchildren151 73.4% Not responsible for grandchildrenHispanic or Latino 54 100.0% Responsible for grandchildren