Races in Frankfort Square, Illinois (IL) Detailed Stats
Data:
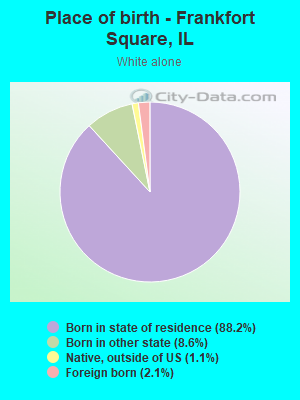
Races - White alone (%)
Races - White alone (% change since 2000)
Races - Black alone (%)
Races - Black alone (% change since 2000)
Races - American Indian alone (%)
Races - American Indian alone (% change since 2000)
Races - Asian alone (%)
Races - Asian alone (% change since 2000)
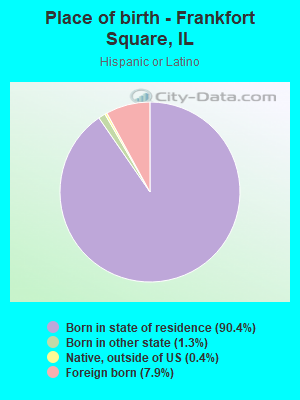
Races - Hispanic (%)
Races - Hispanic (% change since 2000)
Races - Native Hawaiian and Other Pacific Islander alone (%)
Races - Native Hawaiian and Other Pacific Islander alone (% change since 2000)
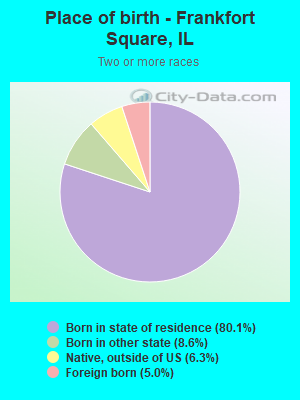
Races - Two or more races(%)
Races - Two or more races(% change since 2000)
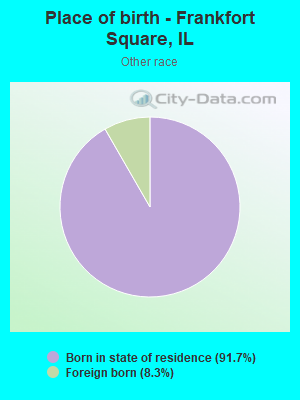
Races - Other race alone (%)
Races - Other race alone (% change since 2000)
Racial diversity
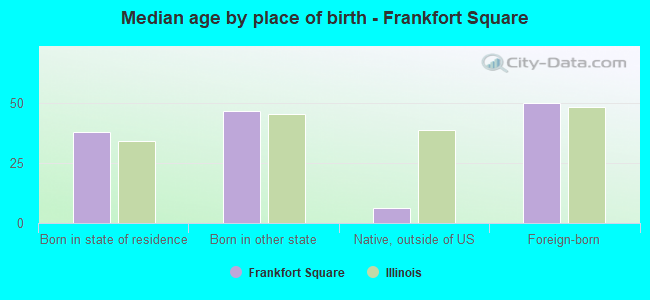
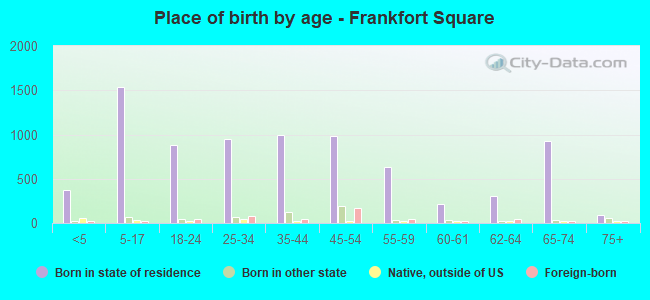
Place of birth - Born in state of residence (%)
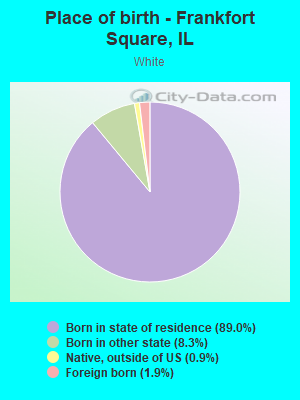
Place of birth - Born in state of residence (%) - White
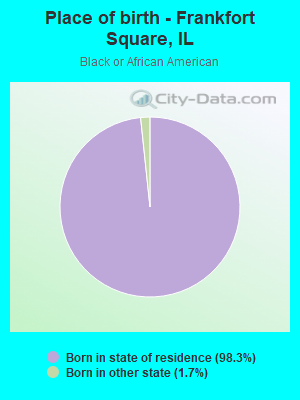
Place of birth - Born in state of residence (%) - Black or African American
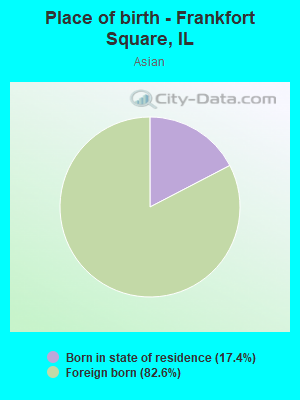
Place of birth - Born in state of residence (%) - Asian
Place of birth - Born in state of residence (%) - Hispanic or Latino
Place of birth - Born in state of residence (%) - American Indian and Alaska Native
Place of birth - Born in state of residence (%) - Multirace
Place of birth - Born in state of residence (%) - Other Race
Place of birth - Born in other state (%)
Place of birth - Born in other state (%) - White
Place of birth - Born in other state (%) - Black or African American
Place of birth - Born in other state (%) - Asian
Place of birth - Born in other state (%) - Hispanic or Latino
Place of birth - Born in other state (%) - American Indian and Alaska Native
Place of birth - Born in other state (%) - Multirace
Place of birth - Born in other state (%) - Other Race
Place of birth - Native, outside of US (%)
Place of birth - Native, outside of US (%) - White
Place of birth - Native, outside of US (%) - Black or African American
Place of birth - Native, outside of US (%) - Asian
Place of birth - Native, outside of US (%) - Hispanic or Latino
Place of birth - Native, outside of US (%) - American Indian and Alaska Native
Place of birth - Native, outside of US (%) - Multirace
Place of birth - Native, outside of US (%) - Other Race
Place of birth - Foreign born (%)
Place of birth - Foreign born (%) - White
Place of birth - Foreign born (%) - Black or African American
Place of birth - Foreign born (%) - Asian
Place of birth - Foreign born (%) - Hispanic or Latino
Place of birth - Foreign born (%) - American Indian and Alaska Native
Place of birth - Foreign born (%) - Multirace
Place of birth - Foreign born (%) - Other Race
Residents speaking English at home (%)
Residents speaking English at home - Born in the United States (%)
Residents speaking English at home - Native, born elsewhere (%)
Residents speaking English at home - Foreign born (%)
Residents speaking Spanish at home (%)
Residents speaking Spanish at home - Born in the United States (%)
Residents speaking Spanish at home - Native, born elsewhere (%)
Residents speaking Spanish at home - Foreign born (%)
Residents speaking other language at home (%)
Residents speaking other language at home - Born in the United States (%)
Residents speaking other language at home - Native, born elsewhere (%)
Residents speaking other language at home - Foreign born (%)
Marital status - Never married (%)
Marital status - Now married (%)
Marital status - Separated (%)
Marital status - Widowed (%)
Marital status - Divorced (%)
Ancestries Reported - Arab (%)
Ancestries Reported - Czech (%)
Ancestries Reported - Danish (%)
Ancestries Reported - Dutch (%)
Ancestries Reported - English (%)
Ancestries Reported - French (%)
Ancestries Reported - French Canadian (%)
Ancestries Reported - German (%)
Ancestries Reported - Greek (%)
Ancestries Reported - Hungarian (%)
Ancestries Reported - Irish (%)
Ancestries Reported - Italian (%)
Ancestries Reported - Lithuanian (%)
Ancestries Reported - Norwegian (%)
Ancestries Reported - Polish (%)
Ancestries Reported - Portuguese (%)
Ancestries Reported - Russian (%)
Ancestries Reported - Scotch-Irish (%)
Ancestries Reported - Scottish (%)
Ancestries Reported - Slovak (%)
Ancestries Reported - Subsaharan African (%)
Ancestries Reported - Swedish (%)
Ancestries Reported - Swiss (%)
Ancestries Reported - Ukrainian (%)
Ancestries Reported - United States (%)
Ancestries Reported - Welsh (%)
Ancestries Reported - West Indian (%)
Ancestries Reported - Other (%)
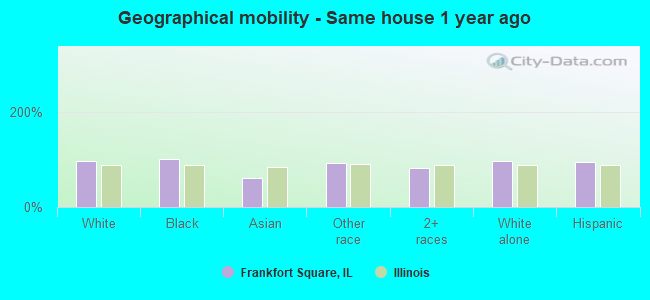
Geographical mobility - Same house 1 year ago (%)
Geographical mobility - Same house 1 year ago (%) - White
Geographical mobility - Same house 1 year ago (%) - Black or African American
Geographical mobility - Same house 1 year ago (%) - Asian
Geographical mobility - Same house 1 year ago (%) - Hispanic or Latino
Geographical mobility - Same house 1 year ago (%) - American Indian and Alaska Native
Geographical mobility - Same house 1 year ago (%) - Multirace
Geographical mobility - Same house 1 year ago (%) - Other Race
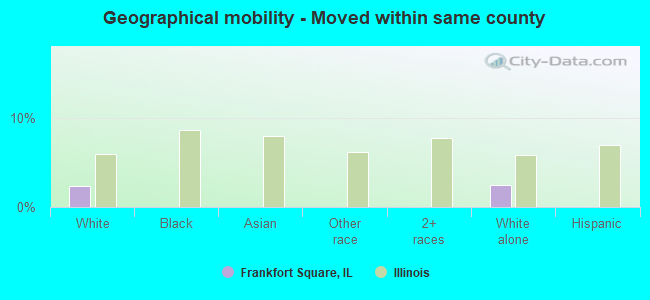
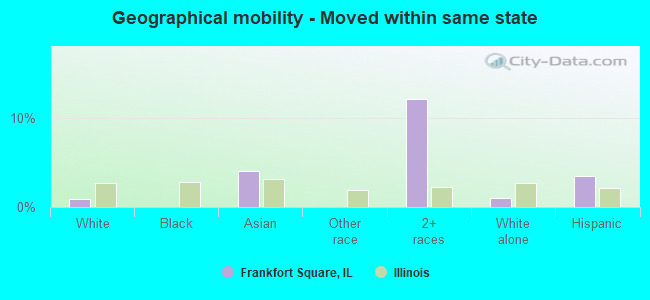
Geographical mobility - Moved within same county (%)
Geographical mobility - Moved within same county (%) - White
Geographical mobility - Moved within same county (%) - Black or African American
Geographical mobility - Moved within same county (%) - Asian
Geographical mobility - Moved within same county (%) - Hispanic or Latino
Geographical mobility - Moved within same county (%) - American Indian and Alaska Native
Geographical mobility - Moved within same county (%) - Multirace
Geographical mobility - Moved within same county (%) - Other Race
Geographical mobility - Moved from different county within same state (%)
Geographical mobility - Moved from different county within same state (%) - White
Geographical mobility - Moved from different county within same state (%) - Black or African American
Geographical mobility - Moved from different county within same state (%) - Asian
Geographical mobility - Moved from different county within same state (%) - Hispanic or Latino
Geographical mobility - Moved from different county within same state (%) - American Indian and Alaska Native
Geographical mobility - Moved from different county within same state (%) - Multirace
Geographical mobility - Moved from different county within same state (%) - Other Race
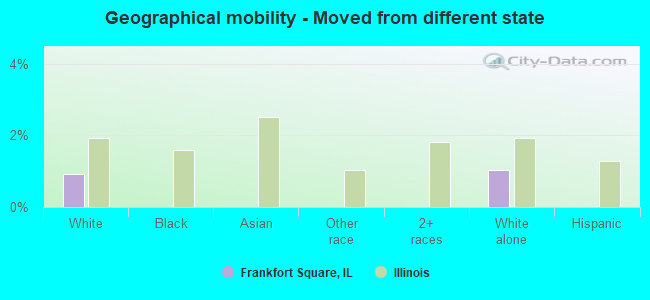
Geographical mobility - Moved from different state (%)
Geographical mobility - Moved from different state (%) - White
Geographical mobility - Moved from different state (%) - Black or African American
Geographical mobility - Moved from different state (%) - Asian
Geographical mobility - Moved from different state (%) - Hispanic or Latino
Geographical mobility - Moved from different state (%) - American Indian and Alaska Native
Geographical mobility - Moved from different state (%) - Multirace
Geographical mobility - Moved from different state (%) - Other Race
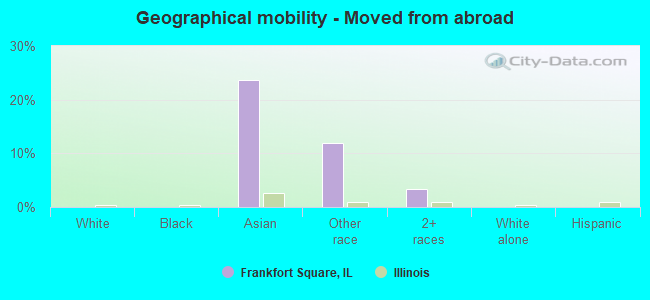
Geographical mobility - Moved from abroad (%)
Geographical mobility - Moved from abroad (%) - White
Geographical mobility - Moved from abroad (%) - Black or African American
Geographical mobility - Moved from abroad (%) - Asian
Geographical mobility - Moved from abroad (%) - Hispanic or Latino
Geographical mobility - Moved from abroad (%) - American Indian and Alaska Native
Geographical mobility - Moved from abroad (%) - Multirace
Geographical mobility - Moved from abroad (%) - Other Race
Place of birth for the foreign-born population - Ireland (%)
Place of birth for the foreign-born population - Denmark (%)
Place of birth for the foreign-born population - Norway (%)
Place of birth for the foreign-born population - Sweden (%)
Place of birth for the foreign-born population - United Kingdom (%)
Place of birth for the foreign-born population - England (%)
Place of birth for the foreign-born population - Scotland (%)
Place of birth for the foreign-born population - Other Northern Europe (%)
Place of birth for the foreign-born population - Austria (%)
Place of birth for the foreign-born population - Belgium (%)
Place of birth for the foreign-born population - France (%)
Place of birth for the foreign-born population - Germany (%)
Place of birth for the foreign-born population - Netherlands (%)
Place of birth for the foreign-born population - Switzerland (%)
Place of birth for the foreign-born population - Other Western Europe (%)
Place of birth for the foreign-born population - Greece (%)
Place of birth for the foreign-born population - Italy (%)
Place of birth for the foreign-born population - Portugal (%)
Place of birth for the foreign-born population - Spain (%)
Place of birth for the foreign-born population - Other Southern Europe (%)
Place of birth for the foreign-born population - Albania (%)
Place of birth for the foreign-born population - Belarus (%)
Place of birth for the foreign-born population - Bosnia and Herzegovina (%)
Place of birth for the foreign-born population - Bulgaria (%)
Place of birth for the foreign-born population - Croatia (%)
Place of birth for the foreign-born population - Czechoslovakia (%)
Place of birth for the foreign-born population - Hungary (%)
Place of birth for the foreign-born population - Latvia (%)
Place of birth for the foreign-born population - Lithuania (%)
Place of birth for the foreign-born population - North Macedonia (Macedonia) (%)
Place of birth for the foreign-born population - Moldova (%)
Place of birth for the foreign-born population - Poland (%)
Place of birth for the foreign-born population - Romania (%)
Place of birth for the foreign-born population - Russia (%)
Place of birth for the foreign-born population - Serbia (%)
Place of birth for the foreign-born population - Ukraine (%)
Place of birth for the foreign-born population - Other Eastern Europe (%)
Place of birth for the foreign-born population - China (%)
Place of birth for the foreign-born population - Hong Kong (%)
Place of birth for the foreign-born population - Taiwan (%)
Place of birth for the foreign-born population - Japan (%)
Place of birth for the foreign-born population - Korea (%)
Place of birth for the foreign-born population - Other Eastern Asia (%)
Place of birth for the foreign-born population - Afghanistan (%)
Place of birth for the foreign-born population - Bangladesh (%)
Place of birth for the foreign-born population - India (%)
Place of birth for the foreign-born population - Iran (%)
Place of birth for the foreign-born population - Kazakhstan (%)
Place of birth for the foreign-born population - Nepal (%)
Place of birth for the foreign-born population - Pakistan (%)
Place of birth for the foreign-born population - Sri Lanka (%)
Place of birth for the foreign-born population - Uzbekistan (%)
Place of birth for the foreign-born population - Other South Central Asia (%)
Place of birth for the foreign-born population - Burma (%)
Place of birth for the foreign-born population - Cambodia (%)
Place of birth for the foreign-born population - Indonesia (%)
Place of birth for the foreign-born population - Laos (%)
Place of birth for the foreign-born population - Malaysia (%)
Place of birth for the foreign-born population - Philippines (%)
Place of birth for the foreign-born population - Singapore (%)
Place of birth for the foreign-born population - Thailand (%)
Place of birth for the foreign-born population - Vietnam (%)
Place of birth for the foreign-born population - Other South Eastern Asia (%)
Place of birth for the foreign-born population - Armenia (%)
Place of birth for the foreign-born population - Iraq (%)
Place of birth for the foreign-born population - Israel (%)
Place of birth for the foreign-born population - Jordan (%)
Place of birth for the foreign-born population - Kuwait (%)
Place of birth for the foreign-born population - Lebanon (%)
Place of birth for the foreign-born population - Saudi Arabia (%)
Place of birth for the foreign-born population - Syria (%)
Place of birth for the foreign-born population - Turkey (%)
Place of birth for the foreign-born population - Yemen (%)
Place of birth for the foreign-born population - Other Western Asia (%)
Place of birth for the foreign-born population - Eritrea (%)
Place of birth for the foreign-born population - Ethiopia (%)
Place of birth for the foreign-born population - Kenya (%)
Place of birth for the foreign-born population - Somalia (%)
Place of birth for the foreign-born population - Uganda (%)
Place of birth for the foreign-born population - Zimbabwe (%)
Place of birth for the foreign-born population - Other Eastern Africa (%)
Place of birth for the foreign-born population - Cameroon (%)
Place of birth for the foreign-born population - Congo (%)
Place of birth for the foreign-born population - Democratic Republic of Congo (Zaire) (%)
Place of birth for the foreign-born population - Other Middle Africa (%)
Place of birth for the foreign-born population - Egypt (%)
Place of birth for the foreign-born population - Morocco (%)
Place of birth for the foreign-born population - Sudan (%)
Place of birth for the foreign-born population - Other Northern Africa (%)
Place of birth for the foreign-born population - South Africa (%)
Place of birth for the foreign-born population - Other Southern Africa (%)
Place of birth for the foreign-born population - Cabo Verde (%)
Place of birth for the foreign-born population - Ghana (%)
Place of birth for the foreign-born population - Liberia (%)
Place of birth for the foreign-born population - Nigeria (%)
Place of birth for the foreign-born population - Senegal (%)
Place of birth for the foreign-born population - Sierra Leone (%)
Place of birth for the foreign-born population - Other Western Africa (%)
Place of birth for the foreign-born population - Australia (%)
Place of birth for the foreign-born population - New Zealand (%)
Place of birth for the foreign-born population - Fiji (%)
Place of birth for the foreign-born population - Micronesia (%)
Place of birth for the foreign-born population - Bahamas (%)
Place of birth for the foreign-born population - Barbados (%)
Place of birth for the foreign-born population - Cuba (%)
Place of birth for the foreign-born population - Dominica (%)
Place of birth for the foreign-born population - Dominican Republic (%)
Place of birth for the foreign-born population - Grenada (%)
Place of birth for the foreign-born population - Haiti (%)
Place of birth for the foreign-born population - Jamaica (%)
Place of birth for the foreign-born population - St. Vincent and the Grenadines (%)
Place of birth for the foreign-born population - Trinidad and Tobago (%)
Place of birth for the foreign-born population - West Indies (%)
Place of birth for the foreign-born population - Other Caribbean (%)
Place of birth for the foreign-born population - Belize (%)
Place of birth for the foreign-born population - Costa Rica (%)
Place of birth for the foreign-born population - El Salvador (%)
Place of birth for the foreign-born population - Guatemala (%)
Place of birth for the foreign-born population - Honduras (%)
Place of birth for the foreign-born population - Mexico (%)
Place of birth for the foreign-born population - Nicaragua (%)
Place of birth for the foreign-born population - Panama (%)
Place of birth for the foreign-born population - Other Central America (%)
Place of birth for the foreign-born population - Argentina (%)
Place of birth for the foreign-born population - Bolivia (%)
Place of birth for the foreign-born population - Brazil (%)
Place of birth for the foreign-born population - Chile (%)
Place of birth for the foreign-born population - Colombia (%)
Place of birth for the foreign-born population - Ecuador (%)
Place of birth for the foreign-born population - Guyana (%)
Place of birth for the foreign-born population - Peru (%)
Place of birth for the foreign-born population - Uruguay (%)
Place of birth for the foreign-born population - Venezuela (%)
Place of birth for the foreign-born population - Other South America (%)
Place of birth for the foreign-born population - Canada (%)
Place of birth for the foreign-born population - Other Northern America (%)
Place of birth for the foreign-born population - Other (%)
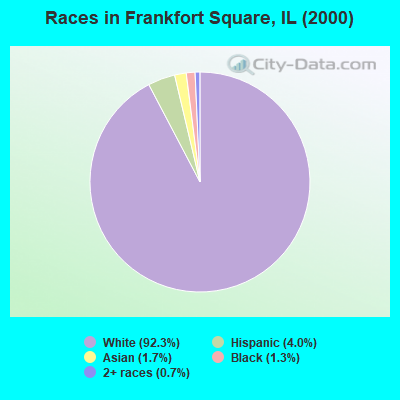
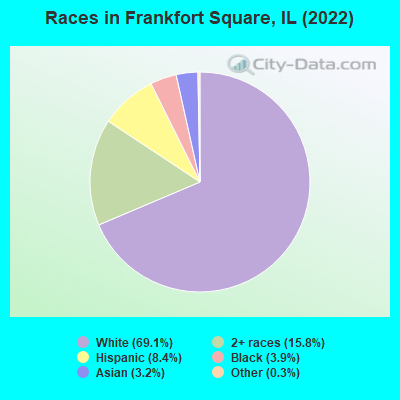
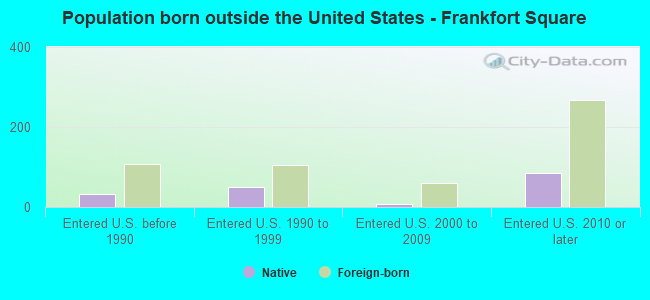
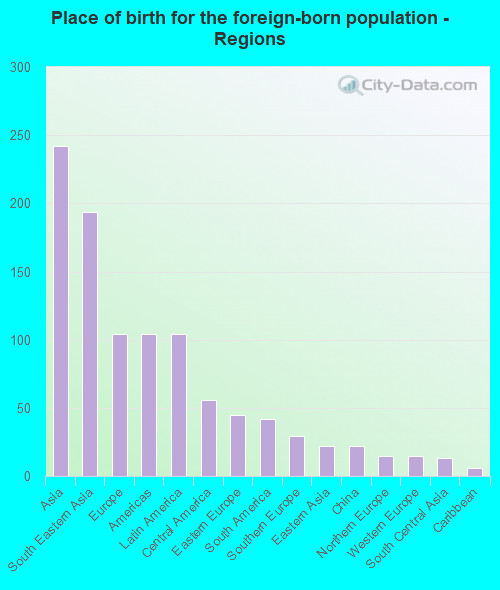
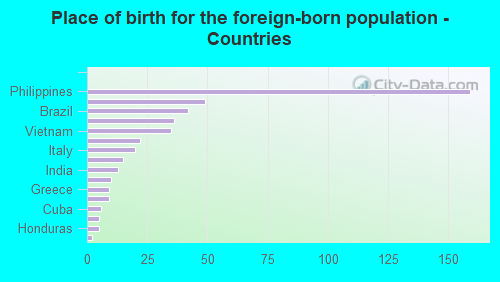
According to 2022 data, the most numerous races in Frankfort Square, IL are White alone (6,475 residents), Hispanic (789 residents), and Black alone (361 residents). 90.1% of Frankfort Square residents speak English at home. 4.8% of Frankfort Square, IL residents are foreign-born (2.6% born in Asia, 1.1% born in Europe, 1.1% born in Latin America), which is 190.8% less than the foreign-born rate of 14.0% across the entire state of Illinois.
Race distribution in Frankfort Square
2000 2022
8,424,140 67.8% White alone 1,856,152 14.9% Black alone 1,530,262 12.3% Hispanic 419,916 3.4% Asian alone 153,996 1.2% Two or more races 13,479 0.1% Other race alone 18,232 0.1% American Indian alone 3,116 0.03% Native Hawaiian and Other
7,356,301 58.5% White alone 2,299,726 18.3% Hispanic 1,660,423 13.2% Black alone 747,296 5.9% Asian alone 458,599 3.6% Two or more races 45,386 0.4% Other race alone 10,405 0.08% American Indian alone 3,896 0.03% Native Hawaiian and Other
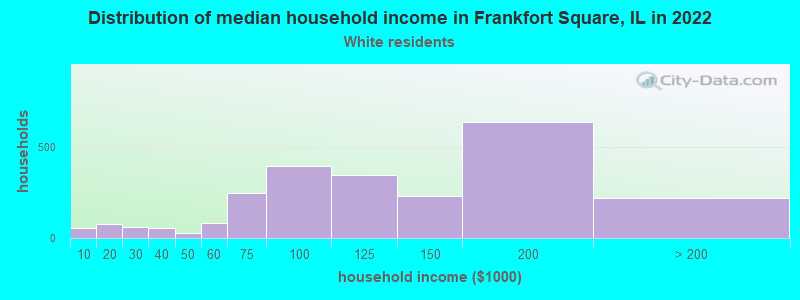
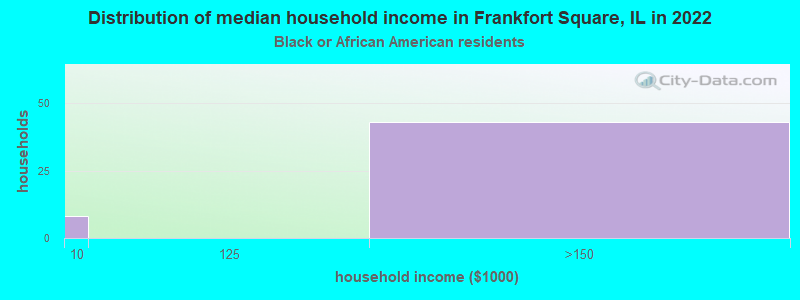
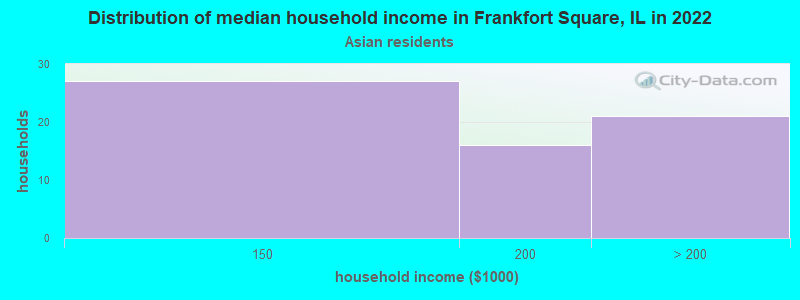
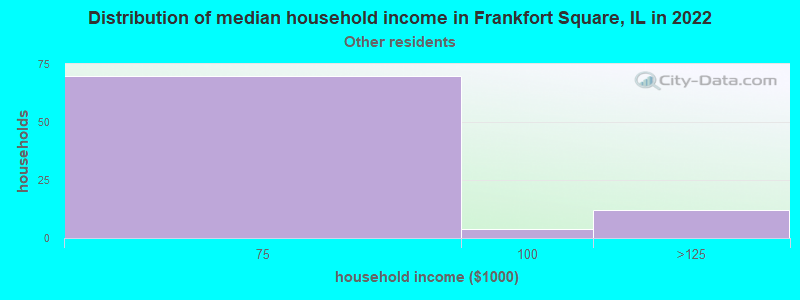
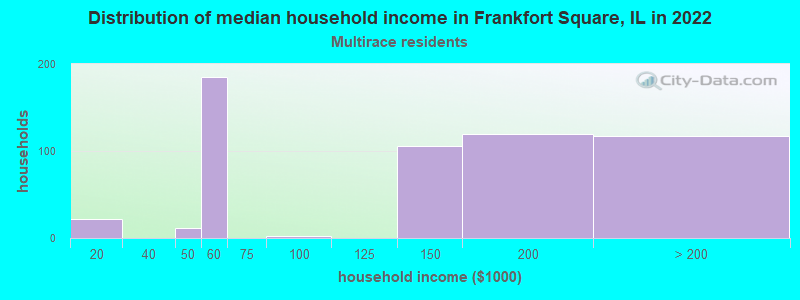
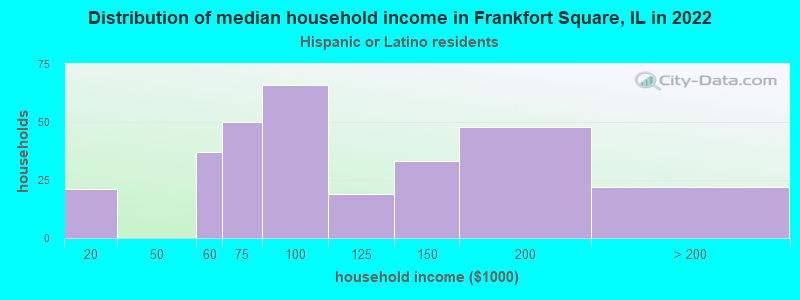
Income and house value in Frankfort Square Median household income in 2022 $108,860 White non-Hispanic householders$151,184 Asian householders$72,637 Some other race householders$138,473 Two or more races householders$96,392 Hispanic or Latino race householdersMedian 2022 house value $294,646 White Non-Hispanic householders$352,650 Black or African American householders $276,532 Asian householders$361,322 Some other race householders$331,645 Hispanic or Latino householders
Median age by race in Frankfort Square
42.4 Median age for White residents41.3 44.2 18.8 Median age for Black or African American residents19.2 -698,752,227.5 -801,714,897.4 Median age for American Indian / Alaska Native residents-764,890,281.4 -844,733,984.0 43.5 Median age for Asian residents49.0 30.5 -593,236,714.4 Median age for Native Hawaiian / Pacific Islander residents-658,536,584.7 -576,015,108.0 70.7 Median age for Other race residents72.7 70.7 30.4 Median age for Two or more races residents26.3 31.4 41.7 Median age for White alone residents40.9 43.5 27.4 Median age for Hispanic or Latino residents35.2 24.8
Owner/renter occupied households by race in Frankfort Square
House owners and renters - White residents 2,300 94.1% Owner occupied145 5.9% Renter occupiedHouse owners and renters - Black or African American residents 74 100.0% Owner occupiedHouse owners and renters - Asian residents 47 76.7% Owner occupied14 23.3% Renter occupiedHouse owners and renters - Other race residents 80 100.0% Owner occupiedHouse owners and renters - Two or more races residents 515 82.7% Owner occupied108 17.3% Renter occupiedHouse owners and renters - White alone residents 2,227 94.5% Owner occupied130 5.5% Renter occupiedHouse owners and renters - Hispanic or Latino residents 299 91.8% Owner occupied27 8.2% Renter occupied
Language usage in Frankfort Square
English speakers - Total 90.1% of residents of Frankfort Square speak English at home.
2.5% of residents speak Spanish at home 192 84.6% Speak English very well35 15.4% Speak English less than very well6.2% of residents speak other language at home 489 87.8% Speak English very well68 12.2% Speak English less than very well
English speakers - Born in the United States 98.7% of residents of Frankfort Square speak English at home.
All residents speak only English at home
English speakers - Foreign-born 3.8% of residents of Frankfort Square speak English at home.
12.7% of residents speak Spanish at home 28 44.4% Speak English very well35 55.6% Speak English less than very well91.3% of residents speak other language at home 383 84.7% Speak English very well69 15.3% Speak English less than very well
White (Caucasian) - Speak only English Native:
99.7% (6,146)Foreign-born:
16.1% (19)
White (Caucasian) - Speak another language Native:
1.6% (96)Foreign-born:
83.5% (101)
Asian - Speak another language Native:
81.5% (44)Foreign-born:
100.0% (248)
Two or more races - Speak another language Native:
6.5% (114)Foreign-born:
99.7% (101)
White alone - Speak only English Native:
98.9% (5,997)Foreign-born:
16.5% (22)
White alone - Speak another language Native:
1.0% (60)Foreign-born:
83.8% (111)
Hispanic or Latino - Speak another language Native:
25.0% (162)Foreign-born:
99.9% (63)
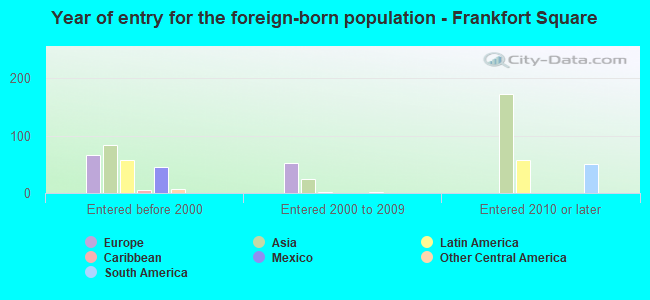
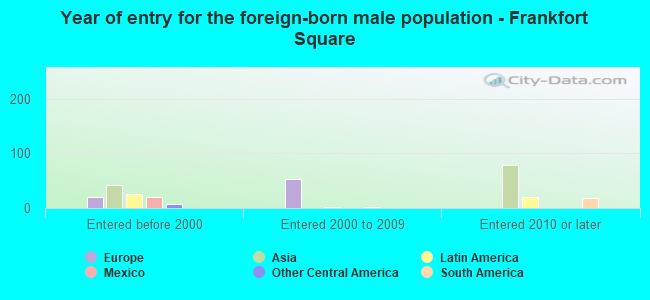
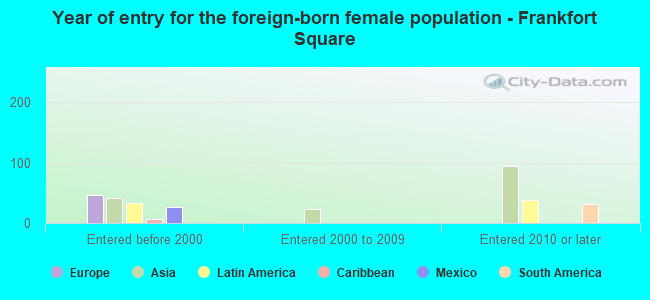
Foreign-born residents in Frankfort Square 451 residents are foreign born (2.6% Asia , 1.1% Europe , 1.1% Latin America ).
This city:
4.8%Illinois:
14.1%
Marital status for residents in Frankfort Square Marital status - White (Caucasian) population 15 years and over
Males 30.7% Never married62.3% Now married0.0% Separated0.4% Widowed6.5% DivorcedFemales 28.8% Never married60.4% Now married0.0% Separated1.9% Widowed8.9% DivorcedWomen who gave birth in the past 12 months Now married:
91.1% (100)Unmarried:
8.9% (10)
Women who did not give birth in the past 12 months Now married:
44.4% (640)Unmarried:
55.6% (802)
Marital status - Black or African American population 15 years and over
Males 64.9% Never married32.4% Now married0.0% Separated0.0% Widowed2.7% DivorcedFemales 0.0% Never married100.0% Now married0.0% Separated0.0% Widowed0.0% DivorcedMarital status - Asian population 15 years and over
Males 0.0% Never married82.5% Now married0.0% Separated0.0% Widowed17.5% DivorcedFemales 51.6% Never married44.6% Now married0.0% Separated3.8% Widowed0.0% DivorcedWomen who did not give birth in the past 12 months Now married:
35.2% (48)Unmarried:
64.8% (88)
Marital status - Other race population 15 years and over
Males 13.5% Never married82.7% Now married0.0% Separated3.8% Widowed0.0% DivorcedFemales 14.0% Never married76.0% Now married0.0% Separated10.0% Widowed0.0% DivorcedWomen who did not give birth in the past 12 months Now married:
69.6% (40)Unmarried:
30.4% (18)
Marital status - Two or more races population 15 years and over
Males 11.5% Never married81.4% Now married0.0% Separated0.0% Widowed7.1% DivorcedFemales 46.5% Never married51.3% Now married0.0% Separated0.0% Widowed2.2% DivorcedWomen who gave birth in the past 12 months Now married:
67.6% (71)Unmarried:
32.4% (34)
Women who did not give birth in the past 12 months Now married:
41.1% (238)Unmarried:
58.9% (341)
Marital status - White alone, not Hispanic / Latino population 15 years and over
Males 30.0% Never married62.6% Now married0.0% Separated0.4% Widowed7.0% DivorcedFemales 28.1% Never married60.6% Now married0.0% Separated1.8% Widowed9.4% DivorcedWomen who gave birth in the past 12 months Now married:
91.1% (107)Unmarried:
8.9% (10)
Women who did not give birth in the past 12 months Now married:
43.4% (604)Unmarried:
56.6% (789)
Marital status - Hispanic or Latino population 15 years and over
Males 32.2% Never married67.2% Now married0.0% Separated0.6% Widowed0.0% DivorcedFemales 41.4% Never married52.9% Now married0.0% Separated5.7% Widowed0.0% DivorcedWomen who gave birth in the past 12 months Now married:
0.0% (0)Unmarried:
100.0% (25)
Women who did not give birth in the past 12 months Now married:
58.0% (134)Unmarried:
42.0% (97)
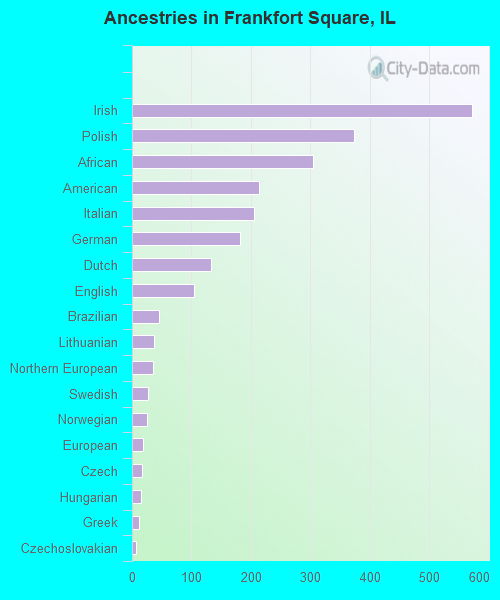
Ancestries in Frankfort Square
572 18.5% Irish374 12.1% Polish304 9.8% African214 6.9% American205 6.6% Italian181 5.8% German133 4.3% Dutch105 3.4% English45 1.5% Brazilian37 1.2% Lithuanian35 1.1% Northern European27 0.9% Swedish26 0.8% Norwegian19 0.6% European16 0.5% Czech15 0.5% Hungarian11 0.4% Greek6 0.2% Czechoslovakian5 0.2% French Canadian4 0.1% Eastern European3 0.10% Scotch-Irish3 0.10% Slovak
Children Nativity (place of birth) in Frankfort Square
Children under 6 years - Living with two parents Both parents native 464 100.0% NativeBoth parents foreign-born 16 100.0% Foreign-bornChildren under 6 years - Living with one parent Native parent 113 100.0% NativeForeign-born parent 15 100.0% NativeChildren 6 to 17 years - Living with two parents Both parents native 1,114 100.0% NativeBoth parents foreign-born 39 100.0% NativeChildren 6 to 17 years - Living with one parent Native parent 289 100.0% NativeForeign-born parent 26 47.4% Native29 52.6% Foreign-born
Grandparents responsible for own grandchildren in Frankfort Square
Grandparents (30 to 59 years) White / Caucasian 10 100.0% Not responsible for grandchildrenTwo or more races 46 100.0% Not responsible for grandchildrenWhite alone, not Hispanic / Latino 13 100.0% Not responsible for grandchildrenHispanic or Latino 20 100.0% Not responsible for grandchildren
Grandparents (60 years and over) White / Caucasian 92 100.0% Not responsible for grandchildrenWhite alone, not Hispanic / Latino 95 100.0% Not responsible for grandchildren