Races in Franklin, Indiana (IN) Detailed Stats
Data:
Races - White alone (%)
Races - White alone (% change since 2000)
Races - Black alone (%)
Races - Black alone (% change since 2000)
Races - American Indian alone (%)
Races - American Indian alone (% change since 2000)
Races - Asian alone (%)
Races - Asian alone (% change since 2000)
Races - Hispanic (%)
Races - Hispanic (% change since 2000)
Races - Native Hawaiian and Other Pacific Islander alone (%)
Races - Native Hawaiian and Other Pacific Islander alone (% change since 2000)
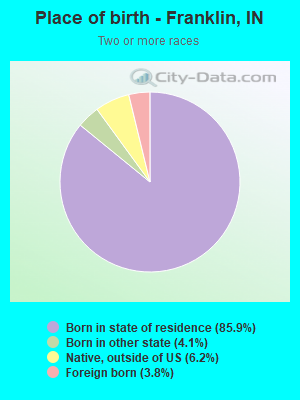
Races - Two or more races(%)
Races - Two or more races(% change since 2000)
Races - Other race alone (%)
Races - Other race alone (% change since 2000)
Racial diversity
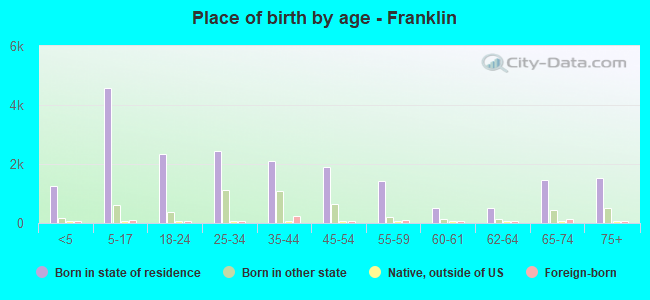
Place of birth - Born in state of residence (%)
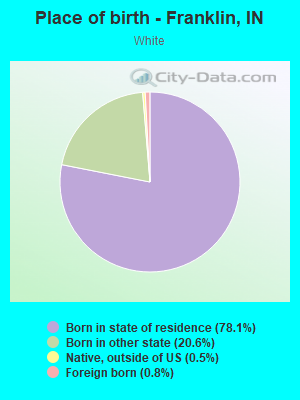
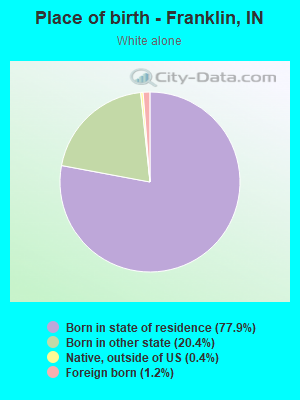
Place of birth - Born in state of residence (%) - White
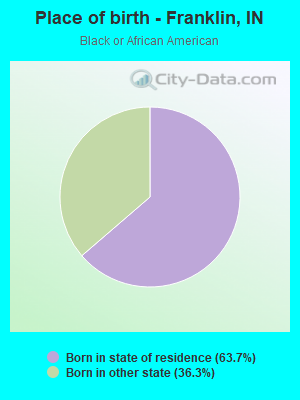
Place of birth - Born in state of residence (%) - Black or African American
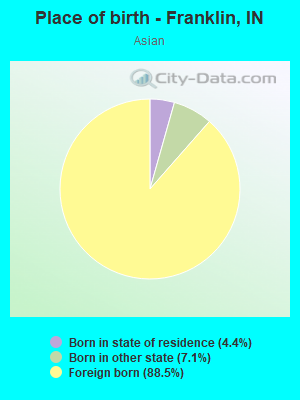
Place of birth - Born in state of residence (%) - Asian
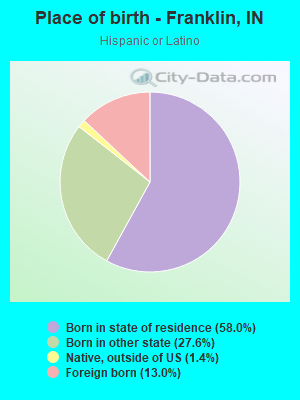
Place of birth - Born in state of residence (%) - Hispanic or Latino
Place of birth - Born in state of residence (%) - American Indian and Alaska Native
Place of birth - Born in state of residence (%) - Multirace
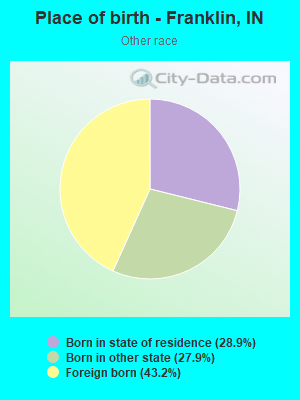
Place of birth - Born in state of residence (%) - Other Race
Place of birth - Born in other state (%)
Place of birth - Born in other state (%) - White
Place of birth - Born in other state (%) - Black or African American
Place of birth - Born in other state (%) - Asian
Place of birth - Born in other state (%) - Hispanic or Latino
Place of birth - Born in other state (%) - American Indian and Alaska Native
Place of birth - Born in other state (%) - Multirace
Place of birth - Born in other state (%) - Other Race
Place of birth - Native, outside of US (%)
Place of birth - Native, outside of US (%) - White
Place of birth - Native, outside of US (%) - Black or African American
Place of birth - Native, outside of US (%) - Asian
Place of birth - Native, outside of US (%) - Hispanic or Latino
Place of birth - Native, outside of US (%) - American Indian and Alaska Native
Place of birth - Native, outside of US (%) - Multirace
Place of birth - Native, outside of US (%) - Other Race
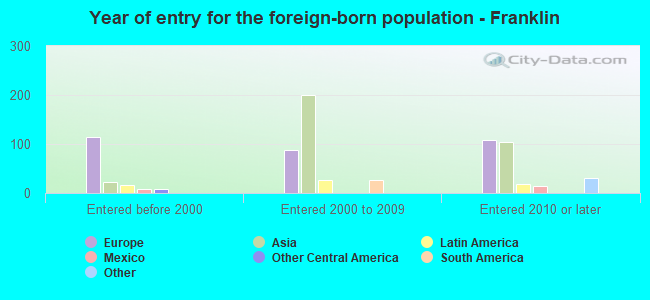
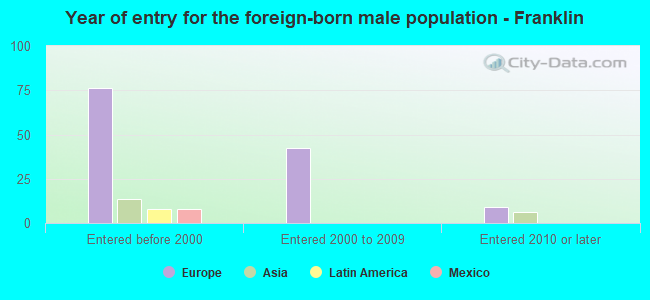
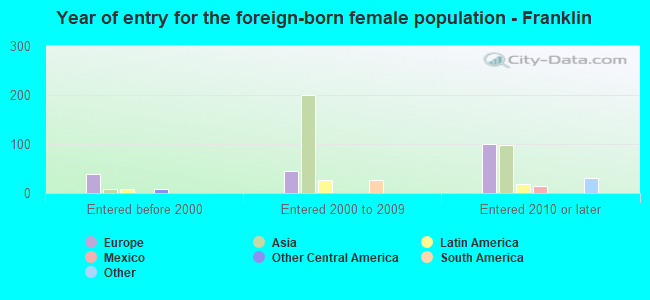
Place of birth - Foreign born (%)
Place of birth - Foreign born (%) - White
Place of birth - Foreign born (%) - Black or African American
Place of birth - Foreign born (%) - Asian
Place of birth - Foreign born (%) - Hispanic or Latino
Place of birth - Foreign born (%) - American Indian and Alaska Native
Place of birth - Foreign born (%) - Multirace
Place of birth - Foreign born (%) - Other Race
Residents speaking English at home (%)
Residents speaking English at home - Born in the United States (%)
Residents speaking English at home - Native, born elsewhere (%)
Residents speaking English at home - Foreign born (%)
Residents speaking Spanish at home (%)
Residents speaking Spanish at home - Born in the United States (%)
Residents speaking Spanish at home - Native, born elsewhere (%)
Residents speaking Spanish at home - Foreign born (%)
Residents speaking other language at home (%)
Residents speaking other language at home - Born in the United States (%)
Residents speaking other language at home - Native, born elsewhere (%)
Residents speaking other language at home - Foreign born (%)
Marital status - Never married (%)
Marital status - Now married (%)
Marital status - Separated (%)
Marital status - Widowed (%)
Marital status - Divorced (%)
Ancestries Reported - Arab (%)
Ancestries Reported - Czech (%)
Ancestries Reported - Danish (%)
Ancestries Reported - Dutch (%)
Ancestries Reported - English (%)
Ancestries Reported - French (%)
Ancestries Reported - French Canadian (%)
Ancestries Reported - German (%)
Ancestries Reported - Greek (%)
Ancestries Reported - Hungarian (%)
Ancestries Reported - Irish (%)
Ancestries Reported - Italian (%)
Ancestries Reported - Lithuanian (%)
Ancestries Reported - Norwegian (%)
Ancestries Reported - Polish (%)
Ancestries Reported - Portuguese (%)
Ancestries Reported - Russian (%)
Ancestries Reported - Scotch-Irish (%)
Ancestries Reported - Scottish (%)
Ancestries Reported - Slovak (%)
Ancestries Reported - Subsaharan African (%)
Ancestries Reported - Swedish (%)
Ancestries Reported - Swiss (%)
Ancestries Reported - Ukrainian (%)
Ancestries Reported - United States (%)
Ancestries Reported - Welsh (%)
Ancestries Reported - West Indian (%)
Ancestries Reported - Other (%)
Geographical mobility - Same house 1 year ago (%)
Geographical mobility - Same house 1 year ago (%) - White
Geographical mobility - Same house 1 year ago (%) - Black or African American
Geographical mobility - Same house 1 year ago (%) - Asian
Geographical mobility - Same house 1 year ago (%) - Hispanic or Latino
Geographical mobility - Same house 1 year ago (%) - American Indian and Alaska Native
Geographical mobility - Same house 1 year ago (%) - Multirace
Geographical mobility - Same house 1 year ago (%) - Other Race
Geographical mobility - Moved within same county (%)
Geographical mobility - Moved within same county (%) - White
Geographical mobility - Moved within same county (%) - Black or African American
Geographical mobility - Moved within same county (%) - Asian
Geographical mobility - Moved within same county (%) - Hispanic or Latino
Geographical mobility - Moved within same county (%) - American Indian and Alaska Native
Geographical mobility - Moved within same county (%) - Multirace
Geographical mobility - Moved within same county (%) - Other Race
Geographical mobility - Moved from different county within same state (%)
Geographical mobility - Moved from different county within same state (%) - White
Geographical mobility - Moved from different county within same state (%) - Black or African American
Geographical mobility - Moved from different county within same state (%) - Asian
Geographical mobility - Moved from different county within same state (%) - Hispanic or Latino
Geographical mobility - Moved from different county within same state (%) - American Indian and Alaska Native
Geographical mobility - Moved from different county within same state (%) - Multirace
Geographical mobility - Moved from different county within same state (%) - Other Race
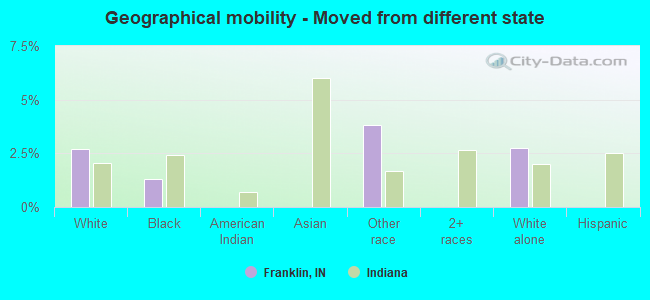
Geographical mobility - Moved from different state (%)
Geographical mobility - Moved from different state (%) - White
Geographical mobility - Moved from different state (%) - Black or African American
Geographical mobility - Moved from different state (%) - Asian
Geographical mobility - Moved from different state (%) - Hispanic or Latino
Geographical mobility - Moved from different state (%) - American Indian and Alaska Native
Geographical mobility - Moved from different state (%) - Multirace
Geographical mobility - Moved from different state (%) - Other Race
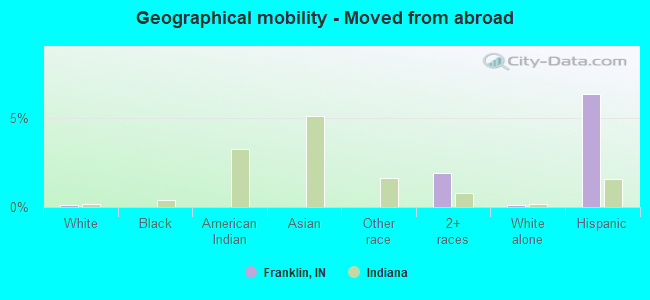
Geographical mobility - Moved from abroad (%)
Geographical mobility - Moved from abroad (%) - White
Geographical mobility - Moved from abroad (%) - Black or African American
Geographical mobility - Moved from abroad (%) - Asian
Geographical mobility - Moved from abroad (%) - Hispanic or Latino
Geographical mobility - Moved from abroad (%) - American Indian and Alaska Native
Geographical mobility - Moved from abroad (%) - Multirace
Geographical mobility - Moved from abroad (%) - Other Race
Place of birth for the foreign-born population - Ireland (%)
Place of birth for the foreign-born population - Denmark (%)
Place of birth for the foreign-born population - Norway (%)
Place of birth for the foreign-born population - Sweden (%)
Place of birth for the foreign-born population - United Kingdom (%)
Place of birth for the foreign-born population - England (%)
Place of birth for the foreign-born population - Scotland (%)
Place of birth for the foreign-born population - Other Northern Europe (%)
Place of birth for the foreign-born population - Austria (%)
Place of birth for the foreign-born population - Belgium (%)
Place of birth for the foreign-born population - France (%)
Place of birth for the foreign-born population - Germany (%)
Place of birth for the foreign-born population - Netherlands (%)
Place of birth for the foreign-born population - Switzerland (%)
Place of birth for the foreign-born population - Other Western Europe (%)
Place of birth for the foreign-born population - Greece (%)
Place of birth for the foreign-born population - Italy (%)
Place of birth for the foreign-born population - Portugal (%)
Place of birth for the foreign-born population - Spain (%)
Place of birth for the foreign-born population - Other Southern Europe (%)
Place of birth for the foreign-born population - Albania (%)
Place of birth for the foreign-born population - Belarus (%)
Place of birth for the foreign-born population - Bosnia and Herzegovina (%)
Place of birth for the foreign-born population - Bulgaria (%)
Place of birth for the foreign-born population - Croatia (%)
Place of birth for the foreign-born population - Czechoslovakia (%)
Place of birth for the foreign-born population - Hungary (%)
Place of birth for the foreign-born population - Latvia (%)
Place of birth for the foreign-born population - Lithuania (%)
Place of birth for the foreign-born population - North Macedonia (Macedonia) (%)
Place of birth for the foreign-born population - Moldova (%)
Place of birth for the foreign-born population - Poland (%)
Place of birth for the foreign-born population - Romania (%)
Place of birth for the foreign-born population - Russia (%)
Place of birth for the foreign-born population - Serbia (%)
Place of birth for the foreign-born population - Ukraine (%)
Place of birth for the foreign-born population - Other Eastern Europe (%)
Place of birth for the foreign-born population - China (%)
Place of birth for the foreign-born population - Hong Kong (%)
Place of birth for the foreign-born population - Taiwan (%)
Place of birth for the foreign-born population - Japan (%)
Place of birth for the foreign-born population - Korea (%)
Place of birth for the foreign-born population - Other Eastern Asia (%)
Place of birth for the foreign-born population - Afghanistan (%)
Place of birth for the foreign-born population - Bangladesh (%)
Place of birth for the foreign-born population - India (%)
Place of birth for the foreign-born population - Iran (%)
Place of birth for the foreign-born population - Kazakhstan (%)
Place of birth for the foreign-born population - Nepal (%)
Place of birth for the foreign-born population - Pakistan (%)
Place of birth for the foreign-born population - Sri Lanka (%)
Place of birth for the foreign-born population - Uzbekistan (%)
Place of birth for the foreign-born population - Other South Central Asia (%)
Place of birth for the foreign-born population - Burma (%)
Place of birth for the foreign-born population - Cambodia (%)
Place of birth for the foreign-born population - Indonesia (%)
Place of birth for the foreign-born population - Laos (%)
Place of birth for the foreign-born population - Malaysia (%)
Place of birth for the foreign-born population - Philippines (%)
Place of birth for the foreign-born population - Singapore (%)
Place of birth for the foreign-born population - Thailand (%)
Place of birth for the foreign-born population - Vietnam (%)
Place of birth for the foreign-born population - Other South Eastern Asia (%)
Place of birth for the foreign-born population - Armenia (%)
Place of birth for the foreign-born population - Iraq (%)
Place of birth for the foreign-born population - Israel (%)
Place of birth for the foreign-born population - Jordan (%)
Place of birth for the foreign-born population - Kuwait (%)
Place of birth for the foreign-born population - Lebanon (%)
Place of birth for the foreign-born population - Saudi Arabia (%)
Place of birth for the foreign-born population - Syria (%)
Place of birth for the foreign-born population - Turkey (%)
Place of birth for the foreign-born population - Yemen (%)
Place of birth for the foreign-born population - Other Western Asia (%)
Place of birth for the foreign-born population - Eritrea (%)
Place of birth for the foreign-born population - Ethiopia (%)
Place of birth for the foreign-born population - Kenya (%)
Place of birth for the foreign-born population - Somalia (%)
Place of birth for the foreign-born population - Uganda (%)
Place of birth for the foreign-born population - Zimbabwe (%)
Place of birth for the foreign-born population - Other Eastern Africa (%)
Place of birth for the foreign-born population - Cameroon (%)
Place of birth for the foreign-born population - Congo (%)
Place of birth for the foreign-born population - Democratic Republic of Congo (Zaire) (%)
Place of birth for the foreign-born population - Other Middle Africa (%)
Place of birth for the foreign-born population - Egypt (%)
Place of birth for the foreign-born population - Morocco (%)
Place of birth for the foreign-born population - Sudan (%)
Place of birth for the foreign-born population - Other Northern Africa (%)
Place of birth for the foreign-born population - South Africa (%)
Place of birth for the foreign-born population - Other Southern Africa (%)
Place of birth for the foreign-born population - Cabo Verde (%)
Place of birth for the foreign-born population - Ghana (%)
Place of birth for the foreign-born population - Liberia (%)
Place of birth for the foreign-born population - Nigeria (%)
Place of birth for the foreign-born population - Senegal (%)
Place of birth for the foreign-born population - Sierra Leone (%)
Place of birth for the foreign-born population - Other Western Africa (%)
Place of birth for the foreign-born population - Australia (%)
Place of birth for the foreign-born population - New Zealand (%)
Place of birth for the foreign-born population - Fiji (%)
Place of birth for the foreign-born population - Micronesia (%)
Place of birth for the foreign-born population - Bahamas (%)
Place of birth for the foreign-born population - Barbados (%)
Place of birth for the foreign-born population - Cuba (%)
Place of birth for the foreign-born population - Dominica (%)
Place of birth for the foreign-born population - Dominican Republic (%)
Place of birth for the foreign-born population - Grenada (%)
Place of birth for the foreign-born population - Haiti (%)
Place of birth for the foreign-born population - Jamaica (%)
Place of birth for the foreign-born population - St. Vincent and the Grenadines (%)
Place of birth for the foreign-born population - Trinidad and Tobago (%)
Place of birth for the foreign-born population - West Indies (%)
Place of birth for the foreign-born population - Other Caribbean (%)
Place of birth for the foreign-born population - Belize (%)
Place of birth for the foreign-born population - Costa Rica (%)
Place of birth for the foreign-born population - El Salvador (%)
Place of birth for the foreign-born population - Guatemala (%)
Place of birth for the foreign-born population - Honduras (%)
Place of birth for the foreign-born population - Mexico (%)
Place of birth for the foreign-born population - Nicaragua (%)
Place of birth for the foreign-born population - Panama (%)
Place of birth for the foreign-born population - Other Central America (%)
Place of birth for the foreign-born population - Argentina (%)
Place of birth for the foreign-born population - Bolivia (%)
Place of birth for the foreign-born population - Brazil (%)
Place of birth for the foreign-born population - Chile (%)
Place of birth for the foreign-born population - Colombia (%)
Place of birth for the foreign-born population - Ecuador (%)
Place of birth for the foreign-born population - Guyana (%)
Place of birth for the foreign-born population - Peru (%)
Place of birth for the foreign-born population - Uruguay (%)
Place of birth for the foreign-born population - Venezuela (%)
Place of birth for the foreign-born population - Other South America (%)
Place of birth for the foreign-born population - Canada (%)
Place of birth for the foreign-born population - Other Northern America (%)
Place of birth for the foreign-born population - Other (%)
Latest news about races in Franklin, IN collected exclusively by city-data.com from local newspapers, TV, and radio stations
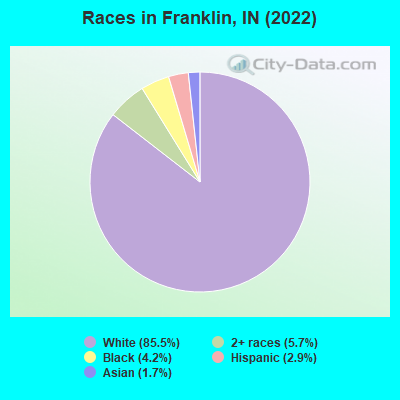
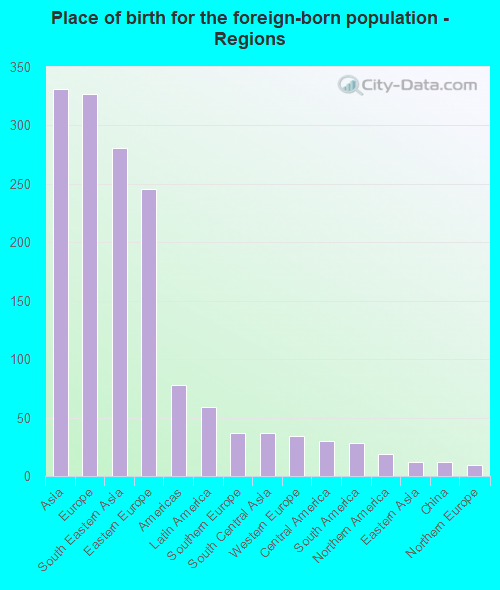
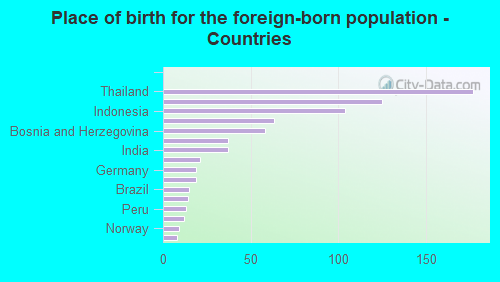
According to 2022 data, the most numerous races in Franklin, IN are White alone (22,824 residents), Black alone (1,129 residents), and Hispanic (771 residents). 95.1% of Franklin residents speak English at home. 2.8% of Franklin, IN residents are foreign-born (1.2% born in Asia, 1.1% born in Europe), which is 117.0% less than the foreign-born rate of 6.0% across the entire state of Indiana.
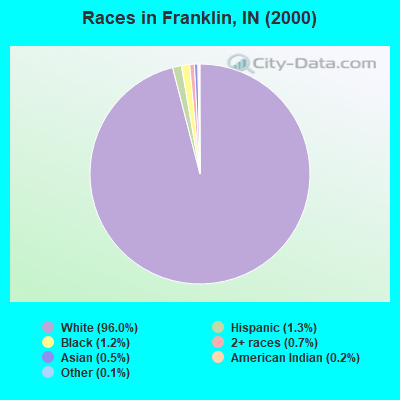
Race distribution in Franklin
2000 2022
5,219,373 85.8% White alone 505,462 8.3% Black alone 214,536 3.5% Hispanic 61,115 1.0% Two or more races 58,424 1.0% Asian alone 13,654 0.2% American Indian alone 6,348 0.1% Other race alone 1,573 0.03% Native Hawaiian and Other
5,192,455 76.0% White alone 628,054 9.2% Black alone 534,528 7.8% Hispanic 263,242 3.9% Two or more races 172,880 2.5% Asian alone 33,467 0.5% Other race alone 5,866 0.09% American Indian alone 2,545 0.04% Native Hawaiian and Other
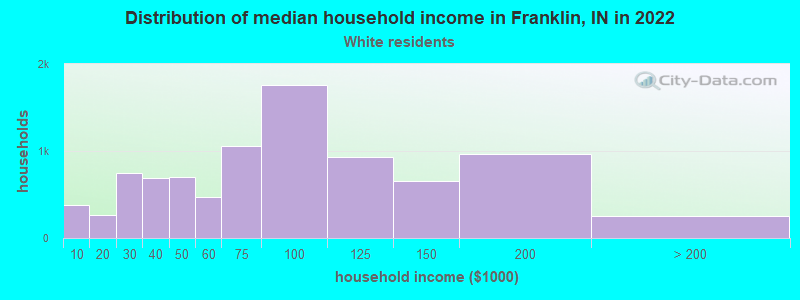
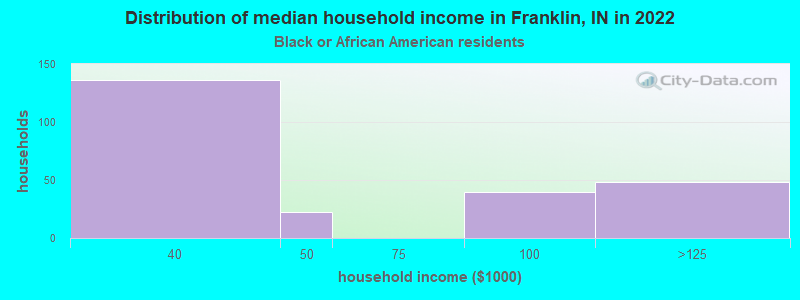
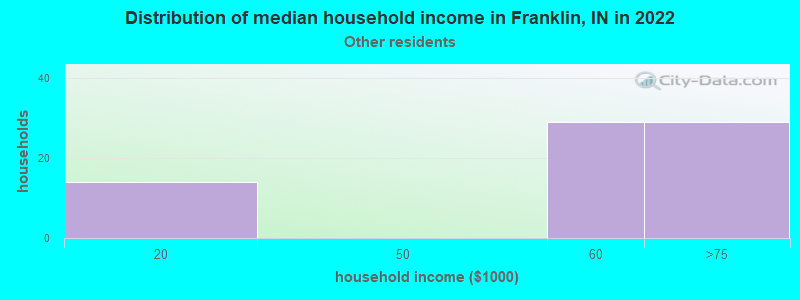
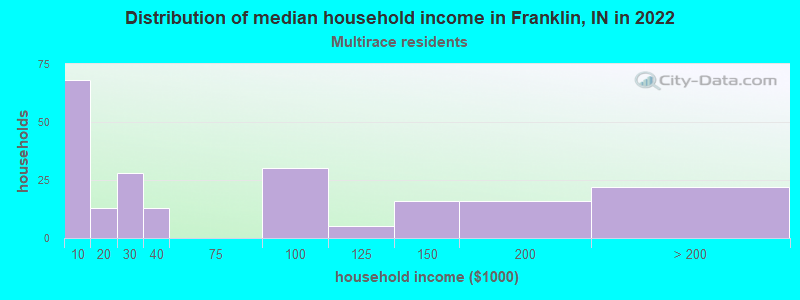
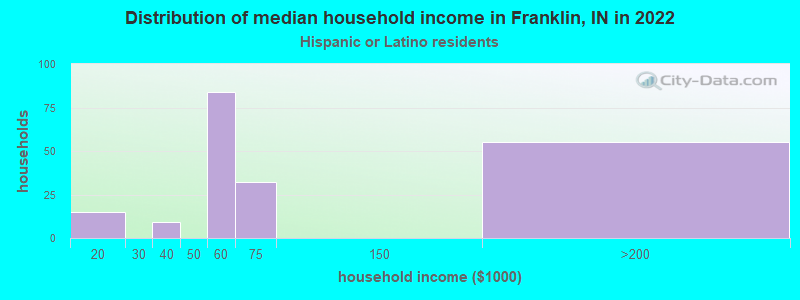
Income and house value in Franklin Median household income in 2022 $73,177 White non-Hispanic householders$38,510 Black householders$63,081 Some other race householders$58,535 Hispanic or Latino race householdersMedian 2022 house value $240,775 White Non-Hispanic householders$261,406 Black or African American householders $307,827 Asian householders$263,751 Some other race householders$263,751 Two or more races householders$263,751 Hispanic or Latino householders
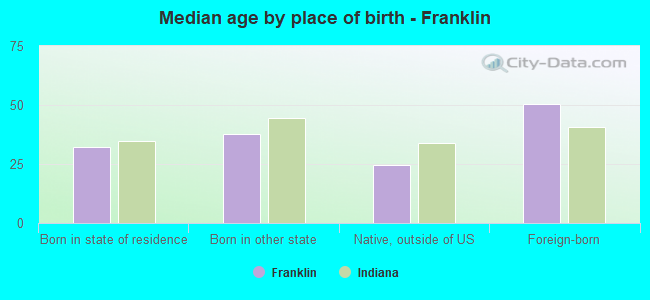
Median age by race in Franklin
36.3 Median age for White residents34.8 36.7 32.5 Median age for Black or African American residents27.4 37.3 -766,310,794.0 Median age for American Indian / Alaska Native residents-654,255,318.5 -655,913,977.8 59.5 Median age for Asian residents31.2 60.4 -664,335,663.7 Median age for Native Hawaiian / Pacific Islander residents-644,025,156.6 -666,666,666.0 44.4 Median age for Other race residents-750,896,056.6 32.4 14.4 Median age for Two or more races residents13.8 11.3 36.3 Median age for White alone residents34.9 36.8 22.8 Median age for Hispanic or Latino residents24.8 15.2
Owner/renter occupied households by race in Franklin
House owners and renters - White residents 6,210 70.6% Owner occupied2,591 29.4% Renter occupiedHouse owners and renters - Black or African American residents 342 77.1% Owner occupied102 22.9% Renter occupiedHouse owners and renters - American Indian / Alaska Native residents 11 100.0% Owner occupiedHouse owners and renters - Asian residents 10 100.0% Owner occupiedHouse owners and renters - Other race residents 14 20.4% Owner occupied56 79.6% Renter occupiedHouse owners and renters - Two or more races residents 124 57.4% Owner occupied92 42.6% Renter occupiedHouse owners and renters - White alone residents 6,153 69.9% Owner occupied2,652 30.1% Renter occupiedHouse owners and renters - Hispanic or Latino residents 161 76.0% Owner occupied51 24.0% Renter occupied
Language usage in Franklin
English speakers - Total 95.1% of residents of Franklin speak English at home.
1.8% of residents speak Spanish at home 409 92.5% Speak English very well33 7.5% Speak English less than very well2.4% of residents speak other language at home 371 60.0% Speak English very well247 40.0% Speak English less than very well
English speakers - Born in the United States 94.4% of residents of Franklin speak English at home.
4.6% of residents speak Spanish at home 213 89.1% Speak English very well26 10.9% Speak English less than very well1.3% of residents speak other language at home 68 100.0% Speak English very well
English speakers - Native, born elsewhere 59.6% of residents of Franklin speak English at home.
8.6% of residents speak Spanish at home 13 100.0% Speak English very well30.5% of residents speak other language at home 46 100.0% Speak English very well
English speakers - Foreign-born 44.9% of residents of Franklin speak English at home.
8.1% of residents speak Spanish at home 54 81.8% Speak English very well12 18.2% Speak English less than very well46.6% of residents speak other language at home 185 48.6% Speak English very well196 51.4% Speak English less than very well
White (Caucasian) - Speak only English Native:
98.1% (21,336)Foreign-born:
48.5% (95)
White (Caucasian) - Speak another language Native:
1.9% (410)Foreign-born:
52.1% (102)
Asian - Speak only English Native:
13.0% (9)Foreign-born:
37.3% (144)
Asian - Speak another language Native:
91.9% (61)Foreign-born:
64.5% (248)
Other race - Speak another language Native:
79.5% (54)Foreign-born:
97.7% (51)
Two or more races - Speak only English Native:
87.4% (1,288)Foreign-born:
19.9% (14)
Two or more races - Speak another language Native:
8.2% (121)Foreign-born:
66.3% (47)
White alone - Speak only English Native:
98.7% (21,209)Foreign-born:
36.7% (102)
White alone - Speak another language Native:
1.4% (297)Foreign-born:
61.4% (171)
Hispanic or Latino - Speak only English Native:
46.9% (264)Foreign-born:
9.8% (9)
Hispanic or Latino - Speak another language Native:
40.0% (225)Foreign-born:
72.5% (67)
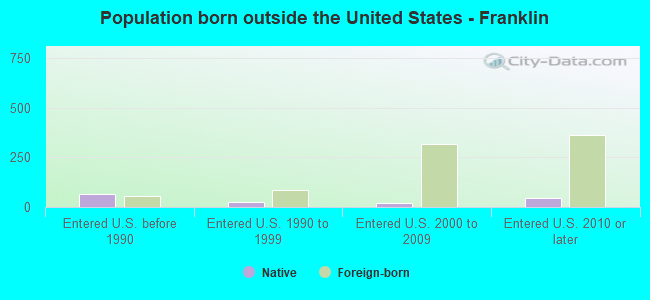
Foreign-born residents in Franklin 738 residents are foreign born (1.2% Asia , 1.1% Europe ).
This city:
2.8%Indiana:
5.6%
Marital status for residents in Franklin Marital status - White (Caucasian) population 15 years and over
Males 32.5% Never married50.6% Now married0.8% Separated1.4% Widowed14.7% DivorcedFemales 29.4% Never married45.5% Now married0.3% Separated13.1% Widowed11.7% DivorcedWomen who gave birth in the past 12 months Now married:
86.4% (128)Unmarried:
13.6% (20)
Women who did not give birth in the past 12 months Now married:
46.3% (2,485)Unmarried:
53.7% (2,881)
Marital status - Black or African American population 15 years and over
Males 52.5% Never married47.5% Now married0.0% Separated0.0% Widowed0.0% DivorcedFemales 65.4% Never married7.9% Now married6.0% Separated0.0% Widowed20.7% DivorcedWomen who did not give birth in the past 12 months Now married:
8.8% (31)Unmarried:
91.2% (324)
Marital status - Asian population 15 years and over
Males 21.0% Never married79.0% Now married0.0% Separated0.0% Widowed0.0% DivorcedFemales 34.8% Never married65.2% Now married0.0% Separated0.0% Widowed0.0% DivorcedWomen who did not give birth in the past 12 months Now married:
13.0% (16)Unmarried:
87.0% (104)
Marital status - Other race population 15 years and over
Males 100.0% Never married0.0% Now married0.0% Separated0.0% Widowed0.0% DivorcedFemales 36.7% Never married63.3% Now married0.0% Separated0.0% Widowed0.0% DivorcedWomen who did not give birth in the past 12 months Now married:
63.3% (46)Unmarried:
36.7% (27)
Marital status - Two or more races population 15 years and over
Males 52.8% Never married41.5% Now married0.0% Separated0.0% Widowed5.7% DivorcedFemales 56.6% Never married28.4% Now married0.0% Separated2.4% Widowed12.6% DivorcedWomen who gave birth in the past 12 months Now married:
100.0% (22)Unmarried:
0.0% (0)
Women who did not give birth in the past 12 months Now married:
14.8% (55)Unmarried:
85.2% (316)
Marital status - White alone, not Hispanic / Latino population 15 years and over
Males 31.4% Never married51.4% Now married0.8% Separated1.4% Widowed15.0% DivorcedFemales 29.4% Never married45.4% Now married0.3% Separated13.1% Widowed11.8% DivorcedWomen who gave birth in the past 12 months Now married:
86.4% (129)Unmarried:
13.6% (20)
Women who did not give birth in the past 12 months Now married:
46.2% (2,445)Unmarried:
53.8% (2,844)
Marital status - Hispanic or Latino population 15 years and over
Males 90.8% Never married6.8% Now married0.0% Separated0.0% Widowed2.4% DivorcedFemales 54.1% Never married39.7% Now married0.0% Separated6.3% Widowed0.0% DivorcedWomen who gave birth in the past 12 months Now married:
100.0% (17)Unmarried:
0.0% (0)
Women who did not give birth in the past 12 months Now married:
36.0% (112)Unmarried:
64.0% (199)
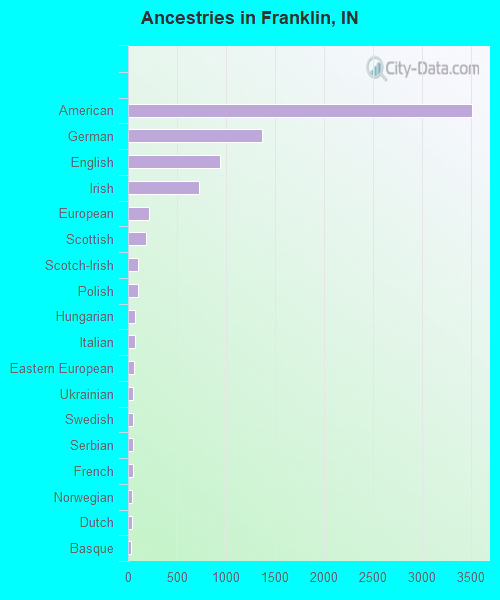
Ancestries in Franklin
3,510 36.2% American1,363 14.0% German942 9.7% English724 7.5% Irish216 2.2% European187 1.9% Scottish104 1.1% Scotch-Irish97 1.0% Polish72 0.7% Hungarian70 0.7% Italian61 0.6% Eastern European56 0.6% Ukrainian47 0.5% Swedish46 0.5% Serbian46 0.5% French40 0.4% Norwegian36 0.4% Dutch35 0.4% Basque25 0.3% Yugoslavian24 0.2% British20 0.2% Danish17 0.2% Latvian16 0.2% Brazilian13 0.1% Pennsylvania German12 0.1% Romanian12 0.1% Lithuanian12 0.1% Welsh10 0.1% Swiss9 0.09% Austrian8 0.08% Iranian5 0.05% Slovak5 0.05% Nigerian4 0.04% Scandinavian4 0.04% Celtic4 0.04% Slovene
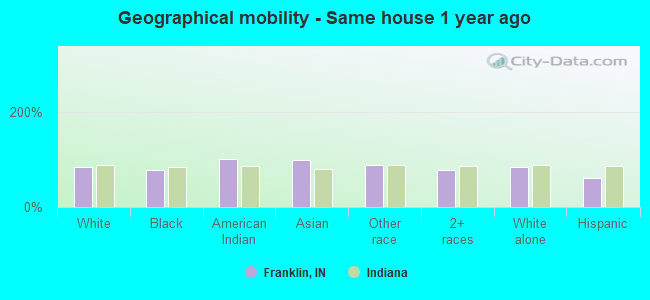
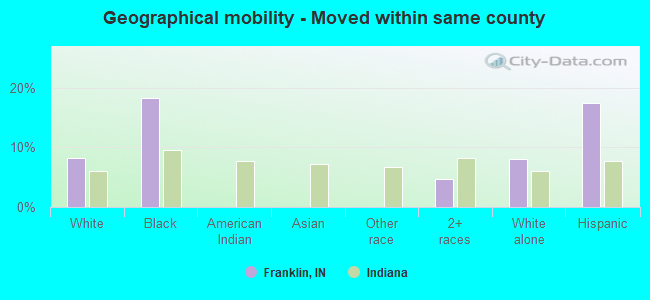
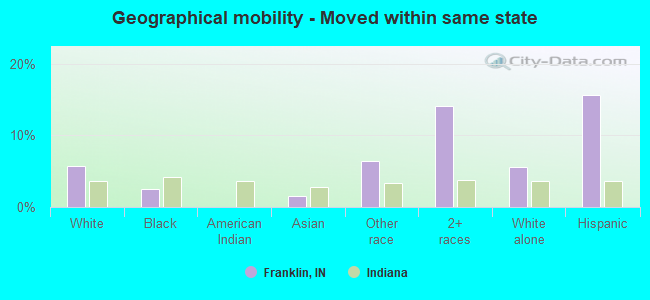
Geographical mobility in Franklin Same house 1 year ago 19,099 83.3% White (Caucasian)770 76.7% Black or African American12 100.0% American Indian / Alaska Native440 99.3% Asian107 89.0% Other race1,406 78.3% Two or more races18,990 83.6% White alone, not Hispanic / Latino439 60.1% Hispanic or LatinoMoved within same county 1,884 8.2% White / Caucasian184 18.3% Black or African American83 4.6% Two or more races1,829 8.1% White alone, not Hispanic / Latino127 17.4% Hispanic or LatinoMoved within same state 1,307 5.7% White / Caucasian25 2.5% Black or African American7 1.5% Asian8 6.5% Other race253 14.1% Two or more races1,273 5.6% White alone, not Hispanic / Latino114 15.7% Hispanic or LatinoMoved from different state 621 2.7% White / Caucasian13 1.3% Black or African American5 3.8% Other race621 2.7% White alone, not Hispanic / LatinoMoved from abroad 27 0.1% White34 1.9% Two or more races27 0.1% White alone, not Hispanic / Latino46 6.3% Hispanic or Latino
Children Nativity (place of birth) in Franklin
Children under 6 years - Living with two parents Both parents native 997 100.0% NativeOne native, one foreign-born parent 47 100.0% NativeChildren under 6 years - Living with one parent Native parent 493 100.0% Native
Children 6 to 17 years - Living with two parents Both parents native 3,821 98.0% Native78 2.0% Foreign-bornOne native, one foreign-born parent 122 100.0% NativeChildren 6 to 17 years - Living with one parent Native parent 917 100.0% Native
Grandparents responsible for own grandchildren in Franklin
Grandparents (30 to 59 years) White / Caucasian 72 28.3% Responsible for grandchildren183 71.7% Not responsible for grandchildrenBlack or African American 46 100.0% Responsible for grandchildrenTwo or more races 22 100.0% Not responsible for grandchildrenWhite alone, not Hispanic / Latino 72 28.3% Responsible for grandchildren183 71.7% Not responsible for grandchildrenGrandparents (60 years and over) White / Caucasian 20 30.2% Responsible for grandchildren45 69.8% Not responsible for grandchildrenWhite alone, not Hispanic / Latino 20 30.2% Responsible for grandchildren45 69.8% Not responsible for grandchildren