Races in Franklin Park, Illinois (IL) Detailed Stats
Data:
Races - White alone (%)
Races - White alone (% change since 2000)
Races - Black alone (%)
Races - Black alone (% change since 2000)
Races - American Indian alone (%)
Races - American Indian alone (% change since 2000)
Races - Asian alone (%)
Races - Asian alone (% change since 2000)
Races - Hispanic (%)
Races - Hispanic (% change since 2000)
Races - Native Hawaiian and Other Pacific Islander alone (%)
Races - Native Hawaiian and Other Pacific Islander alone (% change since 2000)
Races - Two or more races(%)
Races - Two or more races(% change since 2000)
Races - Other race alone (%)
Races - Other race alone (% change since 2000)
Racial diversity
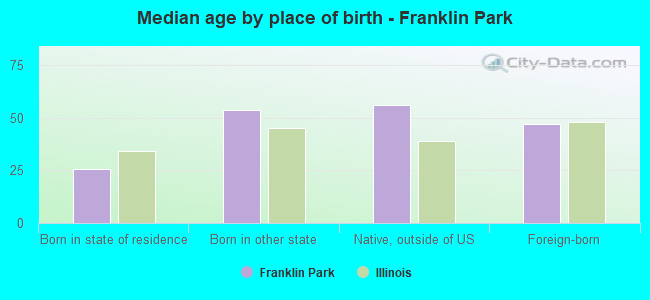
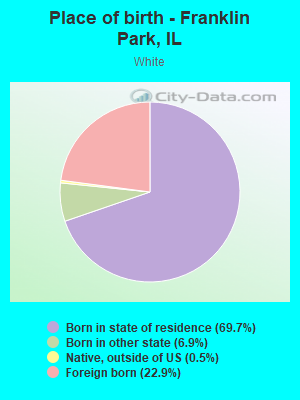
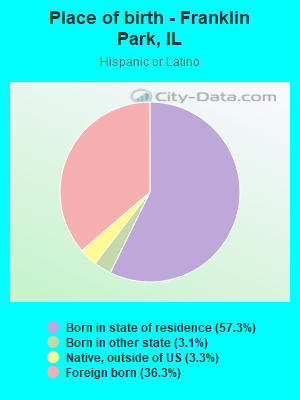
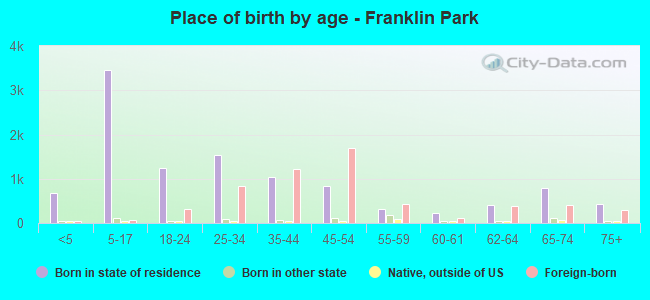
Place of birth - Born in state of residence (%)
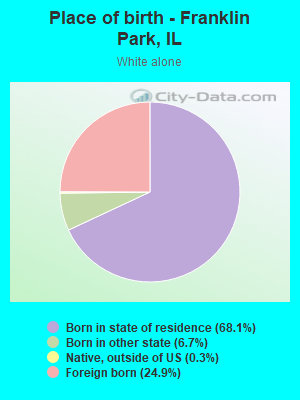
Place of birth - Born in state of residence (%) - White
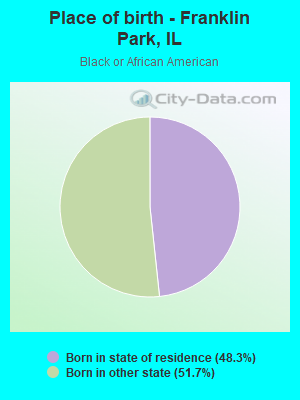
Place of birth - Born in state of residence (%) - Black or African American
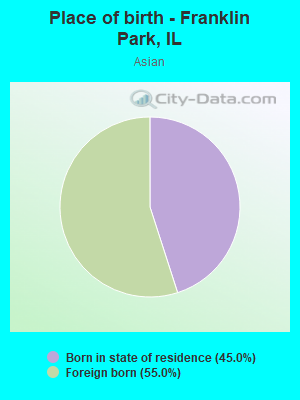
Place of birth - Born in state of residence (%) - Asian
Place of birth - Born in state of residence (%) - Hispanic or Latino
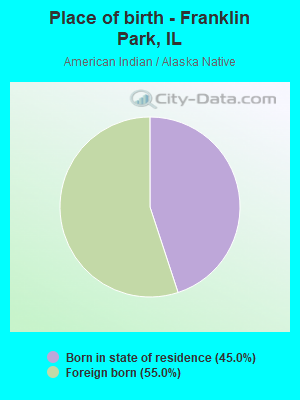
Place of birth - Born in state of residence (%) - American Indian and Alaska Native
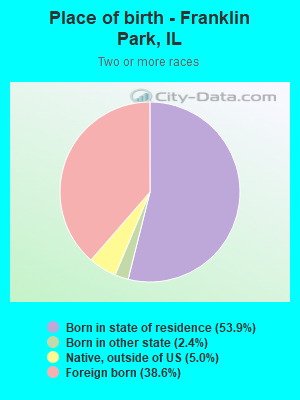
Place of birth - Born in state of residence (%) - Multirace
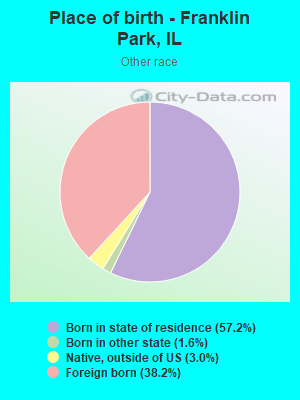
Place of birth - Born in state of residence (%) - Other Race
Place of birth - Born in other state (%)
Place of birth - Born in other state (%) - White
Place of birth - Born in other state (%) - Black or African American
Place of birth - Born in other state (%) - Asian
Place of birth - Born in other state (%) - Hispanic or Latino
Place of birth - Born in other state (%) - American Indian and Alaska Native
Place of birth - Born in other state (%) - Multirace
Place of birth - Born in other state (%) - Other Race
Place of birth - Native, outside of US (%)
Place of birth - Native, outside of US (%) - White
Place of birth - Native, outside of US (%) - Black or African American
Place of birth - Native, outside of US (%) - Asian
Place of birth - Native, outside of US (%) - Hispanic or Latino
Place of birth - Native, outside of US (%) - American Indian and Alaska Native
Place of birth - Native, outside of US (%) - Multirace
Place of birth - Native, outside of US (%) - Other Race
Place of birth - Foreign born (%)
Place of birth - Foreign born (%) - White
Place of birth - Foreign born (%) - Black or African American
Place of birth - Foreign born (%) - Asian
Place of birth - Foreign born (%) - Hispanic or Latino
Place of birth - Foreign born (%) - American Indian and Alaska Native
Place of birth - Foreign born (%) - Multirace
Place of birth - Foreign born (%) - Other Race
Residents speaking English at home (%)
Residents speaking English at home - Born in the United States (%)
Residents speaking English at home - Native, born elsewhere (%)
Residents speaking English at home - Foreign born (%)
Residents speaking Spanish at home (%)
Residents speaking Spanish at home - Born in the United States (%)
Residents speaking Spanish at home - Native, born elsewhere (%)
Residents speaking Spanish at home - Foreign born (%)
Residents speaking other language at home (%)
Residents speaking other language at home - Born in the United States (%)
Residents speaking other language at home - Native, born elsewhere (%)
Residents speaking other language at home - Foreign born (%)
Marital status - Never married (%)
Marital status - Now married (%)
Marital status - Separated (%)
Marital status - Widowed (%)
Marital status - Divorced (%)
Ancestries Reported - Arab (%)
Ancestries Reported - Czech (%)
Ancestries Reported - Danish (%)
Ancestries Reported - Dutch (%)
Ancestries Reported - English (%)
Ancestries Reported - French (%)
Ancestries Reported - French Canadian (%)
Ancestries Reported - German (%)
Ancestries Reported - Greek (%)
Ancestries Reported - Hungarian (%)
Ancestries Reported - Irish (%)
Ancestries Reported - Italian (%)
Ancestries Reported - Lithuanian (%)
Ancestries Reported - Norwegian (%)
Ancestries Reported - Polish (%)
Ancestries Reported - Portuguese (%)
Ancestries Reported - Russian (%)
Ancestries Reported - Scotch-Irish (%)
Ancestries Reported - Scottish (%)
Ancestries Reported - Slovak (%)
Ancestries Reported - Subsaharan African (%)
Ancestries Reported - Swedish (%)
Ancestries Reported - Swiss (%)
Ancestries Reported - Ukrainian (%)
Ancestries Reported - United States (%)
Ancestries Reported - Welsh (%)
Ancestries Reported - West Indian (%)
Ancestries Reported - Other (%)
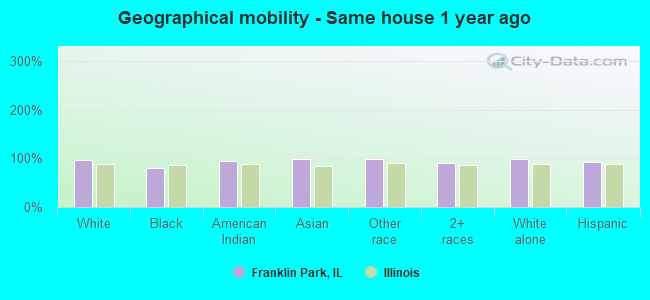
Geographical mobility - Same house 1 year ago (%)
Geographical mobility - Same house 1 year ago (%) - White
Geographical mobility - Same house 1 year ago (%) - Black or African American
Geographical mobility - Same house 1 year ago (%) - Asian
Geographical mobility - Same house 1 year ago (%) - Hispanic or Latino
Geographical mobility - Same house 1 year ago (%) - American Indian and Alaska Native
Geographical mobility - Same house 1 year ago (%) - Multirace
Geographical mobility - Same house 1 year ago (%) - Other Race
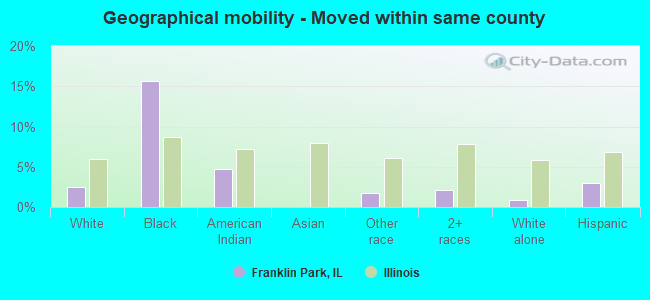
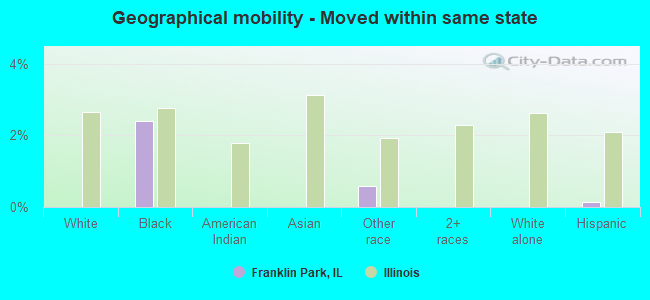
Geographical mobility - Moved within same county (%)
Geographical mobility - Moved within same county (%) - White
Geographical mobility - Moved within same county (%) - Black or African American
Geographical mobility - Moved within same county (%) - Asian
Geographical mobility - Moved within same county (%) - Hispanic or Latino
Geographical mobility - Moved within same county (%) - American Indian and Alaska Native
Geographical mobility - Moved within same county (%) - Multirace
Geographical mobility - Moved within same county (%) - Other Race
Geographical mobility - Moved from different county within same state (%)
Geographical mobility - Moved from different county within same state (%) - White
Geographical mobility - Moved from different county within same state (%) - Black or African American
Geographical mobility - Moved from different county within same state (%) - Asian
Geographical mobility - Moved from different county within same state (%) - Hispanic or Latino
Geographical mobility - Moved from different county within same state (%) - American Indian and Alaska Native
Geographical mobility - Moved from different county within same state (%) - Multirace
Geographical mobility - Moved from different county within same state (%) - Other Race
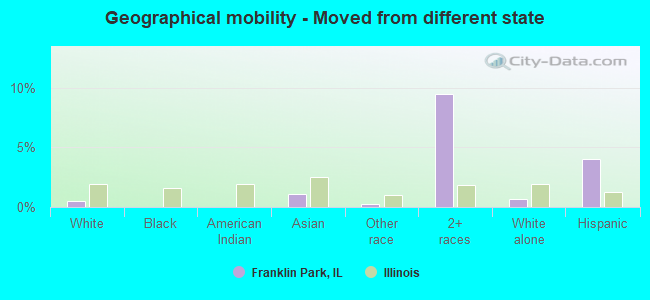
Geographical mobility - Moved from different state (%)
Geographical mobility - Moved from different state (%) - White
Geographical mobility - Moved from different state (%) - Black or African American
Geographical mobility - Moved from different state (%) - Asian
Geographical mobility - Moved from different state (%) - Hispanic or Latino
Geographical mobility - Moved from different state (%) - American Indian and Alaska Native
Geographical mobility - Moved from different state (%) - Multirace
Geographical mobility - Moved from different state (%) - Other Race
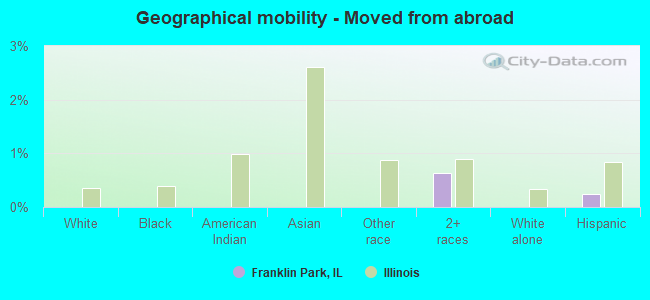
Geographical mobility - Moved from abroad (%)
Geographical mobility - Moved from abroad (%) - White
Geographical mobility - Moved from abroad (%) - Black or African American
Geographical mobility - Moved from abroad (%) - Asian
Geographical mobility - Moved from abroad (%) - Hispanic or Latino
Geographical mobility - Moved from abroad (%) - American Indian and Alaska Native
Geographical mobility - Moved from abroad (%) - Multirace
Geographical mobility - Moved from abroad (%) - Other Race
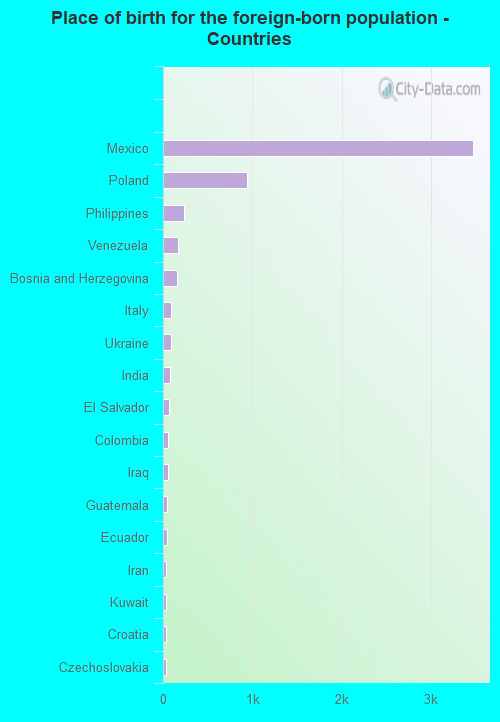
Place of birth for the foreign-born population - Ireland (%)
Place of birth for the foreign-born population - Denmark (%)
Place of birth for the foreign-born population - Norway (%)
Place of birth for the foreign-born population - Sweden (%)
Place of birth for the foreign-born population - United Kingdom (%)
Place of birth for the foreign-born population - England (%)
Place of birth for the foreign-born population - Scotland (%)
Place of birth for the foreign-born population - Other Northern Europe (%)
Place of birth for the foreign-born population - Austria (%)
Place of birth for the foreign-born population - Belgium (%)
Place of birth for the foreign-born population - France (%)
Place of birth for the foreign-born population - Germany (%)
Place of birth for the foreign-born population - Netherlands (%)
Place of birth for the foreign-born population - Switzerland (%)
Place of birth for the foreign-born population - Other Western Europe (%)
Place of birth for the foreign-born population - Greece (%)
Place of birth for the foreign-born population - Italy (%)
Place of birth for the foreign-born population - Portugal (%)
Place of birth for the foreign-born population - Spain (%)
Place of birth for the foreign-born population - Other Southern Europe (%)
Place of birth for the foreign-born population - Albania (%)
Place of birth for the foreign-born population - Belarus (%)
Place of birth for the foreign-born population - Bosnia and Herzegovina (%)
Place of birth for the foreign-born population - Bulgaria (%)
Place of birth for the foreign-born population - Croatia (%)
Place of birth for the foreign-born population - Czechoslovakia (%)
Place of birth for the foreign-born population - Hungary (%)
Place of birth for the foreign-born population - Latvia (%)
Place of birth for the foreign-born population - Lithuania (%)
Place of birth for the foreign-born population - North Macedonia (Macedonia) (%)
Place of birth for the foreign-born population - Moldova (%)
Place of birth for the foreign-born population - Poland (%)
Place of birth for the foreign-born population - Romania (%)
Place of birth for the foreign-born population - Russia (%)
Place of birth for the foreign-born population - Serbia (%)
Place of birth for the foreign-born population - Ukraine (%)
Place of birth for the foreign-born population - Other Eastern Europe (%)
Place of birth for the foreign-born population - China (%)
Place of birth for the foreign-born population - Hong Kong (%)
Place of birth for the foreign-born population - Taiwan (%)
Place of birth for the foreign-born population - Japan (%)
Place of birth for the foreign-born population - Korea (%)
Place of birth for the foreign-born population - Other Eastern Asia (%)
Place of birth for the foreign-born population - Afghanistan (%)
Place of birth for the foreign-born population - Bangladesh (%)
Place of birth for the foreign-born population - India (%)
Place of birth for the foreign-born population - Iran (%)
Place of birth for the foreign-born population - Kazakhstan (%)
Place of birth for the foreign-born population - Nepal (%)
Place of birth for the foreign-born population - Pakistan (%)
Place of birth for the foreign-born population - Sri Lanka (%)
Place of birth for the foreign-born population - Uzbekistan (%)
Place of birth for the foreign-born population - Other South Central Asia (%)
Place of birth for the foreign-born population - Burma (%)
Place of birth for the foreign-born population - Cambodia (%)
Place of birth for the foreign-born population - Indonesia (%)
Place of birth for the foreign-born population - Laos (%)
Place of birth for the foreign-born population - Malaysia (%)
Place of birth for the foreign-born population - Philippines (%)
Place of birth for the foreign-born population - Singapore (%)
Place of birth for the foreign-born population - Thailand (%)
Place of birth for the foreign-born population - Vietnam (%)
Place of birth for the foreign-born population - Other South Eastern Asia (%)
Place of birth for the foreign-born population - Armenia (%)
Place of birth for the foreign-born population - Iraq (%)
Place of birth for the foreign-born population - Israel (%)
Place of birth for the foreign-born population - Jordan (%)
Place of birth for the foreign-born population - Kuwait (%)
Place of birth for the foreign-born population - Lebanon (%)
Place of birth for the foreign-born population - Saudi Arabia (%)
Place of birth for the foreign-born population - Syria (%)
Place of birth for the foreign-born population - Turkey (%)
Place of birth for the foreign-born population - Yemen (%)
Place of birth for the foreign-born population - Other Western Asia (%)
Place of birth for the foreign-born population - Eritrea (%)
Place of birth for the foreign-born population - Ethiopia (%)
Place of birth for the foreign-born population - Kenya (%)
Place of birth for the foreign-born population - Somalia (%)
Place of birth for the foreign-born population - Uganda (%)
Place of birth for the foreign-born population - Zimbabwe (%)
Place of birth for the foreign-born population - Other Eastern Africa (%)
Place of birth for the foreign-born population - Cameroon (%)
Place of birth for the foreign-born population - Congo (%)
Place of birth for the foreign-born population - Democratic Republic of Congo (Zaire) (%)
Place of birth for the foreign-born population - Other Middle Africa (%)
Place of birth for the foreign-born population - Egypt (%)
Place of birth for the foreign-born population - Morocco (%)
Place of birth for the foreign-born population - Sudan (%)
Place of birth for the foreign-born population - Other Northern Africa (%)
Place of birth for the foreign-born population - South Africa (%)
Place of birth for the foreign-born population - Other Southern Africa (%)
Place of birth for the foreign-born population - Cabo Verde (%)
Place of birth for the foreign-born population - Ghana (%)
Place of birth for the foreign-born population - Liberia (%)
Place of birth for the foreign-born population - Nigeria (%)
Place of birth for the foreign-born population - Senegal (%)
Place of birth for the foreign-born population - Sierra Leone (%)
Place of birth for the foreign-born population - Other Western Africa (%)
Place of birth for the foreign-born population - Australia (%)
Place of birth for the foreign-born population - New Zealand (%)
Place of birth for the foreign-born population - Fiji (%)
Place of birth for the foreign-born population - Micronesia (%)
Place of birth for the foreign-born population - Bahamas (%)
Place of birth for the foreign-born population - Barbados (%)
Place of birth for the foreign-born population - Cuba (%)
Place of birth for the foreign-born population - Dominica (%)
Place of birth for the foreign-born population - Dominican Republic (%)
Place of birth for the foreign-born population - Grenada (%)
Place of birth for the foreign-born population - Haiti (%)
Place of birth for the foreign-born population - Jamaica (%)
Place of birth for the foreign-born population - St. Vincent and the Grenadines (%)
Place of birth for the foreign-born population - Trinidad and Tobago (%)
Place of birth for the foreign-born population - West Indies (%)
Place of birth for the foreign-born population - Other Caribbean (%)
Place of birth for the foreign-born population - Belize (%)
Place of birth for the foreign-born population - Costa Rica (%)
Place of birth for the foreign-born population - El Salvador (%)
Place of birth for the foreign-born population - Guatemala (%)
Place of birth for the foreign-born population - Honduras (%)
Place of birth for the foreign-born population - Mexico (%)
Place of birth for the foreign-born population - Nicaragua (%)
Place of birth for the foreign-born population - Panama (%)
Place of birth for the foreign-born population - Other Central America (%)
Place of birth for the foreign-born population - Argentina (%)
Place of birth for the foreign-born population - Bolivia (%)
Place of birth for the foreign-born population - Brazil (%)
Place of birth for the foreign-born population - Chile (%)
Place of birth for the foreign-born population - Colombia (%)
Place of birth for the foreign-born population - Ecuador (%)
Place of birth for the foreign-born population - Guyana (%)
Place of birth for the foreign-born population - Peru (%)
Place of birth for the foreign-born population - Uruguay (%)
Place of birth for the foreign-born population - Venezuela (%)
Place of birth for the foreign-born population - Other South America (%)
Place of birth for the foreign-born population - Canada (%)
Place of birth for the foreign-born population - Other Northern America (%)
Place of birth for the foreign-born population - Other (%)
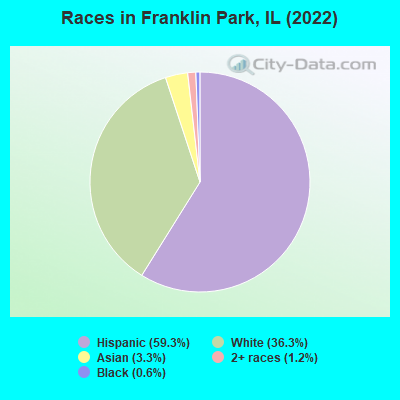
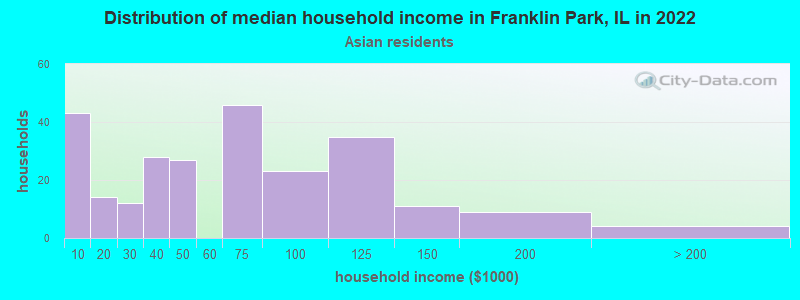
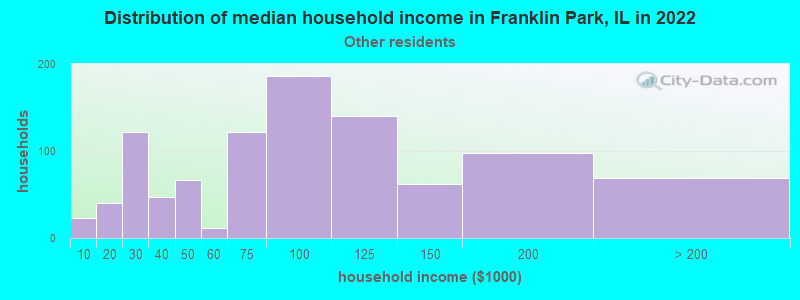
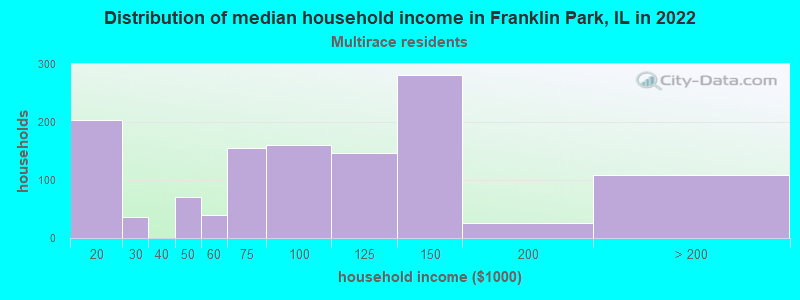
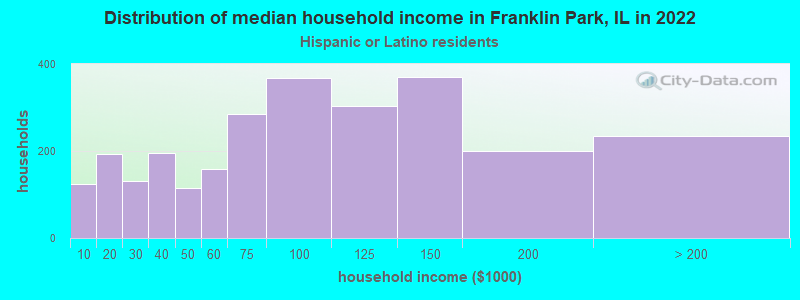
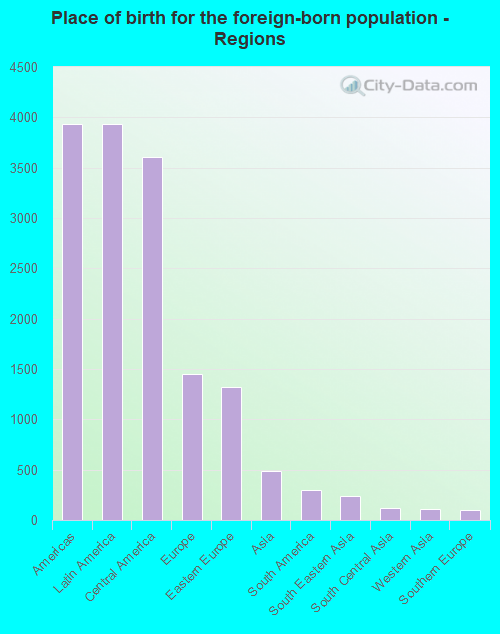
According to 2022 data, the most numerous races in Franklin Park, IL are White alone (6,525 residents), Hispanic (10,652 residents), and Black alone (116 residents). 38.0% of Franklin Park residents speak English at home. 32.6% of Franklin Park, IL residents are foreign-born (21.5% born in Latin America, 7.9% born in Europe), which is 57.1% greater than the foreign-born rate of 14.0% across the entire state of Illinois.
Race distribution in Franklin Park
2000 2022
8,424,140 67.8% White alone 1,856,152 14.9% Black alone 1,530,262 12.3% Hispanic 419,916 3.4% Asian alone 153,996 1.2% Two or more races 13,479 0.1% Other race alone 18,232 0.1% American Indian alone 3,116 0.03% Native Hawaiian and Other
7,356,301 58.5% White alone 2,299,726 18.3% Hispanic 1,660,423 13.2% Black alone 747,296 5.9% Asian alone 458,599 3.6% Two or more races 45,386 0.4% Other race alone 10,405 0.08% American Indian alone 3,896 0.03% Native Hawaiian and Other
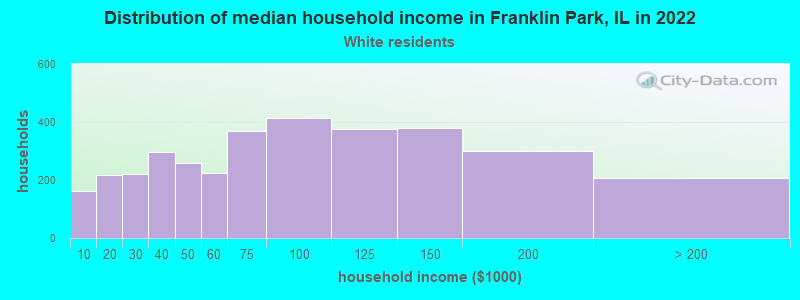
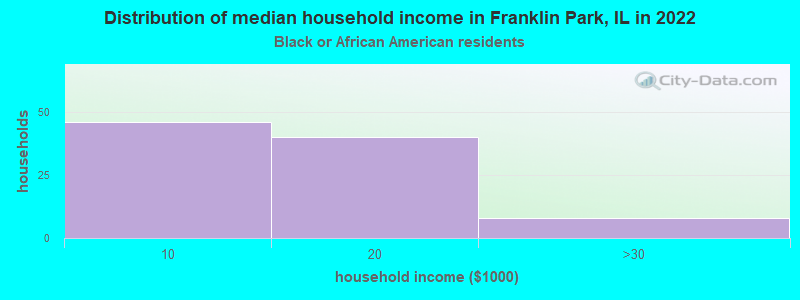
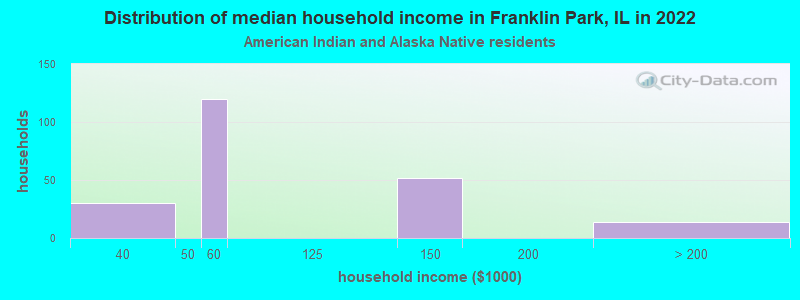
Income and house value in Franklin Park Median household income in 2022 $69,031 White non-Hispanic householders$57,260 American Indian and Alaska Native householders$59,514 Asian householders$81,101 Some other race householders$83,340 Two or more races householders$81,219 Hispanic or Latino race householdersMedian 2022 house value $250,030 White Non-Hispanic householders$230,433 Black or African American householders$240,581 American Indian or Alaska Native householders $245,305 Asian householders$249,505 Some other race householders$309,519 Two or more races householders$261,228 Hispanic or Latino householders
Median age by race in Franklin Park
44.4 Median age for White residents43.5 46.5 33.6 Median age for Black or African American residents65.8 33.9 27.7 Median age for American Indian / Alaska Native residents28.2 42.3 39.1 Median age for Asian residents31.7 39.5 -687,999,999.3 Median age for Native Hawaiian / Pacific Islander residents-918,721,460.3 -610,229,276.3 29.7 Median age for Other race residents28.6 34.3 29.3 Median age for Two or more races residents29.3 28.6 49.5 Median age for White alone residents49.2 50.1 29.9 Median age for Hispanic or Latino residents29.0 31.1
Owner/renter occupied households by race in Franklin Park
House owners and renters - White residents 2,715 79.1% Owner occupied717 20.9% Renter occupiedHouse owners and renters - Black or African American residents 87 100.0% Renter occupiedHouse owners and renters - American Indian / Alaska Native residents 107 42.1% Owner occupied147 57.9% Renter occupiedHouse owners and renters - Asian residents 201 77.6% Owner occupied58 22.4% Renter occupiedHouse owners and renters - Other race residents 658 67.1% Owner occupied323 32.9% Renter occupiedHouse owners and renters - Two or more races residents 868 68.6% Owner occupied397 31.4% Renter occupiedHouse owners and renters - White alone residents 2,440 80.9% Owner occupied577 19.1% Renter occupiedHouse owners and renters - Hispanic or Latino residents 1,727 65.1% Owner occupied925 34.9% Renter occupied
Language usage in Franklin Park
English speakers - Total 38.0% of residents of Franklin Park speak English at home.
46.8% of residents speak Spanish at home 4,422 54.9% Speak English very well3,637 45.1% Speak English less than very well15.9% of residents speak other language at home 1,883 68.9% Speak English very well848 31.1% Speak English less than very well
English speakers - Born in the United States 66.3% of residents of Franklin Park speak English at home.
25.4% of residents speak Spanish at home 204 100.0% Speak English very well7.3% of residents speak other language at home 59 100.0% Speak English very well
English speakers - Native, born elsewhere 13.2% of residents of Franklin Park speak English at home.
85.3% of residents speak Spanish at home 153 55.0% Speak English very well125 45.0% Speak English less than very well
English speakers - Foreign-born 4.6% of residents of Franklin Park speak English at home.
67.0% of residents speak Spanish at home 909 23.3% Speak English very well2,985 76.7% Speak English less than very well29.2% of residents speak other language at home 865 50.9% Speak English very well834 49.1% Speak English less than very well
White (Caucasian) - Speak only English Native:
73.3% (4,331)Foreign-born:
8.6% (155)
White (Caucasian) - Speak another language Native:
22.3% (1,315)Foreign-born:
91.0% (1,637)
American Indian / Alaska Native - Speak another language Native:
27.7% (80)Foreign-born:
100.0% (339)
Asian - Speak only English Native:
36.8% (142)Foreign-born:
7.5% (35)
Asian - Speak another language Native:
63.1% (243)Foreign-born:
93.0% (435)
Other race - Speak only English Native:
17.2% (391)Foreign-born:
3.6% (53)
Other race - Speak another language Native:
82.2% (1,874)Foreign-born:
96.5% (1,409)
Two or more races - Speak only English Native:
42.6% (1,376)Foreign-born:
0.4% (9)
Two or more races - Speak another language Native:
58.5% (1,888)Foreign-born:
99.6% (2,226)
White alone - Speak only English Native:
79.1% (3,792)Foreign-born:
9.6% (156)
White alone - Speak another language Native:
22.2% (1,064)Foreign-born:
91.1% (1,480)
Hispanic or Latino - Speak only English Native:
34.8% (2,187)Foreign-born:
1.7% (66)
Hispanic or Latino - Speak another language Native:
65.3% (4,098)Foreign-born:
98.6% (3,764)
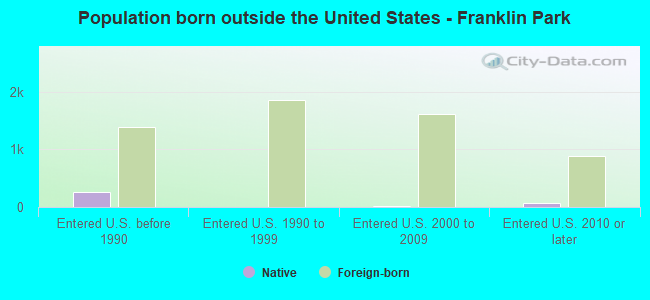
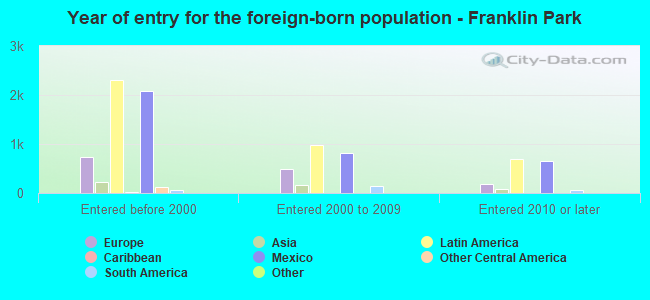
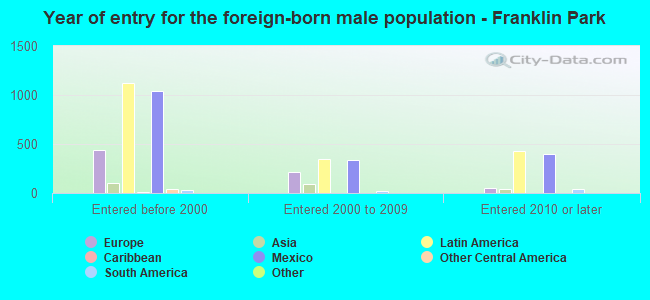
Foreign-born residents in Franklin Park 5,865 residents are foreign born (21.5% Latin America , 7.9% Europe ).
This city:
32.6%Illinois:
14.1%
Marital status for residents in Franklin Park Marital status - White (Caucasian) population 15 years and over
Males 37.9% Never married51.4% Now married0.0% Separated2.7% Widowed8.0% DivorcedFemales 27.2% Never married48.5% Now married1.7% Separated7.4% Widowed15.2% DivorcedWomen who gave birth in the past 12 months Now married:
88.2% (64)Unmarried:
11.8% (8)
Women who did not give birth in the past 12 months Now married:
46.8% (858)Unmarried:
53.2% (975)
Marital status - Black or African American population 15 years and over
Males 100.0% Never married0.0% Now married0.0% Separated0.0% Widowed0.0% DivorcedFemales 71.0% Never married20.4% Now married8.6% Separated0.0% Widowed0.0% DivorcedWomen who did not give birth in the past 12 months Now married:
24.7% (18)Unmarried:
75.3% (55)
Marital status - American Indian / Alaska Native population 15 years and over
Males 73.6% Never married26.4% Now married0.0% Separated0.0% Widowed0.0% DivorcedFemales 23.4% Never married26.9% Now married6.9% Separated0.0% Widowed42.8% DivorcedWomen who did not give birth in the past 12 months Now married:
53.4% (70)Unmarried:
46.6% (61)
Marital status - Asian population 15 years and over
Males 21.3% Never married77.0% Now married0.0% Separated0.0% Widowed1.7% DivorcedFemales 18.2% Never married70.0% Now married3.9% Separated1.6% Widowed6.2% DivorcedWomen who did not give birth in the past 12 months Now married:
72.7% (129)Unmarried:
27.3% (48)
Marital status - Other race population 15 years and over
Males 50.4% Never married42.0% Now married4.6% Separated3.1% Widowed0.0% DivorcedFemales 45.4% Never married40.3% Now married5.0% Separated6.5% Widowed2.8% DivorcedWomen who gave birth in the past 12 months Now married:
0.0% (0)Unmarried:
100.0% (28)
Women who did not give birth in the past 12 months Now married:
43.1% (418)Unmarried:
56.9% (552)
Marital status - Two or more races population 15 years and over
Males 48.9% Never married39.3% Now married9.1% Separated0.1% Widowed2.5% DivorcedFemales 71.9% Never married23.4% Now married0.0% Separated1.9% Widowed2.8% DivorcedWomen who gave birth in the past 12 months Now married:
100.0% (11)Unmarried:
0.0% (0)
Women who did not give birth in the past 12 months Now married:
18.5% (293)Unmarried:
81.5% (1,293)
Marital status - White alone, not Hispanic / Latino population 15 years and over
Males 34.1% Never married52.6% Now married0.0% Separated3.5% Widowed9.8% DivorcedFemales 23.9% Never married47.6% Now married0.6% Separated8.5% Widowed19.3% DivorcedWomen who gave birth in the past 12 months Now married:
88.2% (71)Unmarried:
11.8% (10)
Women who did not give birth in the past 12 months Now married:
47.2% (620)Unmarried:
52.8% (695)
Marital status - Hispanic or Latino population 15 years and over
Males 50.8% Never married42.1% Now married4.7% Separated1.2% Widowed1.2% DivorcedFemales 52.1% Never married36.8% Now married3.1% Separated3.8% Widowed4.3% DivorcedWomen who gave birth in the past 12 months Now married:
0.0% (0)Unmarried:
100.0% (25)
Women who did not give birth in the past 12 months Now married:
35.4% (1,020)Unmarried:
64.6% (1,866)
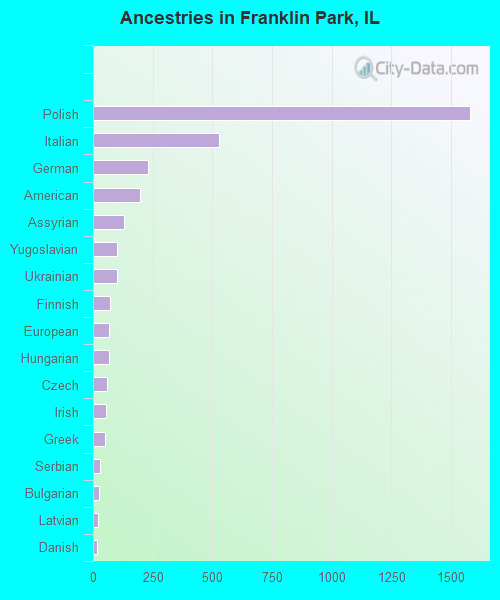
Ancestries in Franklin Park
1,581 14.1% Polish530 4.7% Italian229 2.0% German195 1.7% American128 1.1% Assyrian102 0.9% Yugoslavian100 0.9% Ukrainian70 0.6% Finnish65 0.6% European65 0.6% Hungarian60 0.5% Czech56 0.5% Irish50 0.4% Greek31 0.3% Serbian24 0.2% Bulgarian21 0.2% Latvian16 0.1% Danish13 0.1% Belgian13 0.1% Romanian9 0.08% Swedish8 0.07% Brazilian8 0.07% French8 0.07% Jamaican7 0.06% Austrian7 0.06% Dutch7 0.06% Slovak6 0.05% English5 0.04% Welsh2 0.02% Scottish
Children Nativity (place of birth) in Franklin Park
Children under 6 years - Living with two parents Both parents native 209 100.0% NativeBoth parents foreign-born 207 89.3% Native25 10.7% Foreign-bornOne native, one foreign-born parent 191 100.0% NativeChildren under 6 years - Living with one parent Native parent 120 100.0% NativeForeign-born parent 149 76.8% Native45 23.2% Foreign-bornChildren 6 to 17 years - Living with two parents Both parents native 643 100.0% NativeBoth parents foreign-born 911 92.8% Native71 7.2% Foreign-bornOne native, one foreign-born parent 343 100.0% NativeChildren 6 to 17 years - Living with one parent Native parent 770 100.0% NativeForeign-born parent 673 50.1% Native671 49.9% Foreign-born
Grandparents responsible for own grandchildren in Franklin Park
Grandparents (30 to 59 years) White / Caucasian 17 17.8% Responsible for grandchildren79 82.2% Not responsible for grandchildrenOther race 30 100.0% Not responsible for grandchildrenTwo or more races 132 100.0% Not responsible for grandchildrenWhite alone, not Hispanic / Latino 23 48.6% Responsible for grandchildren24 51.4% Not responsible for grandchildrenHispanic or Latino 198 100.0% Not responsible for grandchildrenGrandparents (60 years and over) White / Caucasian 38 34.0% Responsible for grandchildren73 66.0% Not responsible for grandchildrenOther race 14 39.8% Responsible for grandchildren21 60.2% Not responsible for grandchildrenTwo or more races 44 100.0% Not responsible for grandchildrenWhite alone, not Hispanic / Latino 46 35.0% Responsible for grandchildren85 65.0% Not responsible for grandchildrenHispanic or Latino 25 31.2% Responsible for grandchildren56 68.8% Not responsible for grandchildren